

Determining the Potential Roles of Branched-Chain Amino Acids in the Regulation of Muscle Growth in Common Carp (Cyprinus carpio) Based on Transcriptome and MicroRNA Sequencing
- PMID: 37303609
- PMCID: PMC10257547
- DOI: 10.1155/2023/7965735
Determining the Potential Roles of Branched-Chain Amino Acids in the Regulation of Muscle Growth in Common Carp (Cyprinus carpio) Based on Transcriptome and MicroRNA Sequencing
Abstract
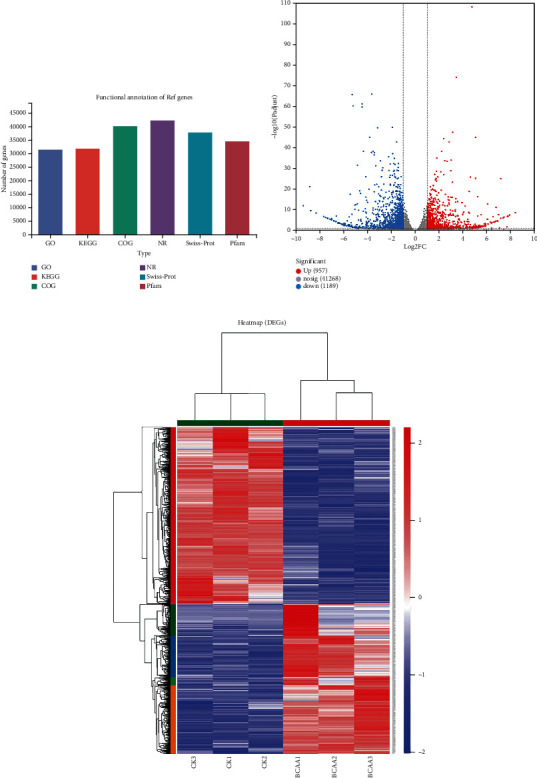
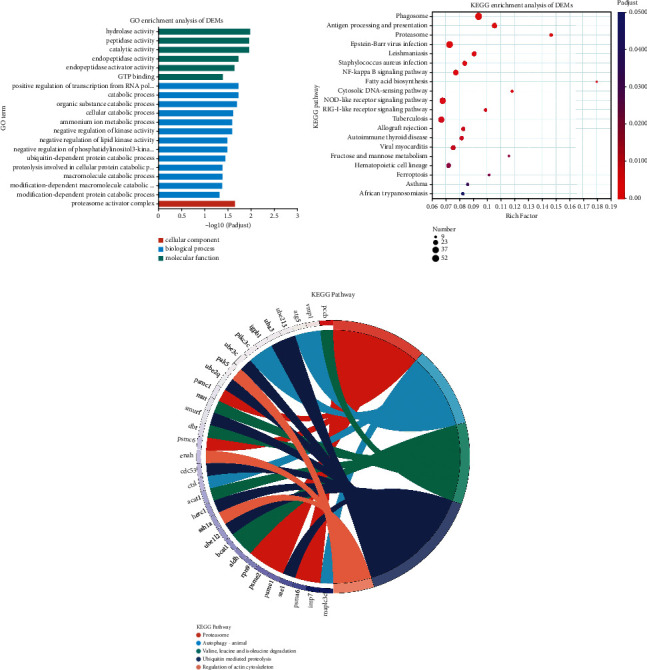
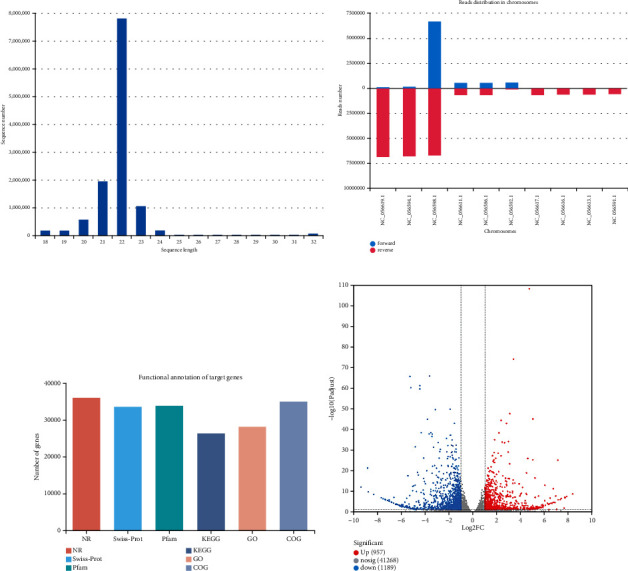
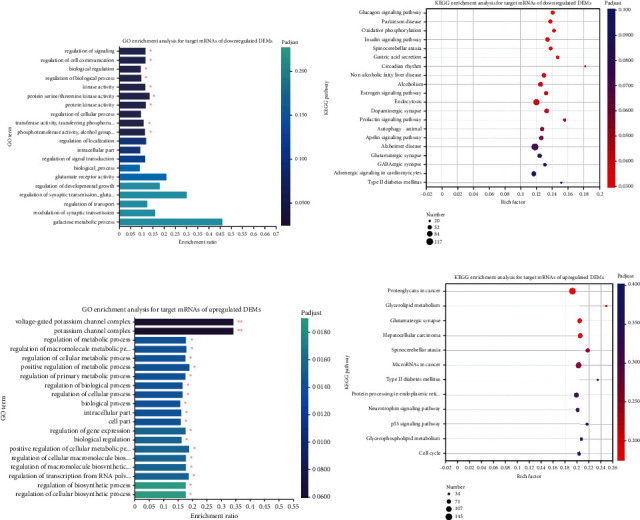
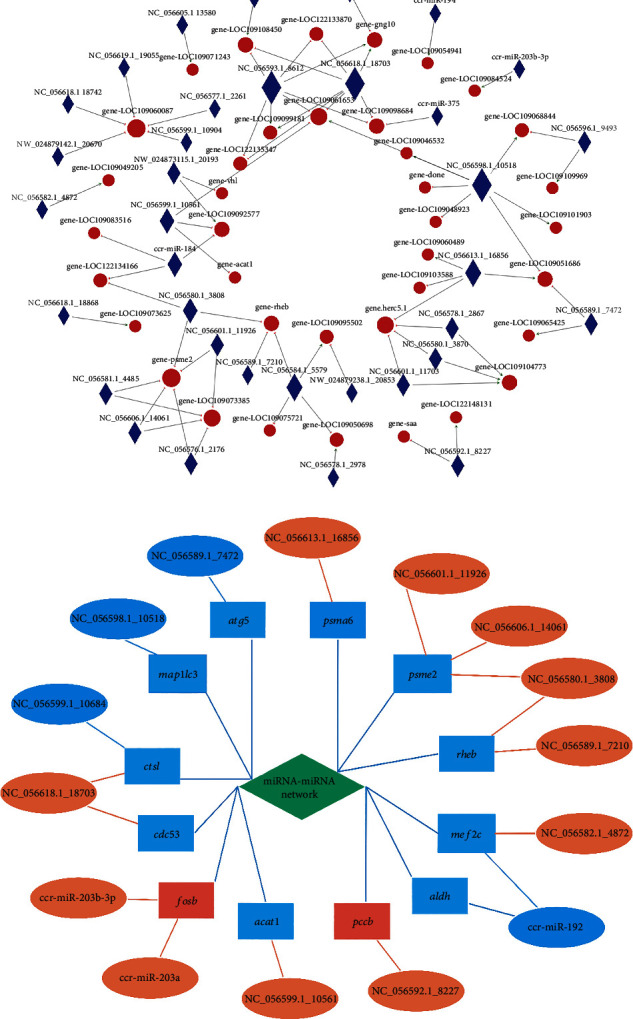
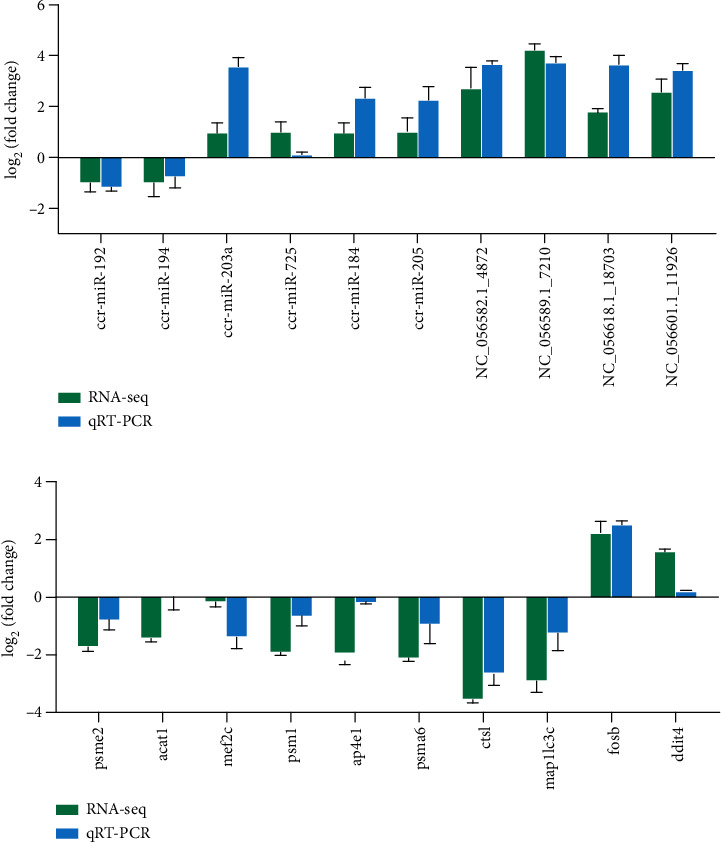
Branched-chain amino acids (BCAAs) can be critically involved in skeletal muscle growth and body energy homeostasis. Skeletal muscle growth is a complex process; some muscle-specific microRNAs (miRNAs) are involved in the regulation of muscle thickening and muscle mass. Additionally, the regulatory network between miRNA and messenger RNA (mRNA) in the modulation of the role of BCAAs on skeletal muscle growth in fish has not been studied. In this study, common carp was starved for 14 days, followed by a 14-day gavage therapy with BCAAs, to investigate some of the miRNAs and genes that contribute to the regulation of normal growth and maintenance of skeletal muscle in response to short-term BCAA starvation stress. Subsequently, the transcriptome and small RNAome sequencing of carp skeletal muscle were performed. A total of 43,414 known and 1,112 novel genes were identified, in addition to 142 known and 654 novel miRNAs targeting 22,008 and 33,824 targets, respectively. Based on their expression profiles, 2,146 differentially expressed genes (DEGs) and 84 differentially expressed miRNA (DEMs) were evaluated. Kyoto Encyclopedia of Genes and Genome pathways, including the proteasome, phagosome, autophagy in animals, proteasome activator complex, and ubiquitin-dependent protein catabolic process, were enriched for these DEGs and DEMs. Our findings revealed the role of atg5, map1lc3c, ctsl, cdc53, psma6, psme2, myl9, and mylk in skeletal muscle growth, protein synthesis, and catabolic metabolism. Furthermore, miR-135c, miR-192, miR-194, and miR-203a may play key roles in maintaining the normal activities of the organism by regulating genes related to muscle growth, protein synthesis, and catabolism. This study on transcriptome and miRNA reveals the potential molecular mechanisms underlying the regulation of muscle protein deposition and provides new insights into genetic engineering techniques to improve common carp muscle development.
Copyright © 2023 Xianglin Cao et al.
Conflict of interest statement
There is no any conflict of interest.
Figures
Similar articles
-
Branched-Chain Amino Acids Target miR-203a/fosb Axis to Promote Skeletal Muscle Growth in Common Carp (Cyprinus carpio).Aquac Nutr. 2025 Feb 26;2025:9406490. doi: 10.1155/anu/9406490. eCollection 2025. Aquac Nutr. 2025. PMID: 40046093 Free PMC article.
-
Integrating miRNA and full-length transcriptome profiling to elucidate the mechanism of muscle growth in Muscovy ducks reveals key roles for miR-301a-3p/ANKRD1.BMC Genomics. 2024 Apr 4;25(1):340. doi: 10.1186/s12864-024-10138-z. BMC Genomics. 2024. PMID: 38575872 Free PMC article.
-
Altered miRNA and mRNA Expression in Sika Deer Skeletal Muscle with Age.Genes (Basel). 2020 Feb 6;11(2):172. doi: 10.3390/genes11020172. Genes (Basel). 2020. PMID: 32041309 Free PMC article.
-
mRNA and microRNA transcriptomics analyses in intermuscular bones of two carp species, rice flower carp (Cyprinus carpio var. Quanzhounensis) and Jian carp (Cyprinus carpio var. Jian).Comp Biochem Physiol Part D Genomics Proteomics. 2019 Jun;30:71-80. doi: 10.1016/j.cbd.2019.01.013. Epub 2019 Jan 30. Comp Biochem Physiol Part D Genomics Proteomics. 2019. PMID: 30785072
-
Identification of Genes Related to Growth and Lipid Deposition from Transcriptome Profiles of Pig Muscle Tissue.PLoS One. 2015 Oct 27;10(10):e0141138. doi: 10.1371/journal.pone.0141138. eCollection 2015. PLoS One. 2015. PMID: 26505482 Free PMC article.
Cited by
-
Branched-Chain Amino Acids Target miR-203a/fosb Axis to Promote Skeletal Muscle Growth in Common Carp (Cyprinus carpio).Aquac Nutr. 2025 Feb 26;2025:9406490. doi: 10.1155/anu/9406490. eCollection 2025. Aquac Nutr. 2025. PMID: 40046093 Free PMC article.
-
Identification of key genes related to growth of largemouth bass (Micropterus salmoides) based on comprehensive transcriptome analysis.Front Mol Biosci. 2024 Dec 11;11:1499220. doi: 10.3389/fmolb.2024.1499220. eCollection 2024. Front Mol Biosci. 2024. PMID: 39726434 Free PMC article.
-
Transcriptome Analysis Reveals the Potential Key Genes in Nutritional Deposition in the Common Carp (Cyprinus carpio).Animals (Basel). 2024 Jun 30;14(13):1939. doi: 10.3390/ani14131939. Animals (Basel). 2024. PMID: 38998051 Free PMC article.
-
Hub biomarkers in ultrasound-guided bladder cancer and osteosarcoma: Myosin light chain kinase and caldesmon.Medicine (Baltimore). 2023 Dec 1;102(48):e36414. doi: 10.1097/MD.0000000000036414. Medicine (Baltimore). 2023. PMID: 38050320 Free PMC article.
References
-
- Zeng L. Q., Li F. J., Li X. M., Cao Z. D., Fu S. J., Zhang Y. G. The effects of starvation on digestive tract function and structure in juvenile southern catfish (Silurus meridionalis Chen) Comparative Biochemistry and Physiology Part A: Molecular & Integrative Physiology . 2012;162(3):200–211. doi: 10.1016/j.cbpa.2012.02.022. - DOI - PubMed
-
- Hernandez R. J., Kravitz L. The mystery of skeletal muscle hypertrophy. ACSM’s Health & Fitness Journal . 2003;7(2):18–22.
LinkOut - more resources
Full Text Sources
Research Materials
Miscellaneous