. 2023 May 25:14:1181245.
doi: 10.3389/fmicb.2023.1181245. eCollection 2023.

Effects of SMOF on soil properties, root-zone microbial community structure, metabolites, and maize (Zea mays L.) response on a reclaimed barren mountainous land

Affiliations

Effects of SMOF on soil properties, root-zone microbial community structure, metabolites, and maize (Zea mays L.) response on a reclaimed barren mountainous land

Xuqing Li et al. Front Microbiol. .

Abstract

Introduction: Maize is the largest crop produced in China. With the growing population and the rapid development of urbanization and industrialization, maize has been recently cultivated in reclaimed barren mountainous lands in Zhejiang Province, China. However, the soil is usually not suitable for cultivation because of its low pH and poor nutrient conditions. To improve soil quality for crop growth, various fertilizers, including inorganic, organic, and microbial fertilizers, were used in the field. Among them, organic fertilizer-based sheep manure greatly improved the soil quality and has been widely adopted in reclaimed barren mountainous lands. But the mechanism of action was not well clear.

Methods: The field experiment (SMOF, COF, CCF and the control) was carried out on a reclaimed barren mountainous land in Dayang Village, Hangzhou City, Zhejiang Province, China. To systematically evaluate the effect of SMOF on reclaimed barren mountainous lands, soil properties, the root-zone microbial community structure, metabolites, and maize response were investigated.

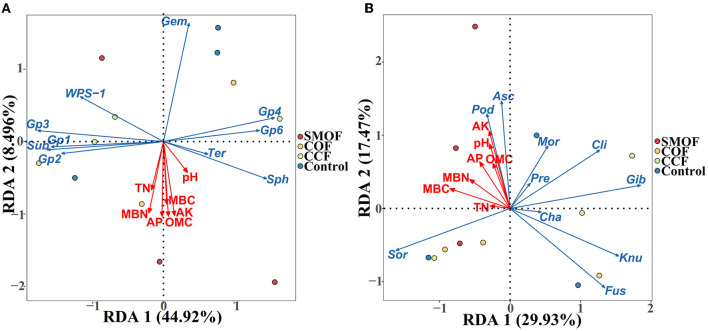
Results: Compared with the control, SMOF could not significantly affect the soil pH but caused 46.10%, 28.28%, 101.94%, 56.35%, 79.07%, and 76.07% increases in the OMC, total N, available P, available K, MBC, and MBN, respectively. Based on 16S amplicon sequencing of soil bacteria, compared with the control, SMOF caused a 11.06-334.85% increase in the RA of Ohtaekwangia, Sphingomonas, unclassified_Sphingomonadaceae, and Saccharibacteria and a 11.91-38.60% reduction in the RA of Spartobacteria, Gemmatimonas, Gp4, Flavisolibacter, Subdivision3, Gp6, and unclassified_Betaproteobacteria, respectively. Moreover, based on ITS amplicon sequencing of soil fungi, SMOF also caused a 42.52-330.86% increase in the RA of Podospora, Clitopilus, Ascobolus, Mortierella, and Sordaria and a 20.98-64.46% reduction in the RA of Knufia, Fusarium, Verticillium, and Gibberella, respectively, compared with the control. RDA of microbial communities and soil properties revealed that the main variables of bacterial and fungal communities included available K, OMC, available P, MBN, and available K, pH, and MBC, respectively. In addition, LC-MS analysis indicated that 15 significant DEMs belonged to benzenoids, lipids, organoheterocyclic compounds, organic acids, phenylpropanoids, polyketides, and organic nitrogen compounds in SMOF and the control group, among which four DEMs were significantly correlated with two genera of bacteria and 10 DEMs were significantly correlated with five genera of fungi. The results revealed complicated interactions between microbes and DEMs in the soil of the maize root zone. Furthermore, the results of field experiments demonstrated that SMOF could cause a significant increase in maize ears and plant biomass.

Conclusions: Overall, the results of this study showed that the application of SMOF not only significantly modified the physical, chemical, and biological properties of reclaimed barren mountainous land but also promoted maize growth. SMOF can be used as a good amendment for maize production in reclaimed barren mountainous lands.

Keywords: SMOF; maize; metabonomics; microbial community; reclaimed barren mountainous land; soil property.


Conflict of interest statement

The authors declare that the research was conducted in the absence of any commercial or financial relationships that could be construed as a potential conflict of interest.

Figures

Figure 1
Figure 1
Impacts of SMOF on the OTU distribution, Chao1 richness index, Shannon's diversity index, and Simpson's diversity index of microbes in maize root-zone soil. (A) Bacteria, (B) fungi. Different lowercase letters above columns indicate statistical differences (p < 0.05).
Figure 2
Figure 2
Relative abundance (RA) of the top 10 dominant bacterial (A, B) and fungal (C, D) classes and genera in four different treatments, respectively.
Figure 3
Figure 3
Principal component analysis (PCA) of the maize root-zone bacterial (A) and fungal (B) communities based on OTU abundance. Ellipses have been drawn for each treatment with a confidence limit of 0.95.
Figure 4
Figure 4
Linear discriminant analysis (LDA) effect size (LEfSe) of the bacterial (A) and fungal (B) taxa, which identifies the most differentially abundant taxa among SMOF, COF, CCF, and the control in different treatments. Only bacterial taxa with LDA values greater than two and fungal taxa with LDA values >2.5 (p < 0.05) are shown.
Figure 5
Figure 5
Hierarchical clustering analysis and heat maps of dominant bacterial and fungal community abundance at class (A, B) and genus (C, D) levels, respectively. The tree plot represents a clustering analysis of the dominant bacteria and fungi at class and genus levels according to their Pearson correlation coefficient matrix and relative abundance, and the upper tree plot represents a clustering analysis of soil samples according to the Euclidean distance of the data, respectively.
Figure 6
Figure 6
Redundancy discriminant analysis (RDA) of the root-zone microbial community compositions at genus levels with soil properties. (A) Bacteria. Gem, Gemmatimonas; Sph, Sphingomonas; Sub, Subdivision3; Ter, Terrimonas. (B) Fungi. Asc, Ascobolus; Cha, Chaetomium; Cli, Clitopilus; Fus, Fusarium; Gib, Gibberella; Knu, Knufia; Mor, Mortierella; Pod, Podospora; Pre, Preussia; Sor, Sordaria. OMC, organic matter contains; TN, total N; AP, available P; AK, available K; MBC, microbial biomass carbon; MBN, microbial biomass nitrogen. Arrows indicate the direction and magnitude of soil properties (pH, OMC, total N, AP, AK, MBC, and MBN) associated with the different bacterial and fungal genera.
Figure 7
Figure 7
Impacts of SMOF on the co-occurrence patterns of soil bacterial (A) and fungal (B) communities. Networks were constructed at the OTU level. The size of the nodes (OTUs) represented the relative abundance (RA) of the microbe, and the nodes were colored according to phylum. The red and green lines represented positive and negative correlations, respectively.
Figure 8
Figure 8
Orthogonal projections to latent structures-discriminant analysis (OPLS-DA) score map of maize root-zone soil of the SMOF (A), COF (B), and CCF (C) treatment. Volcano plot of differentially accumulated metabolites in SMOF vs. the control (D), COF vs. the control (E), and CCF vs. the control (F). Each point represents a metabolite with VIP > 1 and p < 0.05. A blue point indicates metabolites that are downregulated, a red point indicates metabolites that are upregulated, and a gray point indicates non-significant metabolites.
Figure 9
Figure 9
Donut plot of metabolite classification and proportion (A), Venn analysis for three groups (B). The number of differentially expressed metabolites (DEMs) in the groups of SMOF and the control (C), COF and the control (D), and CCF and the control (E).
Figure 10
Figure 10
Heat map of hierarchical clustering analysis for groups SMOF, COF, or CCF vs. the control. The tree plot represents a clustering analysis of the differentially expressed metabolites (DEMs) significantly changed by SMOF, COF, or CCF according to their Person correlation coefficient matrix and relative abundance.
Figure 11
Figure 11
Chord plot analysis for the groups of SMOF and the control (A), COF and the control (C), CCF and the control (E), respectively. Nodes represent variables; text color is associated with different metabolites, and chords represent correlations. Matchstick analysis for the groups of SMOF and the control (B), COF and the control (D), and CCF and the control (F), respectively. The color of the dot represents the size of the VIP value, *represents 0.01 < p < 0.05, **represents 0.001 < p < 0.01, and ***represents p < 0.001.
Figure 12
Figure 12
Correlation heat map between DEMs and the related microbe in different treatment groups. Based on the top 40 genera of bacteria: SMOF vs. the control (A), COF vs. the control (C), and CCF vs. the control (E); based on the top 40 genera of fungi: SMOF vs. the control (B), COF vs. the control (D), and CCF vs. the control (F). *Indicated a significant correlation at p < 0.05, **indicated a significant correlation at p < 0.01.

References

    1. Adams R. I., Miletto M., Taylor J. W., Bruns T. D. (2013). Dispersal in microbes: fungi in indoor air are dominated by outdoor air and show dispersal limitation at short distances. ISME J. 7, 1262–1273. 10.1038/ismej.2013.28 - DOI - PMC - PubMed
    1. Alhrout H. H., Akash M. W., Hejazin R. K. (2018). Effect of farm yard manure and NPK on the yield and some growth components of tomato (Lycopersicum esculentum). Res. Crops 19, 655–658. 10.31830/2348-7542.2018.0001.43 - DOI
    1. Altschul S. F., Madden T. L., Schäffer A. A., Zhang J., Zhang Z., Miller W., et al. . (1997). Gapped BLAST and PSI-BLAST: a new generation of protein database search programs. Nucleic Acids Res. 25, 3389–3402. 10.1093/nar/25.17.3389 - DOI - PMC - PubMed
    1. Amanullah I., Hidayatullah K., Jan A., Shah Z., Jamal Khan M., Parmar B., et al. . (2019). “Organic carbon sources and nitrogen management improve biomass of hybrid rice (Oryza sativa L.) under nitrogen deficient condition,” in Advances in Rice Research for Abiotic Stress Tolerance, eds M. Hasanuzzaman, M. Fujita, and K. Nahar (Amsterdam: Elsevier; ), 447–467. 10.1016/B978-0-12-814332-2.00022-8 - DOI
    1. Asaf S., Numan M., Khan A. L., AI-Harrasi A. (2020). Sphingomonas: from diversity and genomics to functional role in environmental remediation and plant growth. Crit. Rev. Biotechnol. 40, 138–152. 10.1080/07388551.2019.1709793 - DOI - PubMed