. 2023 May 25:17:1170401.
doi: 10.3389/fnins.2023.1170401. eCollection 2023.

The hemodynamic initial-dip consists of both volumetric and oxymetric changes reflecting localized spiking activity

Affiliations

The hemodynamic initial-dip consists of both volumetric and oxymetric changes reflecting localized spiking activity

Ali Danish Zaidi et al. Front Neurosci. .

Abstract

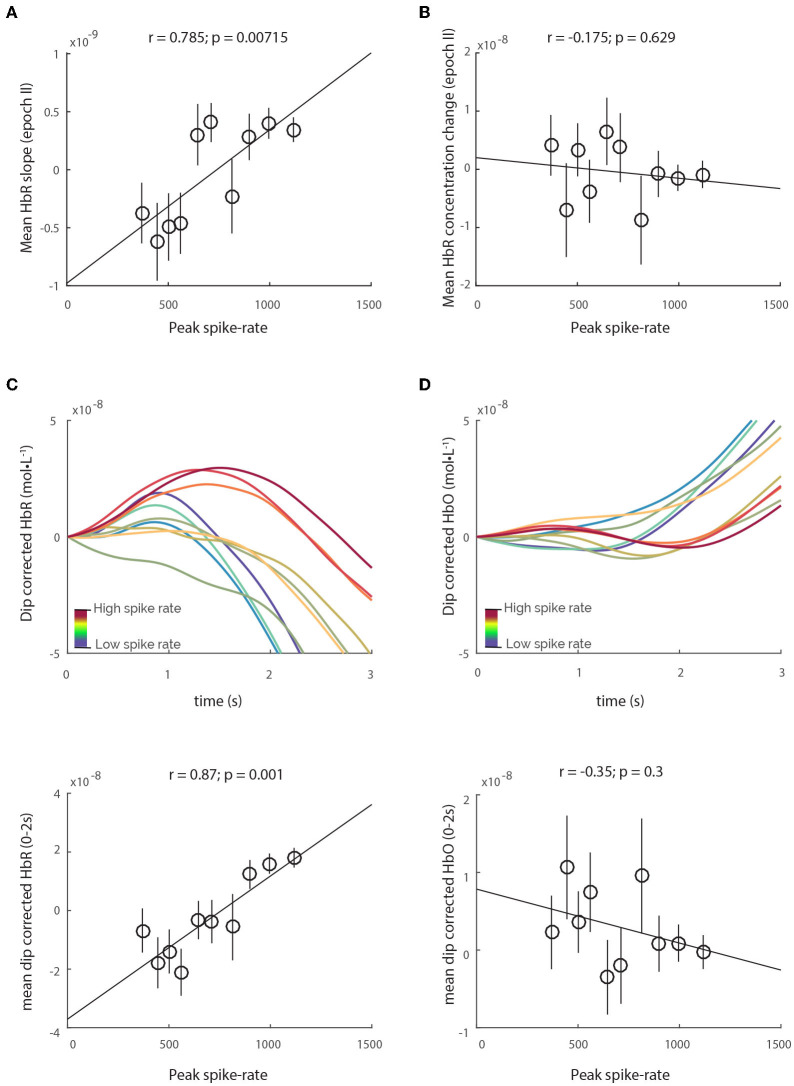
The initial-dip is a transient decrease frequently observed in functional neuroimaging signals, immediately after stimulus onset, believed to originate from a rise in deoxy-hemoglobin (HbR) caused by local neural activity. It has been shown to be more spatially specific than the hemodynamic response, and is believed to represent focal neuronal activity. However, despite being observed in various neuroimaging modalities (such as fMRI, fNIRS, etc), its origins are disputed, and its precise neuronal correlates are unknown. Here we show that the initial-dip is dominated by a decrease in total-hemoglobin (HbT). We also find a biphasic response in deoxy-Hb (HbR), with an early decrease and later rebound. Both the HbT-dip and HbR-rebound were strongly correlated to highly localized spiking activity. However, HbT decreases were always large enough to counter the spiking-induced increase in HbR. We find that the HbT-dip counters spiking induced HbR increases, imposing an upper-limit to HbR concentration in the capillaries. Building on our results, we explore the possibility of active venule dilation (purging) as a possible mechanism for the HbT dip.

Keywords: electrophysiology; functional neuroimaging; hemodynamics; initial dip reflects spiking activity; near infra-red spectroscopy; neurovascular coupling; primate; visual cortex.


Conflict of interest statement

The authors declare that the research was conducted in the absence of any commercial or financial relationships that could be construed as a potential conflict of interest.

Figures

Figure 1
Figure 1
Epidurally measured fNIRS measurements reveal initial dips in hemodynamic signals. (A) Illustration of the sensor array with placement of fNIRS optodes and electrodes relative to scalp and brain tissue. (B) Transverse section of the sensor array with distances between optodes and electrodes. See Section 2 for details. (C) Traces of HbO, HbR, and Spiking from an example run with 20 trials. Gray bars represent epochs of visual stimulation. Arrows mark trials where initial dips are obvious in signal trends. (D) The mean traces of HbO, HbR, HbT, and multi-unit spiking (units on the right) for trials shown in (C). (Inset) Same hemodynamic traces, but from 0 to 2.5 s. The initial dip is observed in the HbO and HbT (inset), but not in the HbR traces. The shaded region represents visual stimulus presentation. (E) Distribution of slopes from 0 to 1 s for HbO, HbR, and HbT traces for trials in (C). The distributions of HbO and HbT slopes are less than zero, but not for those for HbR (pHbO = 0.0187; pHbT < 10−4; pHbR = 0.099; n = 20; Š). (F) The mean traces of HbO, HbR, HbT, and multi-unit spiking activity (units on the right) for all trials. (Inset) Same hemodynamic traces, but from 0 to 2 s. (G) Distribution of signal slopes from 0 to 1s for HbO, HbR, and HbT traces for all trials. The distributions for HbO and HbT are less than zero, but not for HbR (pHbO < 10−7; pHbT < 10−10; pHbR > 0.1; n = 260). However, HbT dips were stronger than HbO dips (p = 0.014).
Figure 2
Figure 2
Trials with high spiking activity reveal initial dips comprise of an early HbT decrease, and late HbR increase. (A) Mean traces of spike-rates for trials with high and low spiking immediately after stimulus onset (thick and thin traces, respectively). (Inset) Same traces, but between 0 and 2 s. (B) Mean traces of hemodynamic signals for trials with low (thin) and high spiking as shown in (A). A clear increase in the dips is observed for high spiking trials with the largest dips elicited in HbT traces. (C) Average slopes from 0 to 1 s for HbO, HbR, and HbT traces for high (thick) and low (thin) spiking trials. HbO, HbR, and HbT all elicit significant dips in high-spiking trials (pHbO < 10−11; pHbT < 10−14; pHbR < 10−2; n = 128; Š), with larger dips in HbT than HbO (p < 0.005; n = 125; pairwise Ś). Interestingly, trials with low spiking trials do not elicit significant dips in either HbO, HbR, or HbT (p < 0.1; n = 122; Š). (D) Distribution of peak spike-rates and visual modulation of spike-rates for trials with high (thick) and low (thin) peak spike-rates. This illustrates that even though the peak rates were lower in the low-spiking trials, the overall spiking activity was significantly high, as was the visual stimulus induced modulation of spike rates (see Section 2 for calculation of modulation index). (E) Analysis of the slope of HbR traces in high spiking trials reveals a biphasic response, which is almost all but absent in low spiking trials. In high spiking trials (thick trace), an initial negative slope is observed roughly between 0 and 0.75 s (epoch I, shaded green), followed a positive slope roughly between 0.75 and 1.75 s (epoch II, shaded red). (F) For high spiking trials, the distribution of mean HbR slopes were significantly negative during epoch I (p < 10−3; n = 125; Ś), and significantly positive during epoch II (p < 10−3; n = 125; Š). In contrast, low spiking trials showed no significant modulation of HbR slopes during either epoch I or II (p > 0.1; n = 122; Š). (G) Correlation of mean dips in HbT, HbO, and HbR stimulus induced peaks in the power of various LFP frequencies bands and Spiking. Correlations with p > 0.05 are grayed. Only high frequency bands showed a significant correlation with initial dips, with spiking activity eliciting the strongest relationship, that were marginally higher for HbT than HbO. (H) Strength of the relationship between the HbT dip and spiking activity decreases with distance from the NIRS emitter. Strongest correlations are observed on tetrode closest to emitter (0.55 mm away from emitter edge, 1.8 mm from emitter center), whereas no correlations are observed on tetrode 2.95 mm away (4.2 mm from center).
Figure 3
Figure 3
Analysis of spontaneous activity in the absence of visual stimulation reveals identical relationships. (A) Traces of HbO, HbR, HbT, and spike-rates from an example run of 900 s. Periods of high spiking activity that elicit an observable dip in HbO and HbT are marked with arrows and gray bars. (B) We used system identification to estimate the impulse response functions from spiking to HbO, HbR, and HbT signals in recordings of spontaneous activity. The mean impulse response reveals a dip in HbO and HbT (mean of 48 impulse response functions obtained from 16 runs lasting 900 s each; see Section 2 for details). (C) Rate of change of the impulse response functions for HbO, HbR, and HbT reveals dips in both HbO and HbT, and a late rise in the HbR. (Inset) Same traces but between 0 and 3 s. (D) Distribution of slopes for HbO, HbR, and HbT at t = 1 s. Only HbO and HbT have significant dips, but not HbR (Š; n = 48). (E) The runs were divided based on the total sum of spikes in each run, and separated into low spiking and high spiking runs. High spiking runs had significantly higher spike sums (Ś; n = 8). (F) The mean impulse responses for high and low spiking runs reveal stronger modulation of hemodynamic signals on high spiking trials. Color-code same in following figures. (G) Mean traces of slopes of impulse responses shown in (F). High spiking trials elicit an obvious dip at t = 1 s. (Inset) Same traces but from 0 to 3 s. (H) Distribution of dips for low and high spiking trials (legend same as F). Only high spiking trials have significant dips in all three signals. Also, HbT dips were larger than HbO dips (Ś; n = 80). (I) When comparing the HbR dip and rebound at t = 1 s and t = 2 s, resp., only high spiking trials reveal a strong dip and rebound in the HbR signal.
Figure 4
Figure 4
HbR-rebound does not lead to increase in HbR concentration. Although there is a correlation between spiking and the mean HbR slope in epoch II (A), the relative HbR concentration change remains unchanged with spiking (B). (C) Dip-corrected HbR traces, obtained by simply subtracting the HbT traces from HbR reveals obvious increases in HbR concentration that correlate with spiking. However, no such relationship is observed with dip-corrected HbO traces (D).

Similar articles

Cited by

References

    1. Buxton R. (2012). Dynamic models of bold contrast. Neuroimage 62, 953–961. 10.1016/j.neuroimage.2012.01.012 - DOI - PMC - PubMed
    1. Buxton R. B. (2001). The elusive initial dip. Neuroimage 13(6 Pt 1), 953–958. 10.1006/nimg.2001.0814 - DOI - PubMed
    1. Cui X., Bray S., Bryant D. M., Glover G. H., Reiss A. L. (2011). A quantitative comparison of NIRS and fMRI across multiple cognitive tasks. Neuroimage 54, 2808–2821. 10.1016/j.neuroimage.2010.10.069 - DOI - PMC - PubMed
    1. Devor A., Sakadzic S., Saisan P., Yaseen M., Roussakis E., Srinivasan V., et al. . (2011). “Overshoot” of o2 is required to maintain baseline tissue oxygenation at locations distal to blood vessels. J. Neurosci. 31, 13676–13681. 10.1523/JNEUROSCI.1968-11.2011 - DOI - PMC - PubMed
    1. Drew P. J., Shih A. Y., Kleinfeld D. (2011). Fluctuating and sensory-induced vasodynamics in rodent cortex extend arteriole capacity. Proc. Natl. Acad. Sci. U.S.A. 108, 8473–8478. 10.1073/pnas.1100428108 - DOI - PMC - PubMed

LinkOut - more resources