Review
. 2023 Dec;28(12):121205.
doi: 10.1117/1.JBO.28.12.121205. Epub 2023 Jun 8.

Photoacoustic imaging on its way toward clinical utility: a tutorial review focusing on practical application in medicine

Affiliations
Review

Photoacoustic imaging on its way toward clinical utility: a tutorial review focusing on practical application in medicine

Jonas J M Riksen et al. J Biomed Opt. 2023 Dec.

Abstract

Significance: Photoacoustic imaging (PAI) enables the visualization of optical contrast with ultrasonic imaging. It is a field of intense research, with great promise for clinical application. Understanding the principles of PAI is important for engineering research and image interpretation.

Aim: In this tutorial review, we lay out the imaging physics, instrumentation requirements, standardization, and some practical examples for (junior) researchers, who have an interest in developing PAI systems and applications for clinical translation or applying PAI in clinical research.

Approach: We discuss PAI principles and implementation in a shared context, emphasizing technical solutions that are amenable to broad clinical deployment, considering factors such as robustness, mobility, and cost in addition to image quality and quantification.

Results: Photoacoustics, capitalizing on endogenous contrast or administered contrast agents that are approved for human use, yields highly informative images in clinical settings, which can support diagnosis and interventions in the future.

Conclusion: PAI offers unique image contrast that has been demonstrated in a broad set of clinical scenarios. The transition of PAI from a "nice-to-have" to a "need-to-have" modality will require dedicated clinical studies that evaluate therapeutic decision-making based on PAI and consideration of the actual value for patients and clinicians, compared with the associated cost.

Keywords: clinical translation; photoacoustic imaging; quantitative imaging; systems engineering.


Figures

Fig. 1
Fig. 1
Principle of PAI. (1) Light emitted from a source illuminating the volume of interest propagates through the tissue, which is generally turbid. (2) Scattering distributes the light through the tissue but also attenuates it as it reaches greater depths. (3) Chromophores absorb light. (4) The absorbed optical energy thermalizes and causes a transient elastic response that generates a local pressure rise. (5) The pressure change sets off an acoustic wave that propagates through the tissue, and can be (6) detected by an ultrasound probe. If an ultrasound array is used, an image of the absorbed optical energy can be reconstructed (7) by dedicated algorithms, analyzing the acoustic delays of the signals received by the individual array elements. Modified from Ref.  with permission of the author.
Fig. 2
Fig. 2
PA spectra in terms of absorption coefficient of endogenous chromophores: melanin, oxygenated (HbO2) and non-oxygenated (Hb) hemoglobin at the concentration of 150 g/l, collagen, lipid (the regions depicted with a solid and a dashed line are from Refs.  and respectively), and water. All spectra except collagen and lipid (dashed line) are available from Ref. .
Fig. 3
Fig. 3
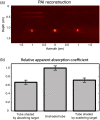
(a) Image of three identical India ink filled capillary tubes, illuminated from above. The tubes are shielded by an absorbing layer (left), which is visible as two boundaries in the image; unshielded (middle); and shielded by a scattering layer (right), which is invisible in the image. (b) The apparent absorption coefficient varies as a result of changes in fluence; note that scattering and absorption have similar attenuating effects. Reproduced from Ref.  with permission.
Fig. 4
Fig. 4
(a) Time- and (b) frequency domain solutions for Eq. (14) for spherical absorbers with diameters of 500, 200, and 100  μm.
Fig. 5
Fig. 5
Principle of DAS algorithm. (a) The initial pressure distribution p0. (b) The pressure traces p received by the ultrasound transducer elements located at x. (c), (d) To reconstruct the initial pressure distribution at points x1,z1 depicted with green and x2,z2 depicted with blue, a different set of delays τ is to be applied. (e) The delayed traces at each channel are added together to form the beamformed signal. (f) Finally, the beamformed signal is enveloped and log compressed for displaying.
Fig. 6
Fig. 6
Molar extinction coefficient of oxygenated hemoglobin (HbO2) and non-oxygenated hemoglobin (Hb). The data are available from Ref. .
Fig. 7
Fig. 7
Simulated photoacoustic tomographic images of (a) a nine-ring phantom with different transducers, (b) linear with 256 elements, (c) curved with 256 elements, (d) cylindrical with 512 elements, and (e) cylindrical with 64 elements. The transducers are depicted with bold black lines. The reconstructions were performed using time reversal reconstruction. The figure demonstrates imaging artifacts appearing in different configurations such as (b) limited view artifact, (c) comet tail, and (e) sidelobe artifact.
Fig. 8
Fig. 8
Boundary build-up effect demonstrated on a simulated pressure wave emitted by a cylindrical absorber of ø 1 mm. (a) The pressure wave was received by an (a) infinite, (b) low, and (c) high frequency ultrasound linear transducer. (d) Received pressure at the middle transducer element (x=0), (g) frequency spectrum, and (j) beamformed signal for the infinite frequency band ultrasound transducer. (e) Received pressure at the middle element, (h) frequency spectrum, and (k) beamformed signal for the low frequency band ultrasound transducer. (f) Received pressure at the middle element, (i) frequency spectrum, and (l) beamformed signal for the high frequency band ultrasound transducer. In (l), only the boundary of a large source can be visualized. The intensity of the received signal in (f) is substantially lower than in (d) and (e).
Fig. 9
Fig. 9
Mechanisms producing image clutter, illustrated in a dual-sided illumination geometry. Dashed lines indicate the borders of the image plane, which is perpendicular to the page. (a) Light absorption in the transducer surface generates a strong signal at the moment of laser pulse emission (t=0), and an acoustic wave that can be reflected by a scattering object at xe=(0,ze). (b) Superficial absorbers located at xa, outside the transducer field of view but within the illuminated area may receive a high fluence and emit a strong PA signal, which can reach the probe directly, and can be reflected off a scattering object at xe in the image plane. (c) PA signals generated by an absorbing target in the imaging plane may be reflected by ultrasound scatterers.
Fig. 10
Fig. 10
Illumination geometries. (a) Illumination from both sides of a linear array probe, producing two overlapping volumes of diffuse illumination (image is perpendicular to the page). (b) Single-sided illumination. (c) Illumination through a standoff that is both optically and acoustically transparent. (d) Illumination through a transparent transducer (image plane is parallel to the page). (e) “Transmission” geometry: light is delivered from the distal side of the anatomy under study. (f) Interstitial illumination using a fiber probe in a needle or catheter. Dashed lines indicate the approximate field of view.
Fig. 11
Fig. 11
Molar extinction coefficient of methylene blue and ICG in different solvents at different concentrations. Molar extinction coefficient (C) of oxygenated hemoglobin (HbO2) and non-oxygenated hemoglobin (Hb). Spectra are available from Ref. .
Fig. 12
Fig. 12
MPE as a function of wavelength for nanosecond pulses (blue line, left axis) and pulse trains (duration >10  s; black dashed line; right axis). Note the vertical scale is logarithmic.
Fig. 13
Fig. 13
Reference images for lesions demonstrating the minimum and maximum PA feature scores. Adapted with permission from Ref. .
Fig. 14
Fig. 14
Imaging of muscle collagen as a biomarker for DMD. Top: Ultrasound echography in a healthy volunteer (left) and an individual with DMD (right). Bottom: Multispectral photoacoustic data unmixed for hemoglobin, collagen, and lipid, showing markedly higher collagen content and lipid heterogeneity as markers of DMD. Adapted from Ref.  and available under a CC-BY 4.0 license.
Fig. 15
Fig. 15
Cross-sectional IVPA images overlaid on IVUS images from a human coronary artery. (a) Imaged coronary artery fixed inside a holder. (b) 3D reconstruction of merged IVPA/IVUS pullback (PB) images. (c) and (e) IVPA images overlaid on IVUS at different locations with a dynamic range of 20 and 35 dB, respectively. (d) and (f) Histology at the corresponding image planes from (c) and (e), stained for lipids with Oil Red O (ORO). Reused with permission from Ref. .
Fig. 16
Fig. 16
(a) A 1 mm-core-diameter optical fiber was inserted with its tip coincident with the distal tip of a 5F inner diameter, 7F outer diameter cardiac catheter. (b) Ultrasound image and (c) PA image overlaid on the corresponding ultrasound image, each showing the catheter tip in contact with the right ventricular outflow tract. The ultrasound and PA images were acquired with a subcostal acoustic window and provided depth information that is not present in the fluoroscopic images. The catheter tip location and its contact with the endocardium are more apparent in the PA image when compared to the ultrasound image. Adapted from Ref. , available under a CC-BY 4.0 license.
Fig. 17
Fig. 17
PA images of lymphatic vessels and veins overlaid on ultrasound (US) images. (a) NIRF-L image of a dorsal forearm, showing extensive dermal backflow that limits the visibility of linear lymphatic vessels. (b) and (c) Corresponding PA images overlaid on ultrasound in an axial and parallel position of the probe, red and white arrows indicate the veins and lymphatic vessels. Adapted from Ref. , available under a CC-BY 4.0 license.

Similar articles

Cited by

References

    1. Duck F. A., Physical Properties of Tissues: A Comprehensive Reference Book, Elsevier Science & Technology, Jordan Hill, United Kingdom: (1990).
    1. Abou-Elkacem L., Bachawal S. V., Willmann J. K., “Ultrasound molecular imaging: moving toward clinical translation,” Eur. J. Radiol. 84(9), 1685–1693 (2015).EJRADR10.1016/j.ejrad.2015.03.016 - DOI - PMC - PubMed
    1. Petrova I. Y., et al. , “Optoacoustic monitoring of blood hemoglobin concentration: a pilot clinical study,” Opt. Lett. 30(13), 1677–1679 (2005).OPLEDP10.1364/OL.30.001677 - DOI - PubMed
    1. Laufer J., et al. , “Quantitative spatially resolved measurement of tissue chromophore concentrations using photoacoustic spectroscopy: application to the measurement of blood oxygenation and haemoglobin concentration,” Phys. Med. Biol. 52(1), 141–168 (2007).PHMBA710.1088/0031-9155/52/1/010 - DOI - PubMed
    1. Yao J., et al. , “Label-free oxygen-metabolic photoacoustic microscopy in vivo,” J. Biomed. Opt. 16(7), 076003 (2011).JBOPFO10.1117/1.3594786 - DOI - PMC - PubMed

Publication types