

Prediction of prognosis and immunotherapy response in breast cancer based on neutrophil extracellular traps-related classification
- PMID: 37304069
- PMCID: PMC10250592
- DOI: 10.3389/fmolb.2023.1165776
Prediction of prognosis and immunotherapy response in breast cancer based on neutrophil extracellular traps-related classification
Abstract
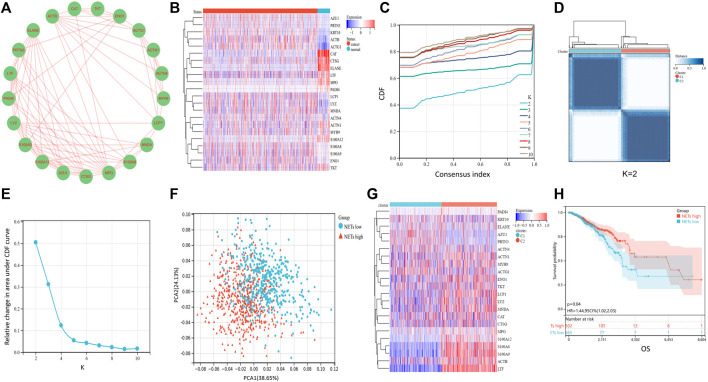
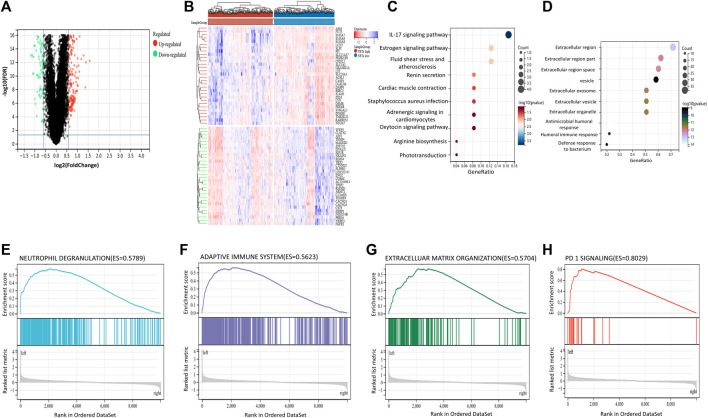
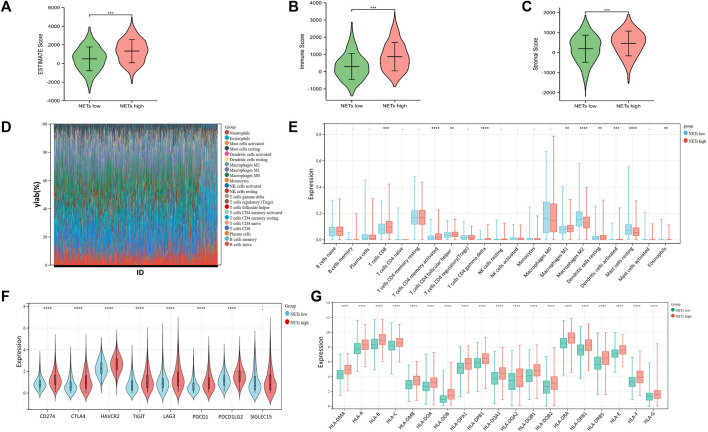
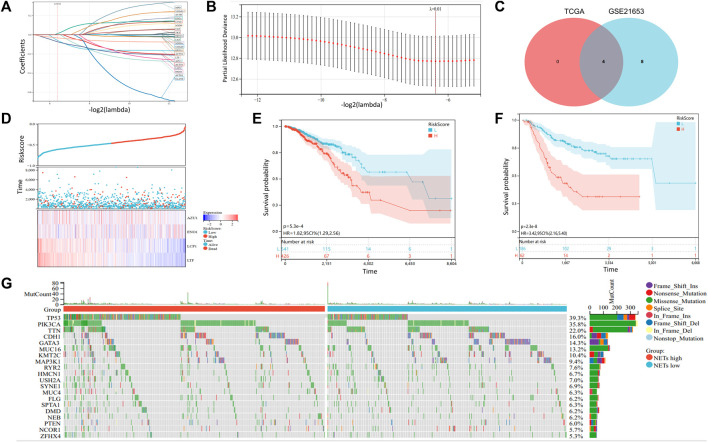
Neutrophil extracellular traps (NETs), a network of DNA histone complexes and proteins released by activated neutrophils, have been demonstrated to be associated with inflammation, infection related immune response and tumorigenesis in previous reports. However, the relationship between NETs related genes and breast cancer remains controversial. In the study, we retrieved transcriptome data and clinical information of BRCA patients from The Cancer Genome Atlas (TCGA) database and Gene Expression Omnibus (GEO) datasets. The expression matrix of neutrophil extracellular traps (NETs) related genes was generated and consensus clustering was performed by Partitioning Around Medoid (PAM) to classify BRCA patients into two subgroups (NETs high group and NETs low group). Subsequently, we focus on the differentially expressed genes (DEGs) between the two NETs-related subgroups and further explored NETs enrichment related signaling pathways by Gene Ontology (GO) and Kyoto Encyclopedia of Genes and Genomes (KEGG) analysis. In addition, we constructed a risk signature model by LASSO Cox regression analysis to evaluate the association between riskscore and prognosis. Even more, we explored the landscape of the tumor immune microenvironment and the expression of immune checkpoints related genes as well as HLA genes between two NETs subtypes in breast cancer patients. Moreover, we found and validated the correlation of different immune cells with risk score, as well as the response to immunotherapy in different subgroups of patients was detected by Tumor Immune Dysfunction and Exclusion (TIDE) database. Ultimately, a nomogram prognostic prediction model was established to speculate on the prognosis of breast cancer patients. The results suggest that high riskscore is associated with poor immunotherapy response and adverse clinical outcomes in breast cancer patients. In conclusion, we established a NETs-related stratification system that is beneficial for guiding the clinical treatment and predicting prognosis of BRCA.
Keywords: breast cancer; clustering; immunotherapy response; neutrophil extracellular traps; prognosis.
Copyright © 2023 Zhao and Xie.
Conflict of interest statement
The authors declare that the research was conducted in the absence of any commercial or financial relationships that could be construed as a potential conflict of interest.
Figures
Similar articles
-
A neutrophil extracellular traps-related classification predicts prognosis and response to immunotherapy in colon cancer.Sci Rep. 2023 Nov 7;13(1):19297. doi: 10.1038/s41598-023-45558-6. Sci Rep. 2023. PMID: 37935721 Free PMC article.
-
A Neutrophil Extracellular Traps-Related Signature Predicts Clinical Outcomes and Identifies Immune Landscape in Ovarian Cancer.J Cell Mol Med. 2024 Dec;28(24):e70302. doi: 10.1111/jcmm.70302. J Cell Mol Med. 2024. PMID: 39730971 Free PMC article.
-
Identification of novel neutrophil-extracellular-traps-related genes as biomarkers for breast cancer prognosis and immunotherapy.Transl Cancer Res. 2025 Mar 30;14(3):1737-1752. doi: 10.21037/tcr-24-1826. Epub 2025 Mar 27. Transl Cancer Res. 2025. PMID: 40224973 Free PMC article.
-
Neutrophil extracellular traps-associated modification patterns depict the tumor microenvironment, precision immunotherapy, and prognosis of clear cell renal cell carcinoma.Front Oncol. 2022 Dec 22;12:1094248. doi: 10.3389/fonc.2022.1094248. eCollection 2022. Front Oncol. 2022. PMID: 36620592 Free PMC article.
-
A Novel Neutrophil Extracellular Traps Signature for Overall Survival Prediction and Tumor Microenvironment Identification in Gastric Cancer.J Inflamm Res. 2023 Aug 14;16:3419-3436. doi: 10.2147/JIR.S417182. eCollection 2023. J Inflamm Res. 2023. PMID: 37600223 Free PMC article.
Cited by
-
NET-related gene signature for predicting AML prognosis.Sci Rep. 2024 Apr 20;14(1):9115. doi: 10.1038/s41598-024-59464-y. Sci Rep. 2024. PMID: 38643300 Free PMC article.
-
Risk score constructed with neutrophil extracellular traps-related genes predicts prognosis and immune microenvironment in multiple myeloma.Front Oncol. 2024 Jun 11;14:1365460. doi: 10.3389/fonc.2024.1365460. eCollection 2024. Front Oncol. 2024. PMID: 38919521 Free PMC article.
-
Neutrophil Extracellular Traps Enhance Procoagulant Activity and Predict Poor Prognosis in Patients With Metastatic Breast Cancer.Int J Gen Med. 2025 Mar 4;18:1247-1259. doi: 10.2147/IJGM.S511024. eCollection 2025. Int J Gen Med. 2025. PMID: 40062357 Free PMC article.
-
Neutrophil extracellular traps in diseases of the female reproductive organs.Front Immunol. 2025 May 5;16:1589329. doi: 10.3389/fimmu.2025.1589329. eCollection 2025. Front Immunol. 2025. PMID: 40391215 Free PMC article. Review.
-
The Predictive Value of Neutrophil Extracellular Trap-Related Risk Score in Prognosis and Immune Microenvironment of Colorectal Cancer Patients.Mol Biotechnol. 2025 Apr;67(4):1509-1525. doi: 10.1007/s12033-024-01135-4. Epub 2024 Apr 5. Mol Biotechnol. 2025. PMID: 38580851
References
LinkOut - more resources
Full Text Sources
Research Materials
Miscellaneous