Gut dysbiosis following organophosphate, diisopropylfluorophosphate (DFP), intoxication and saracatinib oral administration
- PMID: 37304619
- PMCID: PMC10256240
- DOI: 10.3389/frmbi.2022.1006078
Gut dysbiosis following organophosphate, diisopropylfluorophosphate (DFP), intoxication and saracatinib oral administration
Abstract
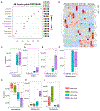
Organophosphate nerve agents (OPNAs) act as irreversible inhibitors of acetylcholinesterase and can lead to cholinergic crisis including salivation, lacrimation, urination, defecation, gastrointestinal distress, respiratory distress, and seizures. Although the OPNAs have been studied in the past few decades, little is known about the impact on the gut microbiome which has become of increasing interest across fields. In this study, we challenged animals with the OPNA, diisopropylfluorophosphate (DFP, 4mg/kg, s.c.) followed immediately by 2mg/kg atropine sulfate (i.m.) and 25mg/kg 2-pralidoxime (i.m.) and 30 minutes later by 3mg/kg midazolam (i.m.). One hour after midazolam, animals were treated with a dosing regimen of saracatinib (SAR, 20mg/kg, oral), a src family kinase inhibitor, to mitigate DFP-induced neurotoxicity. We collected fecal samples 48 hours, 7 days, and 5 weeks post DFP intoxication. 16S rRNA genes (V4) were amplified to identify the bacterial composition. At 48 hours, a significant increase in the abundance of Proteobacteria and decrease in the abundance of Firmicutes were observed in DFP treated animals. At 7 days there was a significant reduction in Firmicutes and Actinobacteria, but a significant increase in Bacteroidetes in the DFP groups compared to controls. The taxonomic changes at 5 weeks were negligible. There was no impact of SAR administration on microbial composition. There was a significant DFP-induced reduction in alpha diversity at 48 hours but not at 7 days and 5 weeks. There appeared to be an impact of DFP on beta diversity at 48 hours and 7 days but not at 5 weeks. In conclusion, acute doses of DFP lead to short-term gut dysbiosis and SAR had no effect. Understanding the role of gut dysbiosis in long-term toxicity may reveal therapeutic targets.
Keywords: diisopropylfluorophosphate (DFP); gut microbiome; orally administered drugs; organophosphate nerve agent; saracatinib.
Conflict of interest statement
Conflict of interest The authors declare that the research was conducted in the absence of any commercial or financial relationships that could be construed as a potential conflict of interest.
Figures


Similar articles
-
Saracatinib, a Src Tyrosine Kinase Inhibitor, as a Disease Modifier in the Rat DFP Model: Sex Differences, Neurobehavior, Gliosis, Neurodegeneration, and Nitro-Oxidative Stress.Antioxidants (Basel). 2021 Dec 28;11(1):61. doi: 10.3390/antiox11010061. Antioxidants (Basel). 2021. PMID: 35052568 Free PMC article.
-
Persistent behavior deficits, neuroinflammation, and oxidative stress in a rat model of acute organophosphate intoxication.Neurobiol Dis. 2020 Jan;133:104431. doi: 10.1016/j.nbd.2019.03.019. Epub 2019 Mar 21. Neurobiol Dis. 2020. PMID: 30905768 Free PMC article. Review.
-
Differential Impact of Severity and Duration of Status Epilepticus, Medical Countermeasures, and a Disease-Modifier, Saracatinib, on Brain Regions in the Rat Diisopropylfluorophosphate Model.Front Cell Neurosci. 2021 Oct 15;15:772868. doi: 10.3389/fncel.2021.772868. eCollection 2021. Front Cell Neurosci. 2021. PMID: 34720886 Free PMC article.
-
Sex-specific acute and chronic neurotoxicity of acute diisopropylfluorophosphate (DFP)-intoxication in juvenile Sprague-Dawley rats.Curr Res Toxicol. 2021 Sep 14;2:341-356. doi: 10.1016/j.crtox.2021.09.002. eCollection 2021. Curr Res Toxicol. 2021. PMID: 34622217 Free PMC article.
-
Pretreatment with pyridostigmine bromide has no effect on seizure behavior or 24 hour survival in the rat model of acute diisopropylfluorophosphate intoxication.Neurotoxicology. 2019 Jul;73:81-84. doi: 10.1016/j.neuro.2019.03.001. Epub 2019 Mar 7. Neurotoxicology. 2019. PMID: 30853371 Free PMC article.
Cited by
-
Exploring the benefits of in-diet versus repeated oral dosing of saracatinib (AZD0530) in chronic studies: insights into pharmacokinetics and animal welfare.Front Vet Sci. 2023 Nov 9;10:1297221. doi: 10.3389/fvets.2023.1297221. eCollection 2023. Front Vet Sci. 2023. PMID: 38026620 Free PMC article.
-
Proinflammatory cytokines, oxidative stress, and organ function as biomarkers of soman (GD) chronic neurotoxicity.Sci Rep. 2025 Mar 15;15(1):9021. doi: 10.1038/s41598-025-94190-z. Sci Rep. 2025. PMID: 40089647 Free PMC article.
-
Peripheral and central effects of NADPH oxidase inhibitor, mitoapocynin, in a rat model of diisopropylfluorophosphate (DFP) toxicity.Front Cell Neurosci. 2023 Jun 21;17:1195843. doi: 10.3389/fncel.2023.1195843. eCollection 2023. Front Cell Neurosci. 2023. PMID: 37416507 Free PMC article.
-
Diet-incorporated saracatinib, a Src tyrosine kinase inhibitor, counteracts diisopropylfluorophosphate (DFP)-induced chronic neurotoxicity in the rat model.Biomed Pharmacother. 2025 Aug;189:118234. doi: 10.1016/j.biopha.2025.118234. Epub 2025 Jun 12. Biomed Pharmacother. 2025. PMID: 40513390 Free PMC article.
References
Grants and funding
LinkOut - more resources
Full Text Sources
Miscellaneous
