. 2023 Apr 12;5(3):fcad122.
doi: 10.1093/braincomms/fcad122. eCollection 2023.

Neural dysregulation in post-COVID fatigue

Affiliations

Neural dysregulation in post-COVID fatigue

Anne M E Baker et al. Brain Commun. .

Abstract

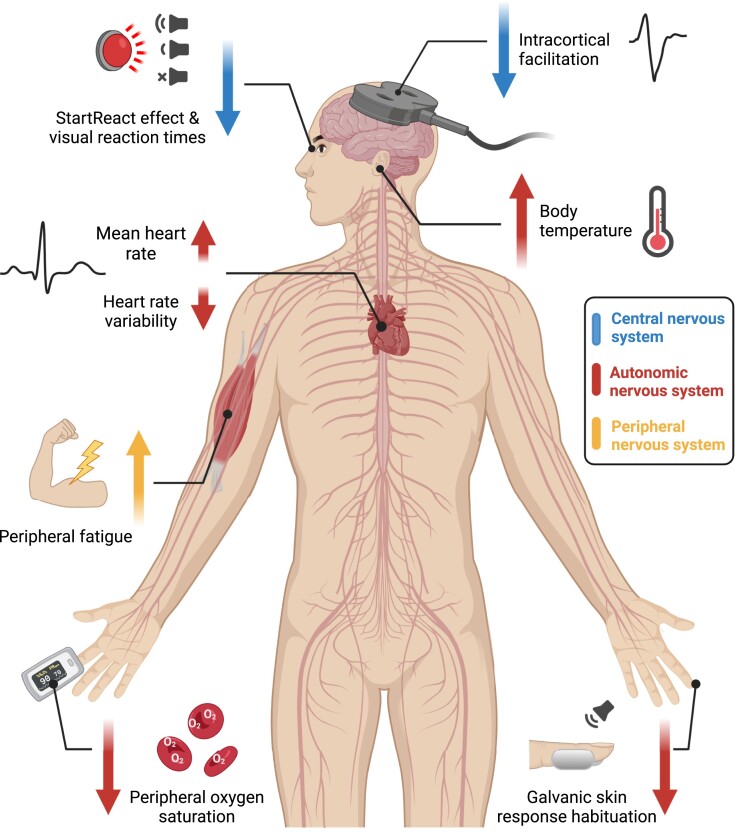
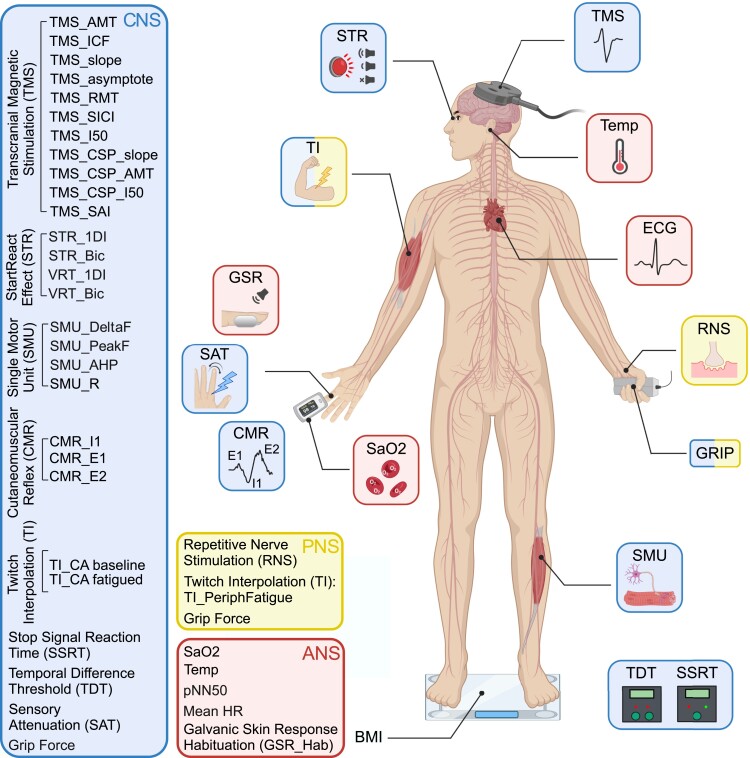
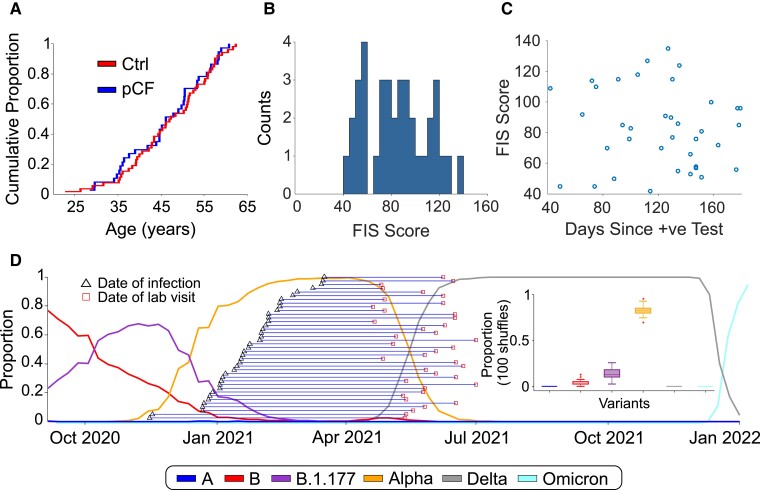
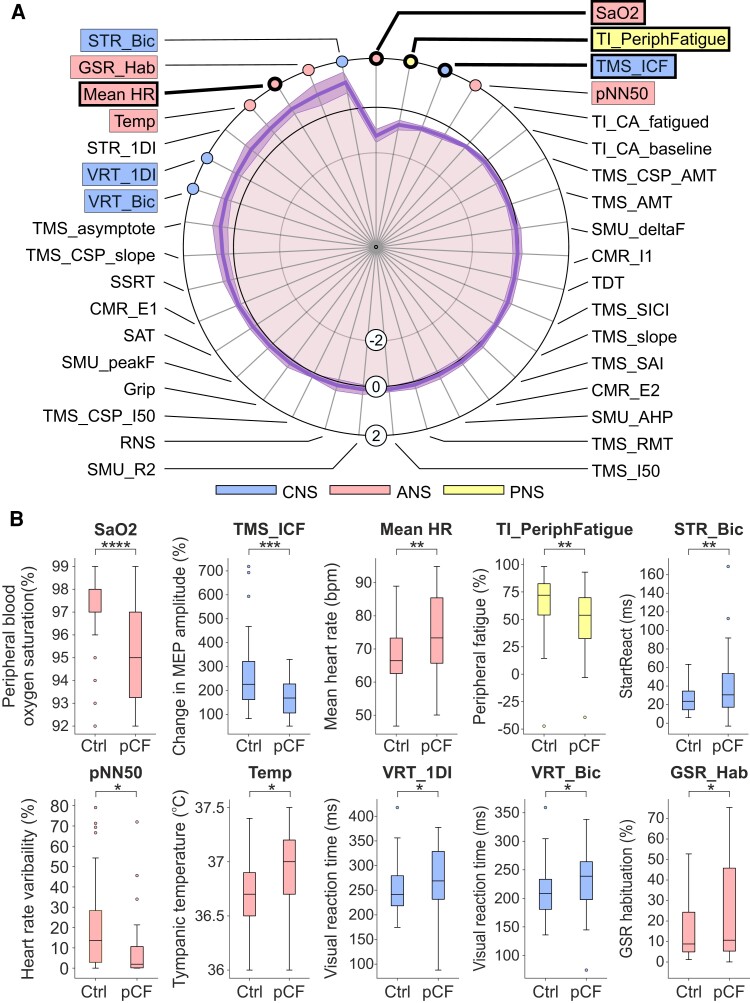
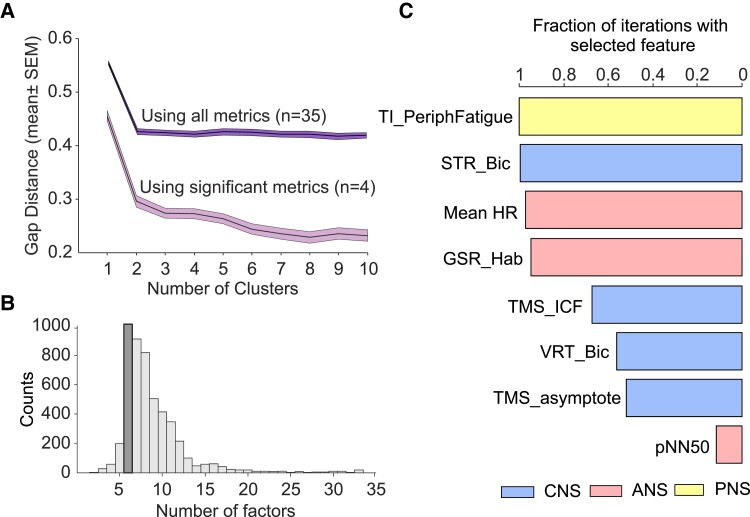
Following infection with SARS-CoV-2, a substantial minority of people develop lingering after-effects known as 'long COVID'. Fatigue is a common complaint with a substantial impact on daily life, but the neural mechanisms behind post-COVID fatigue remain unclear. We recruited 37 volunteers with self-reported fatigue after a mild COVID infection and carried out a battery of behavioural and neurophysiological tests assessing the central, peripheral and autonomic nervous systems. In comparison with age- and sex-matched volunteers without fatigue (n = 52), we show underactivity in specific cortical circuits, dysregulation of autonomic function and myopathic change in skeletal muscle. Cluster analysis revealed no subgroupings, suggesting post-COVID fatigue is a single entity with individual variation, rather than a small number of distinct syndromes. Based on our analysis, we were also able to exclude dysregulation in sensory feedback circuits and descending neuromodulatory control. These abnormalities on objective tests may aid in the development of novel approaches for disease monitoring.

Keywords: COVID; dysautonomia; fatigue; myopathy; transcranial magnetic brain stimulation.


Conflict of interest statement

The authors report no competing interests.

Figures

Graphical abstract
Graphical abstract
Figure 1
Figure 1
Neurophysiological tests performed. Schematic representation of the different tests performed, separated according to which components of the CNS, PNS and ANS they assessed. BMI, body mass index; CMR, cutaneomuscular reflex; GSR, habituation of the galvanic skin response to loud sound; ECG, electrocardiogram; RNS, repetitive nerve stimulation; SAT, sensory attenuation with movement; SMU, single motor unit recording; SSRT, stop signal reaction time; STR, StartReact effect; TDT, temporal difference threshold; TI, twitch interpolation; TMS, transcranial magnetic stimulation. Created with biorender.com.
Figure 2
Figure 2
Cohort demographics. (A) Cumulative age distribution plots for pCF and control subjects. (B) Distribution histogram of FIS scores reported by pCF subjects. (C) Lack of correlation of FIS score with time since SARS-CoV-2 infection (Pearson r2 = 0.009, P = 0.59, t-test). (D) Proportions of the most common SARS-CoV-2 variants in circulation in England since October 2020 and the estimated expected proportion of each variant across our cohort (based on 100 shuffles).
Figure 3
Figure 3
Differences between pCF and control cohorts. (A) Results from the tests outlined in Fig. 1, normalized as Z-scores (difference between pCF and control subjects, scaled by SD). Measures highlighted within boxes were individually significantly different between pCF and controls (P < 0.05); for those with thicker lines, significance passed the Benjamini–Hochberg correction for multiple comparisons. (B) Distribution of the 10 measures which had uncorrected P < 0.05 as box-and-whisker plots across the two cohorts. *P < 0.05, **P < 0.01, ***P < 0.001, ****P < 0.0001.
Figure 4
Figure 4
Clustering and machine-learning analysis. (A) Gap analysis of number of clusters in the multivariate data set from pCF subjects. This is the result of 100 iterations. (B) Number of factors chosen by a machine-learning algorithm to maximize classification of pCF versus control subjects during 5000 iterations. (C) Fraction of iterations (n = 5000) of classification algorithm, with feature number fixed to 6, which included different features. Plot has been truncated to show the most common eight features.

References

    1. Blomberg B, Mohn KG, Brokstad KA, et al. . Long COVID in a prospective cohort of home-isolated patients. Nat Med. 2021;27(9):1607–1613. - PMC - PubMed
    1. McCrone P, Darbishire L, Ridsdale L, Seed P. The economic cost of chronic fatigue and chronic fatigue syndrome in UK primary care. Psychol Med. 2003;33(2):253–261. - PubMed
    1. Collin SM, Crawley E, May MT, Sterne JA, Hollingworth W, UK CFS/ME National Outcomes Database . The impact of CFS/ME on employment and productivity in the UK: A cross-sectional study based on the CFS/ME national outcomes database. BMC Health Serv Res. 2011;11:217. - PMC - PubMed
    1. Cullinan J, Ni Chomhrai O, Kindlon T, Black L, Casey B. Understanding the economic impact of myalgic encephalomyelitis/chronic fatigue syndrome in Ireland: A qualitative study. HRB Open Res. 2020;3:88. - PMC - PubMed
    1. Office for National Statistics . Prevalence of ongoing symptoms following coronavirus (COVID-19) infection in the UK. 2022.https://www.ons.gov.uk/peoplepopulationandcommunity/healthandsocialcare/... [Accessed 6.1.2022]

LinkOut - more resources