. 2023 Mar 9;7(4):100065.
doi: 10.1016/j.cdnut.2023.100065. eCollection 2023 Apr.

Body Metrics and the Gut Microbiome in Response to Macronutrient Limitation in the Zebrafish Danio rerio

Affiliations

Body Metrics and the Gut Microbiome in Response to Macronutrient Limitation in the Zebrafish Danio rerio

George B H Green et al. Curr Dev Nutr. .

Abstract

Background: Healthy and predictable physiologic homeostasis is paramount in animal models for biomedical research. Proper macronutrient intake is an essential and controllable environmental factor for maintaining animal health and promoting experimental reproducibility.

Objective and methods: Evaluate reductions in dietary macronutrient composition on body weight metrics, composition, and gut microbiome in Danio rerio.

Methods: D. rerio were fed reference diets deficient in either protein or lipid content for 14 weeks.

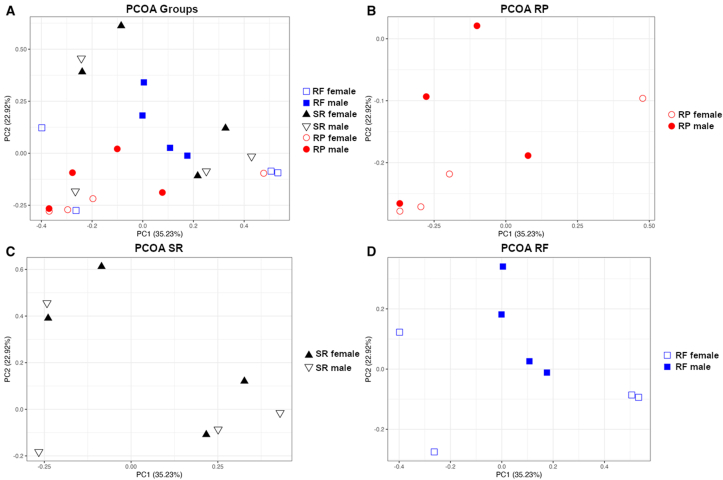
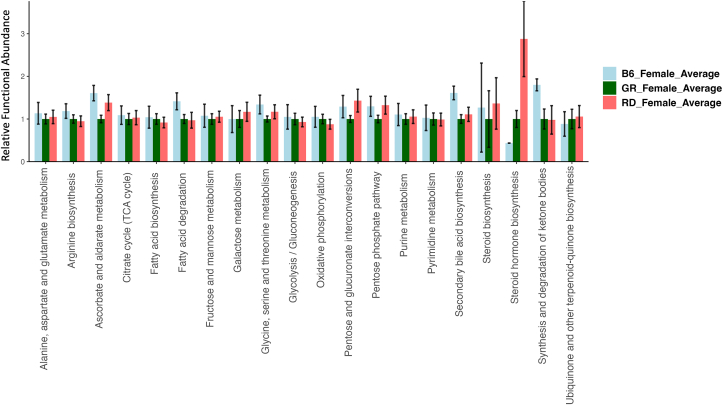
Results: Diets of reduced-protein or reduced-fat resulted in lower weight gain than the standard reference diet in male and female D. rerio. Females fed the reduced-protein diet had increased total body lipid, suggesting increased adiposity compared with females fed the standard reference diet. In contrast, females fed the reduced-fat diet had decreased total body lipid compared with females fed the standard reference diet. The microbial community in male and female D. rerio fed the standard reference diet displayed high abundances of Aeromonas, Rhodobacteraceae, and Vibrio. In contrast, Vibrio spp. were dominant in male and female D. rerio fed a reduced-protein diet, whereas Pseudomonas displayed heightened abundance when fed the reduced-fat diet. Predicted functional metagenomics of microbial communities (PICRUSt2) revealed a 3- to 4-fold increase in the KEGG (Kyoto Encyclopedia of Genes and Genomes) functional category of steroid hormone biosynthesis in both male and female D. rerio fed a reduced-protein diet. In contrast, an upregulation of secondary bile acid biosynthesis and synthesis and degradation of ketone bodies was concomitant with a downregulation in steroid hormone biosynthesis in females fed a reduced-fat diet.

Conclusions: These study outcomes provide insight into future investigations to understand nutrient requirements to optimize growth, reproductive, and health demographics to microbial populations and metabolism in the D. rerio gut ecosystem. These evaluations are critical in understanding the maintenance of steady-state physiologic and metabolic homeostasis in D. rerio. Curr Dev Nutr 20xx;x:xx.

Keywords: 16S rRNA; PICRUSt2; QIIME2; diet; homeostasis; nutrition.


Figures

FIGURE 1
FIGURE 1
Total body weight average for tanks of fish (mg) for male and female D. rerio (combined) measured every 2 wk from wk 2 to wk 14 on the assigned diets (n = 10 tanks, 14 fishes per tank for each diet treatment). Sample destinations are as follows: D. rerio fed standard reference diet (SR, green line, n = 10 tanks), D. rerio fed reduced-fat diet (RF, blue line, n = 10 tanks), and D. rerio fed reduced-protein (RP, red line, n = 10 tanks). The line plot was generated via SPSS (version 26).RF, reduced-fat; RP, reduced-protein; SR, standard reference.
FIGURE 2
FIGURE 2
D. rerio body metrics at termination 16 wk on the assigned diets (n = 10 tanks, 14 fishes per tank for each diet treatment). The vertical bars represent the mean of body metric, and the error bars represent SEM. For each sex, different letters indicate differences among dietary treatments at P < 0.05, determined via an ANOVA analysis. (A) Total mean body weight for individual fish (mg) for male and female D. rerio. (B) Standard mean body length for individual fish (mm) for male and female D. rerio. (C) Total mean body moisture for individual fish (%) for male and female D. rerio. (D) Dry mean body lipid for individual fish (%) for male and female D. rerio. Sample designations are as follows: D. rerio fed with the standard reference diet (SR, green bars, n = 10 tanks), D. rerio fed with the reduced-protein diet (RP, red bars, n = 10 tanks), D. rerio fed with the reduced-fat (RF, blue bars, n = 10 tanks). The bar plot was generated via SPSS (version 26).
FIGURE 3
FIGURE 3
Reproductive metrics after 16–20 wk on the assigned diets for males and females outcrossed with females and males, respectively, from brook stock maintained on Artemia (n = 20 breeding events for females of the dietary treatments with a 2-wk gap, n = 10 breeding events for males of the dietary treatments). The vertical bars represent the mean of reproductive metrics, and the error bars represent SEM. For each sex, different letters indicate differences among dietary treatments at P < 0.05, determined via an ANOVA analysis. (A) Total egg produced on average for breeding pairs of male and female. (B) Egg viability (%) on average at 4 hpf for breeding pairs of male and female D. rerio crossed with males and females from standard diet stock. (C) Egg viability (%) on average at 24 hpf for breeding pairs of male and female D. rerio after 16–20 wk on the assigned diets crossed with males and females from standard diet stock. Sample designations are as follows: D. rerio fed with the standard reference diet (SR, green bars), D. rerio fed with the reduced-protein diet (RP, red bars), D. rerio fed with the reduced-fat (RF, blue bars). The bar plot was generated via SPSS (v.26). The RF (RF males), there was only a single instance of reproduction, and this group was not included into the analysis; however, this group is represented visually in the figure. The points outside of the box plots represent outliers.
FIGURE 4
FIGURE 4
(A) Relative abundance stacked column bar graph showing top 15 taxa at the most resolved level across all samples (n = 4 for each sample) in the gut ecosystem of D. rerio. Taxonomic identities were based on their assignment through the (SILVA v138) database as determined by the Quantitative Insights into Microbial Ecology (QIIME2, v2022.2) and graphed using R (ggplot package). (B) The mean of each sample group was plotted for clarity. Sample designations are as follows: RP-M = D. rerio males fed with the reduced-protein diet; RP-F = D. rerio females fed with the reduced-protein diet; SR-M = D. rerio male fed with the standard reference diet; SR-F = D. rerio female fed with the standard reference diet; RF-M = D. rerio male fed with the reduced-fat diet; RF-F = D. rerio female fed with the reduced-fat diet. A list of taxa and their abundances is presented in Supplemental Data 1. RF, reduced-fat; RP, reduced-protein; SR, standard reference.
FIGURE 5
FIGURE 5
Linear discriminant analysis (LDA) effect size (LEfSe) analysis was performed on the taxonomic data of the D. rerio samples at the highest resolution. The effect size was visualized as a bar graph of D. rerio samples, (A) one class representing the female D. rerio fed with the standard reference diet (n = 4; green bars), one class representing the female D. rerio fed with the reduced-fat diet (n = 4; red bars). (B) one class representing female D. rerio fed with the standard reference diet (n = 4; red bars), one class representing female D. rerio fed with the reduced-protein diet (n = 4; green bars). (C) One class representing the male D. rerio fed with the reduced-protein diet (n = 4; red bars), this was compared with male D. rerio fed with the standard reference diet. (D) Male D. rerio fed with the standard reference diet (n = 4; green bars), one class representing the male D. rerio fed with the reduced-fat diet (n = 4; red bars). The values shown on the x-axis correspond to the log(10) effect size values at an inclusion threshold of ± 3.6.
FIGURE 6
FIGURE 6
Β-Diversity analysis of gut microbiota of D. rerio was observed across all similarity metrics determined for the ASV table. Bray-Curtis PCOA plot to display sample clustering patterns based on observed ASVs. plotted with R (ggplot package). (A) represents all samples under one plot, and (B–D) represents samples separated for clarity. Bray–Curtis distance matrix data generated via QIIME2(v.2022.2), and the q2-qiime diversity β-group-significance. The group assignments are indicated as follows: female D. rerio fed with the reduced-fat diet (blue open square; n = 4); male D. rerio fed with the reduced-fat diet (blue square; n = 4); female D. rerio fed with the standard reference diet (black triangle; n = 4); male D. rerio fed with the standard reference diet (black open triangle; n = 4); female D. rerio fed with the reduced-protein diet (open red circle; n = 4); Male D. rerio fed with the reduced-protein diet (red circle; n = 4).
FIGURE 7
FIGURE 7
Barplot of predicted KEGG orthology (KO) metabolic functions of D. rerio microbiota determined through Phylogenetic Investigation of Communities by Reconstruction of Unobserved States (PICRUSt2 v2.3.0-b) script pathway_pipeline.py. light blue = female D. rerio fed with the reduced-fat diet (n = 4), dark green n = female D. rerio fed with the standard reference diet (n = 4), and red = female D. rerio fed with the reduced-protein diet (n = 4). The ASV table was generated from QIIME2 (v.2022.2). The x-axis displays the functional pathway description for each sample, and the y-axis displays the expression level normalized against the standard reference diet (relative functional abundance), the error bars represent the SE between sample groups. The analysis was performed using the level 2 KEGG BRITE hierarchical functional categories using PICRUSt2 (v2.3.0-b) script pathway_pipeline.py with manually curated mapfile from https://www.genome.jp/kegg-bin/get_htext?ko00001.keg (accessed on 6 September 2020).
FIGURE 8
FIGURE 8
Barplot of predicted KEGG orthology (KO) metabolic functions of D. rerio microbiota determined through Phylogenetic Investigation of Communities by Reconstruction of Unobserved States (PICRUSt2 v2.3.0-b) script pathway_pipeline.py. Light blue = male D. rerio fed with the reduced-fat diet (n = 4), dark green n = male D. rerio fed with the standard reference diet (n = 4), and red = male D. rerio fed with the reduced-protein (n = 4). The ASV table was generated from QIIME2 (v.2022.2). The x-axis displays the functional pathway description for each sample, and the y-axis displays the expression level normalized against the standard reference diet (relative functional abundance), the error bars represent the SE between sample groups. The analysis was performed using the level 2 KEGG BRITE hierarchical functional categories using PICRUSt2 (v2.3.0-b) script pathway_pipeline.py with manually curated mapfile from https://www.genome.jp/kegg-bin/get_htext?ko00001.keg (accessed on 6 September 2020).

Similar articles

Cited by

References

    1. López Nadal A., Ikeda-Ohtsubo W., Sipkema D., Peggs D., McGurk C., Forlenza M M., et al. Feed, microbiota, and gut immunity: using the zebrafish model to understand fish health. Front. Immunol. 2020;11:114. - PMC - PubMed
    1. Watts S.A., Powell M., D'Abramo L L. Fundamental approaches to the study of zebrafish nutrition. ILAR. J. 2012;53(2):144–160. - PMC - PubMed
    1. Flores E.M., Nguyen A.T., Odem M.A., Eisenhoffer G.T., Krachler A.M. The zebrafish as a model for gastrointestinal tract-microbe interactions. Cell. Microbiol. 2020;22(3) - PMC - PubMed
    1. Howe K., Clark M.D., Torroja C.F., Torrance J., Berthelot C., Muffato M., et al. The zebrafish reference genome sequence and its relationship to the human genome. Nature. 2013;496(7446):498–503. - PMC - PubMed
    1. Wang Z., Du J., Lam S.H., Mathavan S., Matsudaira P., Gong Z. Morphological and molecular evidence for functional organization along the rostrocaudal axis of the adult zebrafish intestine. BMC. Genomics. 2010;11:392. - PMC - PubMed

LinkOut - more resources