

A miRNome analysis at the early postmortem interval
- PMID: 37304870
- PMCID: PMC10257396
- DOI: 10.7717/peerj.15409
A miRNome analysis at the early postmortem interval
Abstract
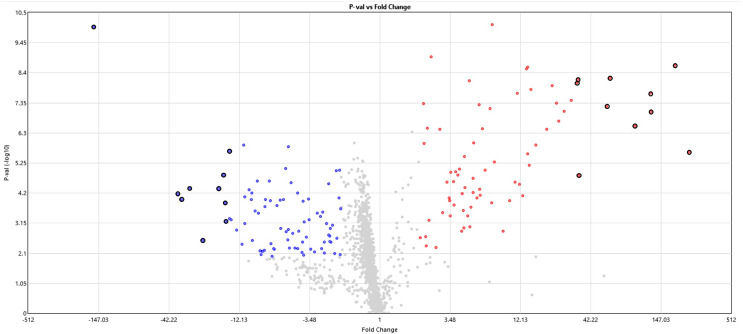
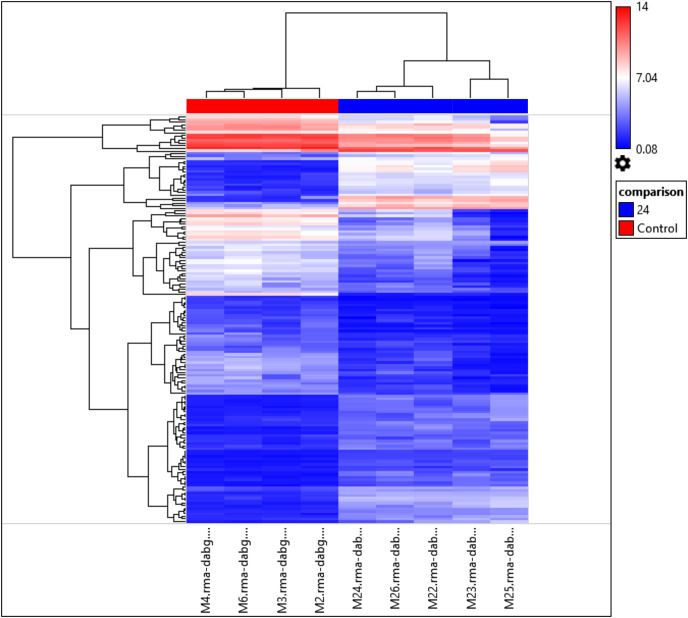
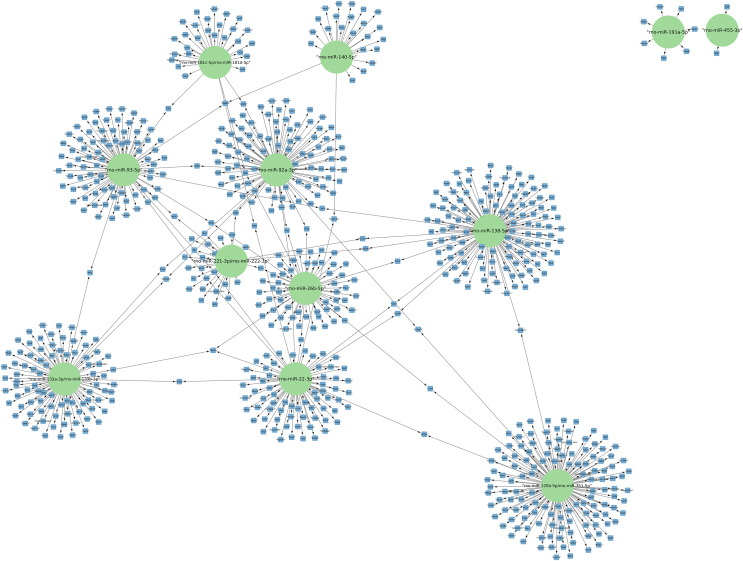
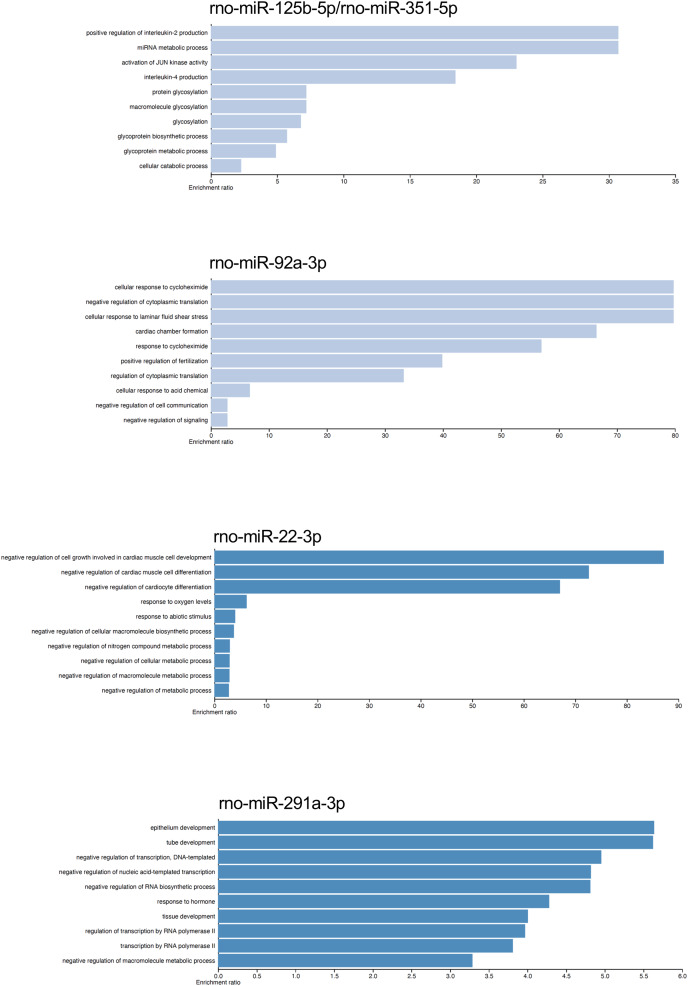
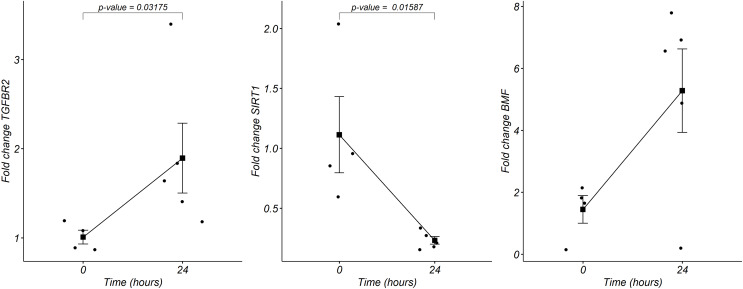
The postmortem interval (PMI) is the time elapsing since the death of an individual until the body is examined. Different molecules have been analyzed to better estimate the PMI with variable results. The miRNAs draw attention in the forensic field to estimate the PMI as they can better support degradation. In the present work, we analyzed the miRNome at early PMI in rats' skeletal muscle using the Affymetrix GeneChip™ miRNA 4.0 microarrays. We found 156 dysregulated miRNAs in rats' skeletal muscle at 24 h of PMI, out of which 84 were downregulated, and 72 upregulated. The miRNA most significantly downregulated was miR-139-5p (FC = -160, p = 9.97 × 10⁻¹¹), while the most upregulated was rno-miR-92b-5p (FC = 241.18, p = 2.39 × 10⁻⁶). Regarding the targets of these dysregulated miRNAs, the rno-miR-125b-5p and rno-miR-138-5p were the miRNAs with more mRNA targets. The mRNA targets that we found in the present study participate in several biological processes such as interleukin secretion regulation, translation regulation, cell growth, or low oxygen response. In addition, we found a downregulation of SIRT1 mRNA and an upregulation of TGFBR2 mRNA at 24 h of PMI. These results suggest there is an active participation of miRNAs at early PMI which could be further explored to identify potential biomarkers for PMI estimation.
Keywords: Microarrays; Non-coding RNA; Postmortem interval; miRNA.
© 2023 Guardado-Estrada et al.
Conflict of interest statement
The authors declare that they have no competing interests.
Figures
Similar articles
-
Dysregulation of miR-381-3p and miR-23b-3p in skeletal muscle could be a possible estimator of early post-mortem interval in rats.PeerJ. 2021 Apr 27;9:e11102. doi: 10.7717/peerj.11102. eCollection 2021. PeerJ. 2021. PMID: 33986977 Free PMC article.
-
Post-mortem interval estimation using miRNAs of road traffic accident cases: A forensic molecular approach.Sci Justice. 2023 Jul;63(4):485-492. doi: 10.1016/j.scijus.2023.04.011. Epub 2023 May 2. Sci Justice. 2023. PMID: 37453780
-
Using miRNAs and circRNAs to estimate PMI in advanced stage.Leg Med (Tokyo). 2019 May;38:51-57. doi: 10.1016/j.legalmed.2019.04.002. Epub 2019 Apr 2. Leg Med (Tokyo). 2019. PMID: 30986695
-
Suitability of miRNA assessment in postmortem interval estimation.Eur Rev Med Pharmacol Sci. 2021 Feb;25(4):1774-1787. doi: 10.26355/eurrev_202102_25069. Eur Rev Med Pharmacol Sci. 2021. PMID: 33660786 Review.
-
Review of the current and potential use of biological and molecular methods for the estimation of the postmortem interval in animals and humans.J Vet Diagn Invest. 2023 Mar;35(2):97-108. doi: 10.1177/10406387231153930. Epub 2023 Feb 6. J Vet Diagn Invest. 2023. PMID: 36744749 Free PMC article. Review.
Cited by
-
Potential Role of mRNA in Estimating Postmortem Interval: A Systematic Review.Int J Mol Sci. 2024 Jul 26;25(15):8185. doi: 10.3390/ijms25158185. Int J Mol Sci. 2024. PMID: 39125753 Free PMC article.
-
Post-mortem Interval estimate based on dental pulp: A histomorphology approach.J Forensic Odontostomatol. 2024 Aug 29;42(2):60-75. doi: 10.5281/zenodo.13371720. J Forensic Odontostomatol. 2024. PMID: 39244767 Free PMC article.
-
microRNAs as New Biomolecular Markers to Estimate Time since Death: A Systematic Review.Int J Mol Sci. 2024 Aug 24;25(17):9207. doi: 10.3390/ijms25179207. Int J Mol Sci. 2024. PMID: 39273155 Free PMC article.
-
Volabolomic Fingerprinting for Post-Mortem Interval Estimation: A Novel Physiological Approach.Biomolecules. 2024 Feb 28;14(3):286. doi: 10.3390/biom14030286. Biomolecules. 2024. PMID: 38540706 Free PMC article.
References
-
- Cai Y, Ruan W, Ding J, Wei N, Wang J, Zhang H, Ma N, Weng G, Su W, Lin Y, Zhu K. miR-93-5p regulates the occurrence and development of esophageal carcinoma epithelial cells by targeting TGFβR2. International Journal of Molecular Medicine. 2021;47(3):3. doi: 10.3892/ijmm.2020.4836. - DOI - PMC - PubMed
Publication types
MeSH terms
Substances
LinkOut - more resources
Full Text Sources
Molecular Biology Databases
