. 2023 May 25:10:1176602.
doi: 10.3389/fmed.2023.1176602. eCollection 2023.

Lymphocyte HVEM/BTLA co-expression after critical illness demonstrates severity indiscriminate upregulation, impacting critical illness-induced immunosuppression

Affiliations

Lymphocyte HVEM/BTLA co-expression after critical illness demonstrates severity indiscriminate upregulation, impacting critical illness-induced immunosuppression

Michelle E Wakeley et al. Front Med (Lausanne). .

Abstract

Introduction: The co-regulatory molecule, HVEM, can stimulate or inhibit immune function, but when co-expressed with BTLA, forms an inert complex preventing signaling. Altered HVEM or BTLA expression, separately have been associated with increased nosocomial infections in critical illness. Given that severe injury induces immunosuppression, we hypothesized that varying severity of shock and sepsis in murine models and critically ill patients would induce variable increases in HVEM/BTLA leukocyte co-expression.

Methods: In this study, varying severities of murine models of critical illness were utilized to explore HVEM+BTLA+ co-expression in the thymic and splenic immune compartments, while circulating blood lymphocytes from critically ill patients were also assessed for HVEM+BTLA+ co-expression.

Results: Higher severity murine models resulted in minimal change in HVEM+BTLA+ co-expression, while the lower severity model demonstrated increased HVEM+BTLA+ co-expression on thymic and splenic CD4+ lymphocytes and splenic B220+ lymphocytes at the 48-hour time point. Patients demonstrated increased co-expression of HVEM+BTLA+ on CD3+ lymphocytes compared to controls, as well as CD3+Ki67- lymphocytes. Both L-CLP 48hr mice and critically ill patients demonstrated significant increases in TNF-α.

Discussion: While HVEM increased on leukocytes after critical illness in mice and patients, changes in co-expression did not relate to degree of injury severity of murine model. Rather, co-expression increases were seen at later time points in lower severity models, suggesting this mechanism evolves temporally. Increased co-expression on CD3+ lymphocytes in patients on non-proliferating cells, and associated TNF-α level increases, suggest post-critical illness co-expression does associate with developing immune suppression.

Keywords: BTLA; HVEM; immune dysfunction; sepsis; trauma.


Conflict of interest statement

The authors declare that the research was conducted in the absence of any commercial or financial relationships that could be construed as a potential conflict of interest.

Figures

Figure 1
Figure 1
Murine flow cytometry gating strategy demonstrating CD3+ (A), CD4+ (B), and B220+ (C) gating for HVEM+ and BTLA+ co-expression demonstrated in a 24-h L-CLP spleen sample.
Figure 2
Figure 2
Patient flow gating strategy demonstrating CD3+ cells with Ki67+ expression, then subset evaluation of HVEM+ and BTLA+ expression in the Ki67+ and Ki67 components, with gates set using fluorescence minus one technique.
Figure 3
Figure 3
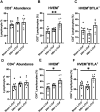
Thymic CD3+ and CD4+ lymphocytes demonstrated no change in HVEM+ BTLA+ co-expression after either Hem/CLP or S-CLP models, though CD3+ and CD4+ lymphocytes both demonstrated increased HVEM expression after S-CLP. (A) Thymic CD3+ lymphocyte abundance. (B) Thymic CD3+ lymphocyte HVEM+ expression. (C) Thymic CD3+ lymphocyte HVEM+ BTLA+ co-expression. (D) Thymic CD4+ lymphocyte abundance. (E) Thymic CD4+ HVEM+ expression. (F) Thymic CD4+ HVEM+ BTLA+ co-expression. (A–F) Summary graphs show mean ± SEM all after Hem/CLP and S-CLP treatments; [Sham Hem/CLP n = 11, Hem/CLP n = 11, Sham S-CLP n = 10, S-CLP n = 10]; significance *p < 0.05; **p < 0.01.
Figure 4
Figure 4
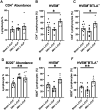
Splenic CD4+ demonstrated no change in HVEM+ or HVEM+ BTLA+ co-expression after either Hem/CLP or S-CLP, while splenic B220+ lymphocytes demonstrated increased abundance after both Hem/CLP and S-CLP, and reduced HVEM+ expression and HVEM+ BTLA+ co-expression after S-CLP. (A) Splenic CD4+ lymphocyte abundance. (B) Splenic CD4+ lymphocyte HVEM+ expression. (C) Splenic CD4+ lymphocyte HVEM+ BTLA+ co-expression. (D) Splenic B220+ lymphocyte abundance. (E) Splenic B220+ HVEM+ expression. (F) Splenic B220+ HVEM+ BTLA+ co-expression. (A–F) Summary graphs show mean ± SEM all after Hem/CLP and S-CLP treatments; [Sham Hem/CLP n = 11, Hem/CLP n = 11, Sham S-CLP n = 10, S-CLP n = 10]; significance *p < 0.05; **p < 0.01.
Figure 5
Figure 5
Thymic CD3+ and CD4+ lymphocytes both demonstrated increased HVEM expression after 48 h L-CLP, and thymic CD4+ lymphocytes also demonstrated a significant increase in HVEM+ BTLA+ co-expression at 48 h L-CLP. (A) Thymic CD3+ lymphocyte abundance. (B) Thymic CD3+ lymphocyte HVEM+ expression. (C) Thymic CD3+ lymphocyte HVEM+ BTLA+ co-expression. (D) Thymic CD4+ lymphocyte abundance. (E) Thymic CD4+ HVEM+ expression. (F) Thymic CD4+ HVEM+ BTLA+ co-expression. (A–F) Summary graphs show mean ± SEM all after L-CLP treatment; [Sham L-CLP n = 7, 24 h L-CLP n = 6, 48 h L-CLP n = 6]; significance *p < 0.05; **p < 0.01.
Figure 6
Figure 6
Splenic CD4+ lymphocytes demonstrated increased HVEM+ expression and HVEM+ BTLA+ co-expression after L-CLP, while splenic B220+ lymphocytes demonstrated increased abundance, and increased HVEM+ expression and HVEM+ BTLA+ co-expression after L-CLP. (A) Splenic CD4+ lymphocyte abundance. (B) Splenic CD4+ lymphocyte HVEM+ expression. (C) Splenic CD4+ lymphocyte HVEM+ BTLA+ co-expression. (D) Splenic B220+ lymphocyte abundance. (E) Splenic B220+ HVEM+ expression. (F) Splenic B220+ HVEM+ BTLA+ co-expression. (A–F) Summary graphs show mean ± SEM all after L-CLP treatment; [Sham L-CLP n = 7, 24 h L-CLP n = 6, 48 h L-CLP n = 6]; significance *p < 0.05; **p < 0.01.
Figure 7
Figure 7
Mice demonstrate transient increases in multiple pro-inflammatory cytokines at the 24 h mark after all three models; however, this increase nearly always abates at the 48 h time point in L-CLP mice. (A) IL-23; (B) IL-1α; (C) IFN-γ; (D) TNF-α; (E) MCP-1; (F) IL12p70; (G) IL-1β; (H) IL-10; (I) IL-6; (J) IL-27; (K) IL-17A; (L) GM-CSF. (A–L) Summary graphs show mean ± SEM all after Hem/CLP, S-CLP, and L-CLP treatments [Sham Hem/CLP n = 11, Hem/CLP n = 11, Sham S-CLP n = 10, S-CLP n = 10, Sham L-CLP n = 7, 24 h L-CLP n = 6, 48 h L-CLP n = 6]; significance *p < 0.05; **p < 0.01.
Figure 8
Figure 8
There was significant CD3+ lymphocyte loss after critical illness, with an associated increase in HVEM+ and BTLA+ expression on remaining CD3+ cells. There was also a significant increase in HVEM+BTLA+ co-expression on CD3+ cells after critical illness. (A) Circulating CD3+ lymphocyte abundance. (B) Circulating CD3+ lymphocyte HVEM+ expression. (C) Circulating CD3+ lymphocyte BTLA+ expression. (D) Circulating CD3+ HVEM+ BTLA+ co-expression. (A–D) Summary graphs show mean ± SEM all in critically ill patients as compared to healthy human controls [Control n = 12, Patients n = 17]; significance *p < 0.05; **p < 0.01.
Figure 9
Figure 9
Correlation of patient APACHE II score with co-expression of HVEM+BTLA+ on CD3+ lymphocytes after critical illness. R2 = 0.1739.
Figure 10
Figure 10
Lymphocyte proliferation after critical illness. There was a significant increase in total lymphocyte proliferation in critically ill patients, and this remained true in the CD3-positive subset. In the non-proliferating Ki67 subset, there was CD3+ lymphocyte loss after critical illness, with an associated increase in HVEM+ expression and HVEM+BTLA+ co-expression remaining Ki67CD3+ lymphocytes. (A) Circulating Ki67+ lymphocyte abundance. (B) Circulating Ki67+ CD3+ lymphocytes. (C) Circulating Ki67 lymphocyte abundance. (D) Circulating Ki67CD3+ lymphocytes. (E) Circulating Ki67CD3+ lymphocytes HVEM+ expression. (F) Circulating Ki67CD3+HVEM+ BTLA+ co-expression. (A–F) Summary graphs show mean ± SEM all in critically ill patients as compared to healthy human controls [Control n = 7, Patients n = 5]; significance *p < 0.05; **p < 0.01.
Figure 11
Figure 11
Inflammatory cytokines changes in critical illness, including notable decreases in TNF-α and increases in IL-6 when compared to healthy controls. (A) IL-1β. (B) IFN-α2. (C) IFN-γ. (D) TNF-α. (E) MCP-1. (F) IL-6. (G) IL-8. (H) IL-10. (I) IL-12p70. (J) IL-17A. (K) IL-18. (L) IL-23. (A–L) Summary graphs show mean ± SEM all in critically ill patients as compared to healthy human controls [Control n = 14, Patients n = 23]; significance *p < 0.05; **p < 0.01.

References

    1. Gunst M, Ghaemmaghami V, Gruszecki A, Urban J, Frankel H, Shafi S. Changing epidemiology of trauma deaths leads to a bimodal distribution. Proc (Bayl Univ Med Cent). (2010) 23:349–54. doi: 10.1080/08998280.2010.11928649, PMID: - DOI - PMC - PubMed
    1. Ma XY, Tian LX, Liang HP. Early prevention of trauma-related infection/sepsis. Mil Med Res. (2016) 3:33. doi: 10.1186/s40779-016-0104-3, PMID: - DOI - PMC - PubMed
    1. Kimura F, Shimizu H, Yoshidome H, Ohtsuka M, Miyazaki M. Immunosuppression following surgical and traumatic injury. Surg Today. (2010) 40:793–808. doi: 10.1007/s00595-010-4323-z, PMID: - DOI - PMC - PubMed
    1. Spruijt NE, Visser T, Leenen LP. A systematic review of randomized controlled trials exploring the effect of immunomodulative interventions on infection, organ failure, and mortality in trauma patients. Crit Care. (2010) 14:R150. doi: 10.1186/cc9218, PMID: - DOI - PMC - PubMed
    1. Pellegrini JD, De AK, Kodys K, Puyana JC, Furse RK, Miller-Graziano C. Relationships between T lymphocyte apoptosis and anergy following trauma. J Surg Res. (2000) 88:200–6. doi: 10.1006/jsre.1999.5797, PMID: - DOI - PubMed