. 2023 May 25:17:1186630.
doi: 10.3389/fncel.2023.1186630. eCollection 2023.

Peripheral Fragile X messenger ribonucleoprotein is required for the timely closure of a critical period for neuronal susceptibility in the ventral cochlear nucleus

Affiliations

Peripheral Fragile X messenger ribonucleoprotein is required for the timely closure of a critical period for neuronal susceptibility in the ventral cochlear nucleus

Xiaoyan Yu et al. Front Cell Neurosci. .

Abstract

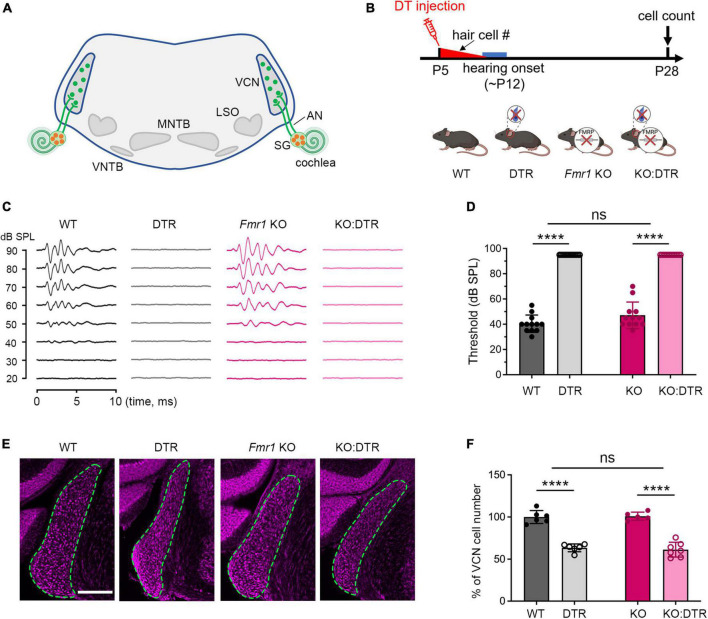
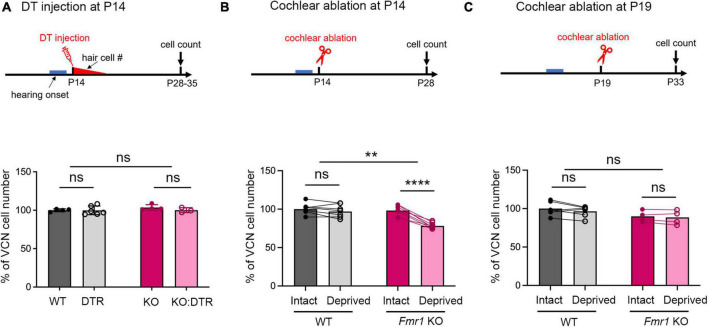
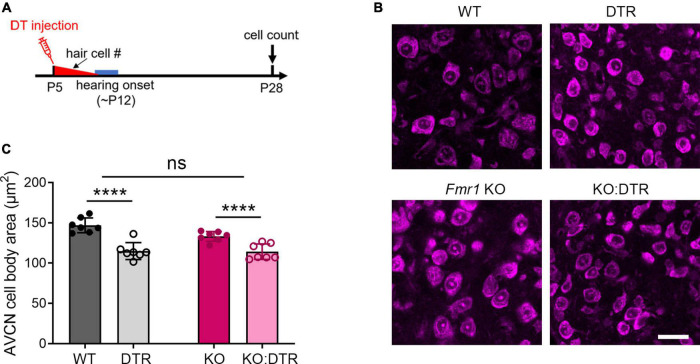
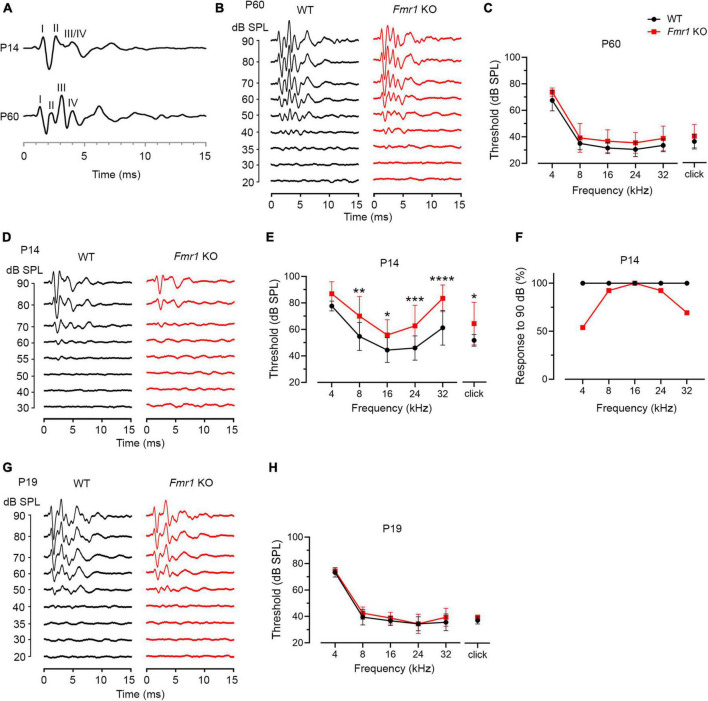
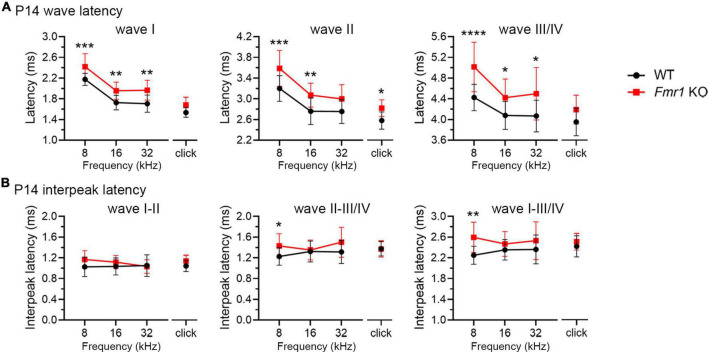
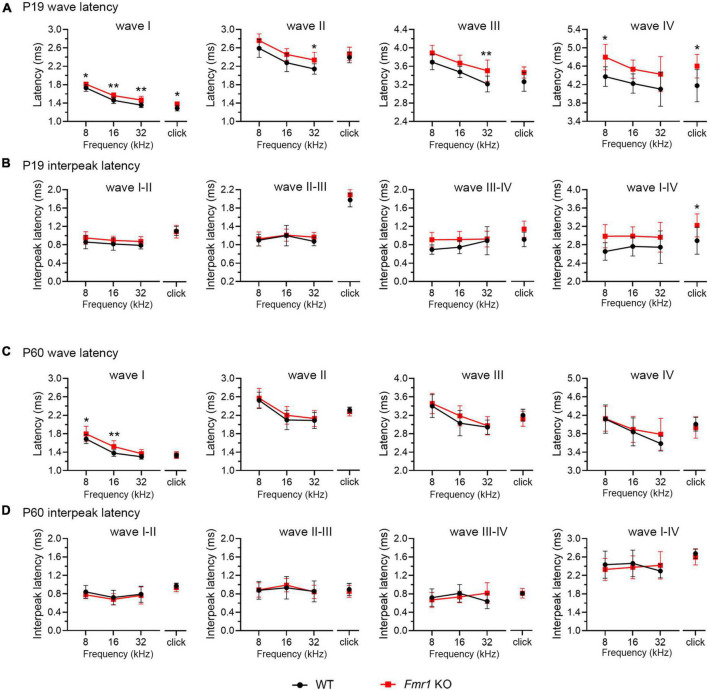
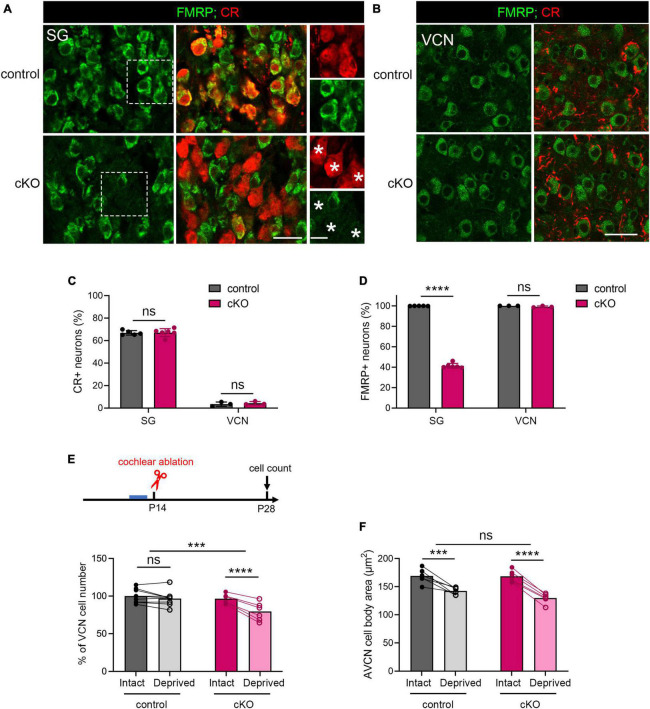
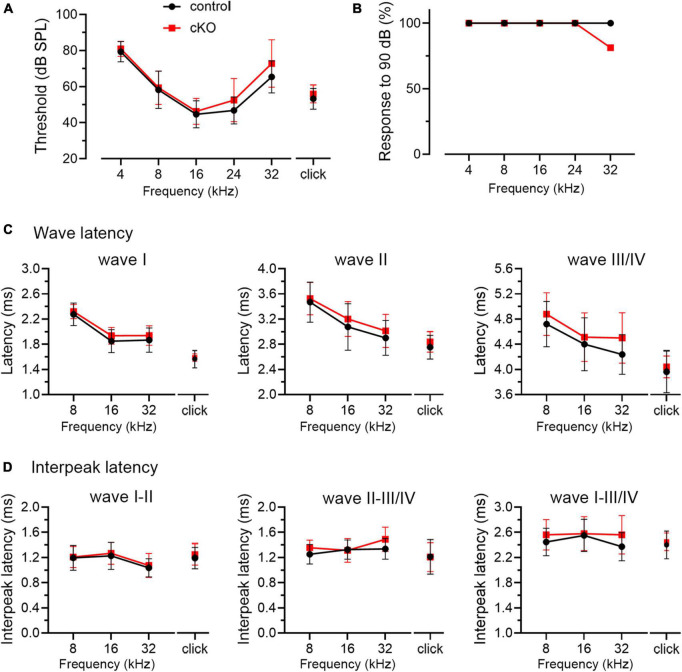
Alterations in neuronal plasticity and critical periods are common across neurodevelopmental diseases, including Fragile X syndrome (FXS), the leading single-gene cause of autism. Characterized with sensory dysfunction, FXS is the result of gene silencing of Fragile X messenger ribonucleoprotein 1 (FMR1) and loss of its product, Fragile X messenger ribonucleoprotein (FMRP). The mechanisms underlying altered critical period and sensory dysfunction in FXS are obscure. Here, we performed genetic and surgical deprivation of peripheral auditory inputs in wildtype and Fmr1 knockout (KO) mice across ages and investigated the effects of global FMRP loss on deafferentation-induced neuronal changes in the ventral cochlear nucleus (VCN) and auditory brainstem responses. The degree of neuronal cell loss during the critical period was unchanged in Fmr1 KO mice. However, the closure of the critical period was delayed. Importantly, this delay was temporally coincidental with reduced hearing sensitivity, implying an association with sensory inputs. Functional analyses further identified early-onset and long-lasting alterations in signal transmission from the spiral ganglion to the VCN, suggesting a peripheral site of FMRP action. Finally, we generated conditional Fmr1 KO (cKO) mice with selective deletion of FMRP in spiral ganglion but not VCN neurons. cKO mice recapitulated the delay in the VCN critical period closure in Fmr1 KO mice, confirming an involvement of cochlear FMRP in shaping the temporal features of neuronal critical periods in the brain. Together, these results identify a novel peripheral mechanism of neurodevelopmental pathogenesis.

Keywords: Fragile X syndrome; afferent influence; brain development; critical period; hearing onset; sensory organ.


Conflict of interest statement

The authors declare that the research was conducted in the absence of any commercial or financial relationships that could be construed as a potential conflict of interest.

Figures

FIGURE 1
FIGURE 1
Hair cell deletion-induced afferent deprivation before hearing onset resulted in significant neuronal loss in the VCN in both WT and Fmr1 KO mice. (A) Schematic diagram of the projection from the SG in the cochlea to the VCN in the brainstem. (B) Experimental timeline and four experimental groups (WT, DTR, Fmr1 KO, and KO:DTR). DT or saline (as control) was administered at P5, leading to complete hair cell loss before hearing onset. Tissue collection and data analysis were conducted at P28. (C) Examples of ABR patterns in each experimental group. The injection was performed at P5 or P14 and ABRs were recorded at P28-35 in response to click stimuli. (D) ABR thresholds in response to click stimulus in WT (n = 12), DTR (n = 14), Fmr1 KO (n = 12), and KO:DTR (n = 13) groups at P28 following DT/saline injection at P5. DTR and KO:DTR groups failed to produce detectable ABRs to click stimulus at 90 dB. (E) NeuroTrace staining in the VCN (dashed circles) of each experimental group. (F) Quantitative analysis of the neuron number in the VCN in the four experimental groups at P28. Hair cell deletion led to significant neuronal loss in both DTR (n = 6, p < 0.0001) and KO:DTR (n = 7, p < 0.0001) groups as compared to WT (n = 6) and Fmr1 KO (n = 5) control groups, respectively (two-way ANOVA followed by Tukey’s post hoc tests). There was no significant interaction between Fmr1 genotype and afferent condition (p = 0.588). Scale bar = 250 μm in panel (E). AN, auditory nerve; LSO, lateral superior olive; MNTB, medial nucleus of the trapezoid body; SG, spiral ganglion; VCN, ventral cochlear nucleus; VNTB, ventral nucleus of the trapezoid body; #, number; ****p < 0.0001; ns, not significant.
FIGURE 2
FIGURE 2
Delayed closure of the critical period for VCN neuronal loss in response to afferent deprivation in Fmr1 KO mice. (A–C) Experimental timelines (top panel) and quantitative analyses of the neuron number in the VCN (lower panel) across three sets of experiments. (A) Following DT/saline injection at P14, neither DTR nor KO:DTR mice showed significant neuronal loss as compared to WT (WT, n = 4; DTR, n = 6, p > 0.999) and Fmr1 KO (Fmr1 KO, n = 4; KO:DTR, n = 3, p = 0.713) controls, respectively (two-way ANOVA followed by Tukey’s post hoc tests). (B) Following unilateral cochlear ablation at P14, WT mice did not show significant difference in the neuron number between the deprived (ipsilateral) side and intact (contralateral) side of the VCN (n = 7, p = 0.315), while Fmr1 KO mice showed significant neuronal loss on the deprived side compared to the interact side of VCN (n = 8, p < 0.0001, repeated measures two-way ANOVA followed by Tukey’s post hoc tests). (C) Following unilateral cochlear ablation at P19, neither WT nor Fmr1 KO mice showed a significant difference in the neuron number between the deprived side and intact side of the VCN. ****p < 0.0001; **p < 0.01, ns, not significant.
FIGURE 3
FIGURE 3
Neuronal cell size was reduced in the AVCN following afferent deprivation in both WT and Fmr1 KO mice. (A) Experimental timeline for hair cell deletion-induced afferent deprivation. DT or saline was administered at P5 and data analyses were conducted at P28. (B) NeuroTrace-labeling of AVCN neurons. (C) Quantitative analysis of neuronal cell size in the AVCN of four experimental groups at P28 (n = 7 per group). Hair cell deletion reduced neuronal cell size in both DTR and KO:DTR groups as compared to WT and Fmr1 KO controls, respectively (WT vs. DTR, p < 0.0001; Fmr1 KO vs. KO:DTR, p < 0.0001, two-way ANOVA followed by Tukey’s post hoc tests). There was no significant interaction between Fmr1 genotype and afferent condition (p = 0.0696). Scale bar = 25 μm in panel (B). ****p < 0.0001; ns, not significant.
FIGURE 4
FIGURE 4
Fmr1 KO mice displayed a delay in hearing onset. (A) Representative ABR patterns in response to click stimulus at 90 dB in P14 and P60 WT mice. The first three and the first four waves were identifiable at P14 and P60, respectively. (B) Representative ABRs in response to click stimuli at various sound levels at P60. (C) Quantitative analyses of ABR thresholds in WT and Fmr1 KO mice at P60. There was no significant difference in ABR thresholds between the two genotypes across all stimuli examined (WT, n = 10; Fmr1 KO, n = 12, two-way ANOVA followed by Tukey’s post hoc tests). (D) Representative ABRs in response to click stimuli at various sound levels at P14. (E) Quantitative analyses of ABR thresholds in WT and Fmr1 KO mice at P14. Fmr1 KO mice showed increased ABR thresholds compared to WT mice in response to click and tone bursts of 8, 16, 24, and 32 kHz (WT [n = 15–16] vs. Fmr1 KO [n = 13-14]: click, p = 0.0124; 8 kHz, p = 0.0018; 16 kHz, p = 0.0040; 24 kHz, p = 0.0005; 32 kHz, p < 0.0001, two-way ANOVA followed by Tukey’s post hoc tests). The variation in the sample size across frequencies was due to either that some frequencies were tested in a subset but not all animals or that some ABR peaks were not unambiguously identifiable. (F) Percentages of mice responsive to 90 dB SPL across 4-32 kHz frequency stimuli at P14. All WT mice showed ABRs at 90 dB across the frequency range. Only a proportion of Fmr1 KO mice had ABRs at 90 dB for 4 kHz (7 in 13 animals), 8 kHz (12 in 13 animals), 24 kHz (12 in 13 animals), and 32 kHz (9 in 13 animals) tone bursts. (G) Representative ABRs in response to click stimuli at various sound levels at P19. (H) Quantitative analyses of ABR thresholds in WT and Fmr1 KO mice at P19. There was no significant difference in ABR thresholds between the two genotypes across all stimuli examined (WT, n = 9; Fmr1 KO, n = 8, two-way ANOVA followed by Tukey’s post hoc tests). ****p < 0.0001; ***p < 0.001; **p < 0.01; *p < 0.05.
FIGURE 5
FIGURE 5
Prolonged latencies of ABR wave I in developing Fmr1 KO mice (P14). (A) Quantitative analyses of waveform latencies in WT and Fmr1 KO mice at P14. As compared to WT, Fmr1 KO mice showed longer latencies of: wave I in response to tone bursts of 8, 16, and 32 kHz frequencies (8 kHz, p = 0.0005; 16 kHz, p = 0.0014; 32 kHz, p = 0.0017); wave II in response to click and tone bursts of 8 and 16 kHz frequencies (click, p = 0.0478; 8 kHz, p = 0.0003, 16 kHz, p = 0.0051); and wave III/IV in response to tone bursts of 8, 16, and 32 kHz frequencies (8 kHz, p < 0.0001; 16 kHz, p = 0.0373; 32 kHz, p = 0.0196, two-way ANOVA followed by Tukey’s post hoc tests). (B) Quantitative analyses of interpeak latencies in WT and Fmr1 KO mice at P14. Fmr1 KO mice showed longer interpeak latencies of waves II-III/IV (p = 0.0394) and waves I-III/IV in response to 8 kHz frequency (p = 0.0012, two-way ANOVA followed by Tukey’s post hoc tests). Animal numbers for these analyses were seen in Table 3. ****p < 0.0001; ***p < 0.001; **p < 0.01; *p < 0.05.
FIGURE 6
FIGURE 6
Prolonged latencies of ABR wave I in P19 and P60 Fmr1 KO mice. (A) Quantitative analyses of waveform latencies in WT and Fmr1 KO mice at P19. Fmr1 KO mice showed longer latencies of: wave I in response to all stimuli examined (click, p = 0.0146; 8 kHz, p = 0.0389; 16 kHz, p = 0.0048; 32 kHz, p = 0.0024); wave II in response to 32 kHz frequency (p = 0.044); wave III in response to 32 kHz frequency (p = 0.0043); and wave IV in response to click and 8 kHz frequency stimuli (click, p = 0.0151; 8 kHz, p = 0.0232, two-way ANOVA followed by Tukey’s post hoc tests). (B) Quantitative analyses of interpeak latencies in WT and Fmr1 KO mice at P19. Fmr1 KO mice showed longer interpeak latencies of waves I-IV in response to click stimulus (p = 0.0441, two-way ANOVA followed by Tukey’s post hoc tests). (C) Quantitative analyses of waveform latencies in WT and Fmr1 KO at P60. Fmr1 KO mice showed longer latencies of wave I in response to 8 and 16 kHz frequencies (8 kHz, p = 0.0485; 16 kHz, p = 0.0057, two-way ANOVA followed by Tukey’s post hoc tests). (D) Quantitative analyses of interpeak latencies in WT and Fmr1 KO mice at P60. There was no significant difference in interpeak latencies between the two genotypes. Animal numbers for these analyses were seen in Tables 4, 5. **p < 0.01; *p < 0.05.
FIGURE 7
FIGURE 7
The critical period closure for VCN neuronal loss was delayed in Fmr1 cKO mice with selective FMRP deletion in the SG but not in the VCN. (A) Immunostaining of FMRP, CR, and DAPI in the SG of cKO mice and littermate controls. The right column is the magnification of the boxes in the left column. Stars indicate CR + neurons without FMRP expression in the cKO group. Scale bar = 20 μm (left two columns) and 10 μm (right column). (B) Immunostaining of FMRP and CR in the VCN of cKO mice and littermate controls. Scale bar = 20 μm. (C) Quantitative analysis of the percentage of CR + neurons in the SG and VCN. In the SG, the percentage of CR + neurons was 60-70% and comparable between cKO and control mice (control, 66.85% ± 2.04%, n = 5; cKO, 67.08% ± 3.57%, n = 6, p = 0.905, Student’s t-test). In the VCN, the percentage of CR + neurons was 1-6% and comparable between cKO and control mice (control, 3.44% ± 1.91%, n = 3; cKO, 4.26% ± 1.51%, n = 3, p = 0.592, Student’s t-test). (D) Quantitative analysis of the percentage of FMRP + neurons in the SG and VCN. In the SG, cKO mice had significantly fewer neurons with FMRP expression compared to control mice (control, 99.9% ± 0.14%, n = 5; cKO, 41.29% ± 2.42%, n = 6, p < 0.0001, Student’s t-test). In the VCN, nearly all neurons were FMRP + in both cKO and control mice (control, 100%; cKO, 99.07% ± 0.84%, n = 3 per group, (p = 0.194, Student’s t-test). (E) Experimental timeline and quantitative analysis of the neuron number in the VCN of cKO and control mice. Following unilateral cochlea ablation at P14, control mice show no significant difference in the neuron number between the deprived and intact sides of the VCN (n = 9, p = 0.200). cKO mice showed significant neuronal loss in the deprived side compared to the intact side of the VCN (n = 6, p < 0.0001, repeated measures two-way ANOVA followed by Tukey’s post hoc tests). (F) Quantitative analysis of neuronal cell size in the AVCN in cKO and control mice following unilateral cochlear ablation at P14 (n = 6 per group). Afferent deprivation resulted in smaller cell size in both cKO and control groups in the deprived side compared to the intact side, respectively (control, p = 0.0003; cKO, p < 0.0001, repeated measures two-way ANOVA followed by Tukey’s post hoc tests). There was no significant interaction between genotype and afferent condition (p = 0.0902). ****p < 0.0001; ***p < 0.001; ns, not significant.
FIGURE 8
FIGURE 8
ABR threshold and waveform latency were largely intact in Fmr1 cKO mice with selective FMRP deletion in the SG but not in the VCN. (A) Quantitative analyses of ABR thresholds in cKO and control mice at P14. There was no significant difference in ABR thresholds between the two genotypes across all stimuli examined (control, n = 14–16; cKO, n = 16–18, two-way ANOVA followed by Tukey’s post hoc tests). (B) Percentages of mice responsive to 90 dB across 4–32 kHz frequency stimuli at P14. All control mice (100%) and only a subpopulation of cKO mice (13 in 16 animals, 81.25%) showed ABR signal at 90 dB in 32 kHz. (C,D) Quantitative analyses of waveform latencies and interpeak latencies in cKO and control mice at P14. There was no significant difference in waveform latencies and interpeak latencies between the two genotypes examined (two-way ANOVA followed by Tukey’s post hoc tests). Animal numbers for panels (C,D) were seen in Table 6.

Similar articles

Cited by

References

    1. Akil O., Oursler A., Fan K., Lustig L. (2016). Mouse auditory brainstem response testing. Bio Protoc. 6:e1768. 10.21769/BioProtoc.1768 - DOI - PMC - PubMed
    1. Anbuhl K., Yao J., Hotz R., Mowery T., Sanes D. (2022). Auditory processing remains sensitive to environmental experience during adolescence in a rodent model. Nat. Commun. 13:2872. 10.1038/s41467-022-30455-9 - DOI - PMC - PubMed
    1. Bailey E., Green S. (2014). Postnatal expression of neurotrophic factors accessible to spiral ganglion neurons in the auditory system of adult hearing and deafened rats. J. Neurosci. 34 13110–13126. 10.1523/JNEUROSCI.1014-14.2014 - DOI - PMC - PubMed
    1. Buran B., Sarro E., Manno F., Kang R., Caras M., Sanes D. (2014). A sensitive period for the impact of hearing loss on auditory perception. J. Neurosci. 34 2276–2284. 10.1523/JNEUROSCI.0647-13.2014 - DOI - PMC - PubMed
    1. Campagnola L., Manis P. (2014). A map of functional synaptic connectivity in the mouse anteroventral cochlear nucleus. J. Neurosci. 34 2214–2230. 10.1523/JNEUROSCI.4669-13.2014 - DOI - PMC - PubMed