Clinical Trial
. 2023 Jul 10;188(7):578-591.
doi: 10.1093/ejendo/lvad063.

Novel aldo-keto reductase 1C3 inhibitor affects androgen metabolism but not ovarian function in healthy women: a phase 1 study

Affiliations
Clinical Trial

Novel aldo-keto reductase 1C3 inhibitor affects androgen metabolism but not ovarian function in healthy women: a phase 1 study

Isabella Gashaw et al. Eur J Endocrinol. .

Abstract

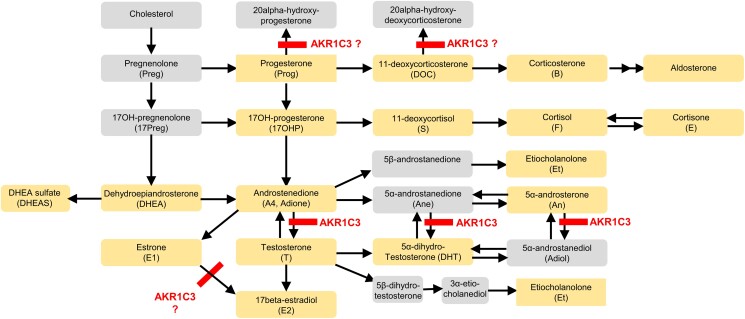
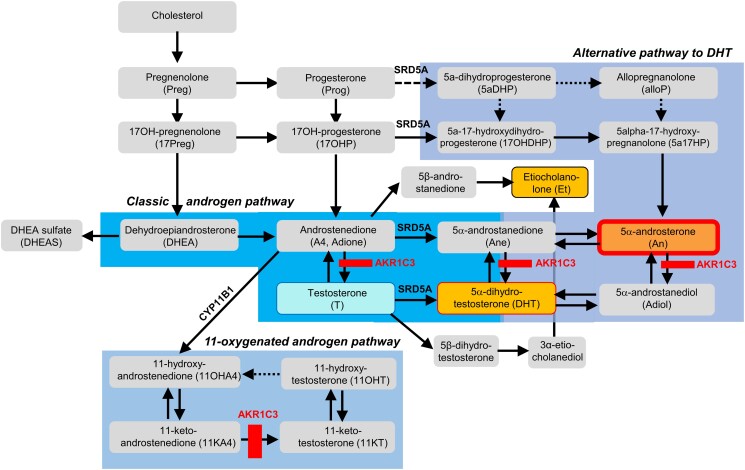
Objective: Aldo-keto reductase 1C3 (AKR1C3) has been postulated to be involved in androgen, progesterone, and estrogen metabolism. Aldo-keto reductase 1C3 inhibition has been proposed for treatment of endometriosis and polycystic ovary syndrome. Clinical biomarkers of target engagement, which can greatly facilitate drug development, have not yet been described for AKR1C3 inhibitors. Here, we analyzed pharmacodynamic data from a phase 1 study with a new selective AKR1C3 inhibitor, BAY1128688, to identify response biomarkers and assess effects on ovarian function.

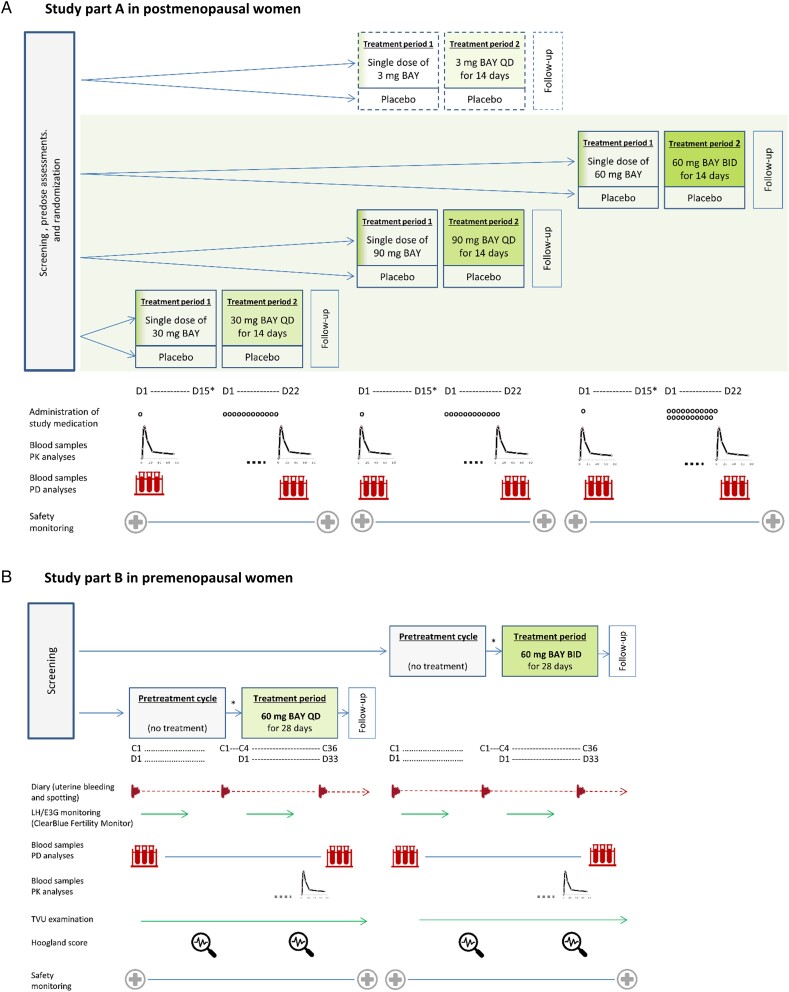
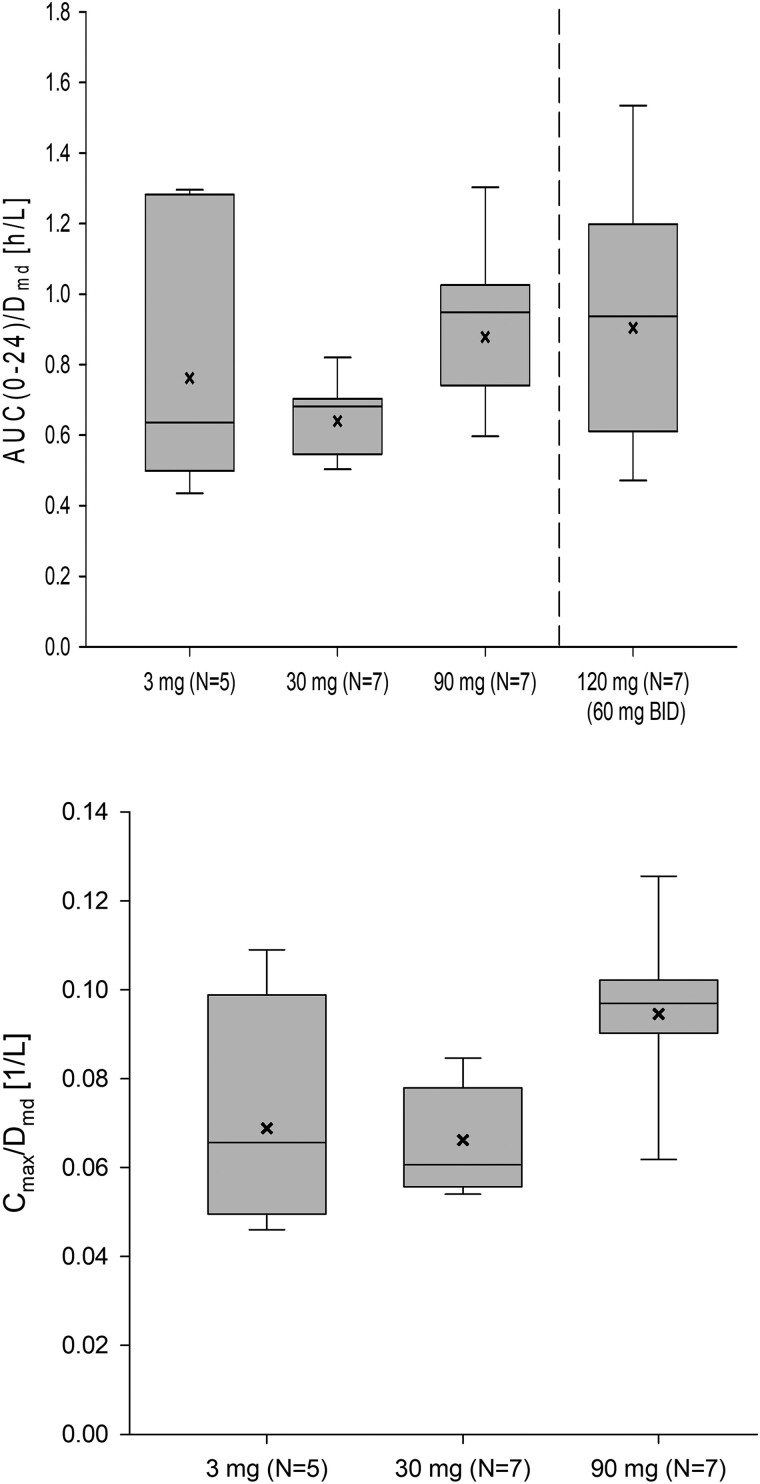
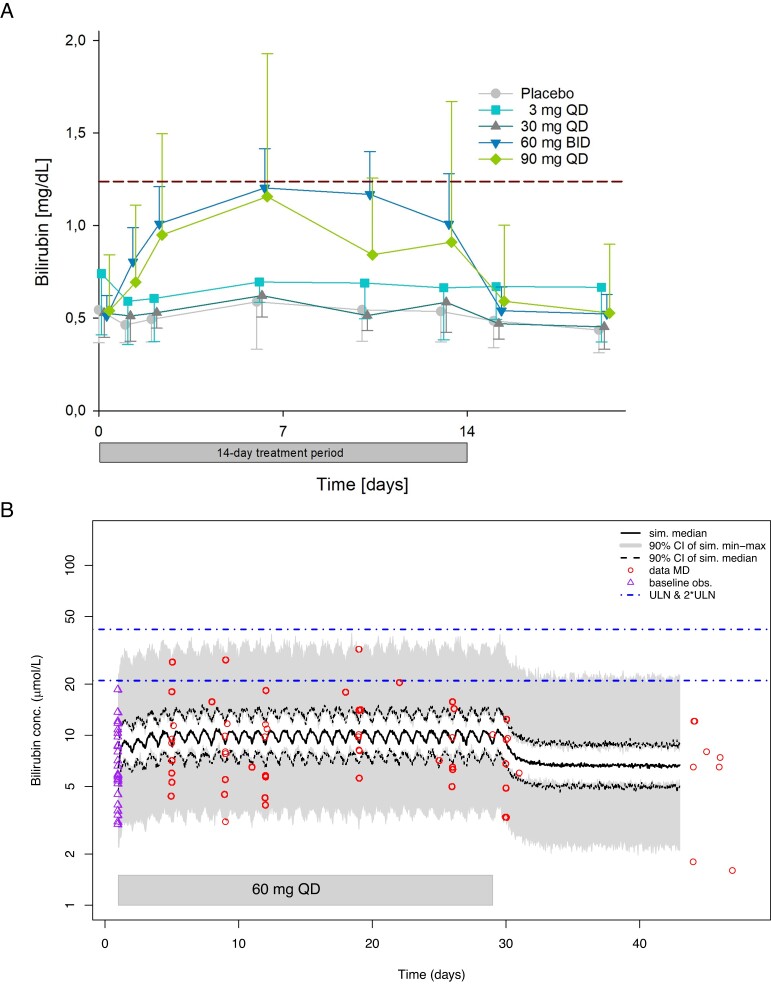
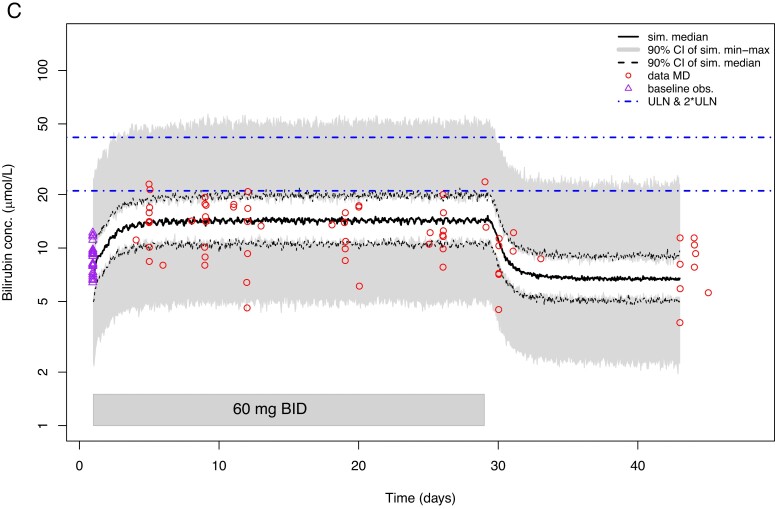
Design: In a multiple-ascending-dose placebo-controlled study, 33 postmenopausal women received BAY1128688 (3, 30, or 90 mg once daily or 60 mg twice daily) or placebo for 14 days. Eighteen premenopausal women received 60 mg BAY1128688 once or twice daily for 28 days.

Methods: We measured 17 serum steroids by liquid chromatography-tandem mass spectrometry, alongside analysis of pharmacokinetics, menstrual cyclicity, and safety parameters.

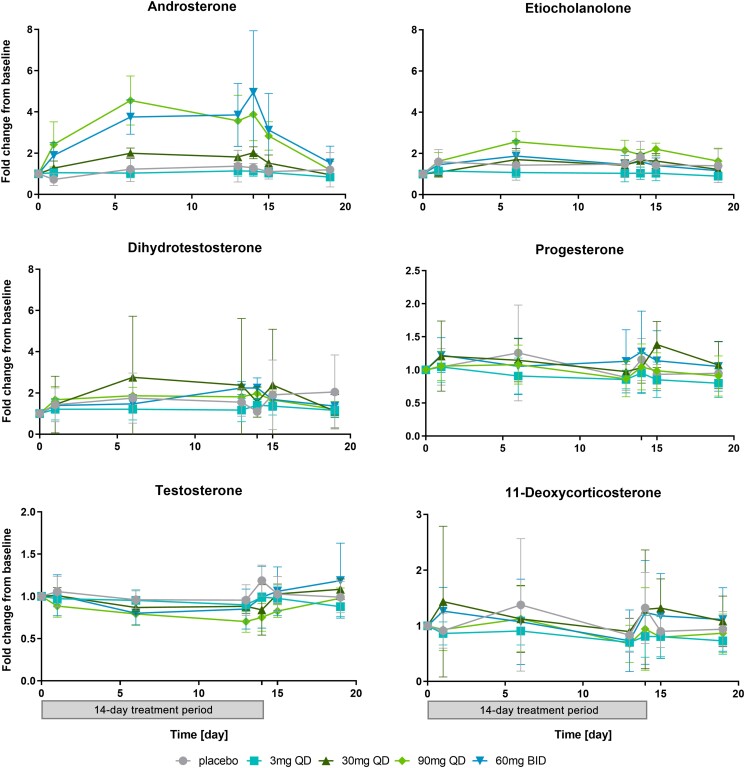
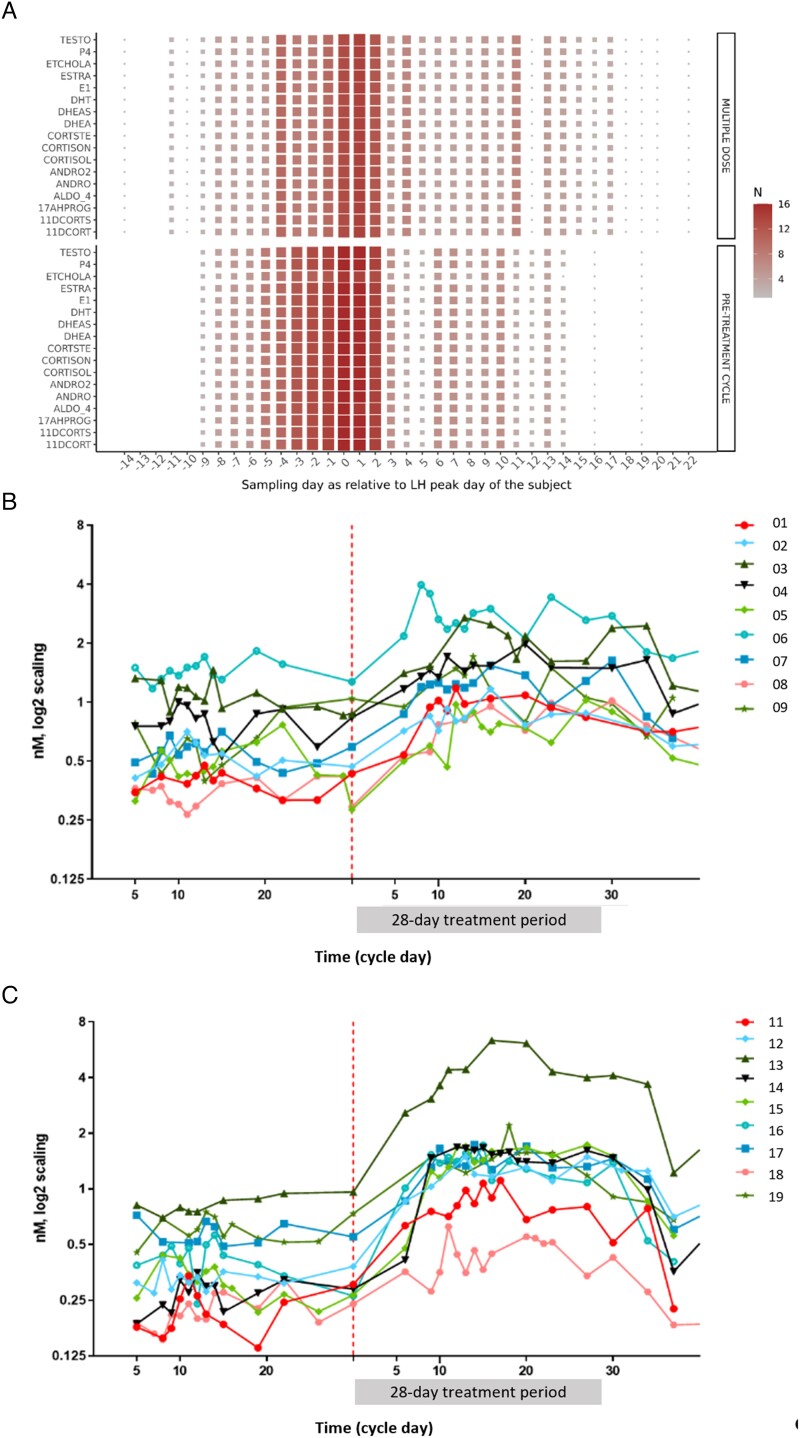
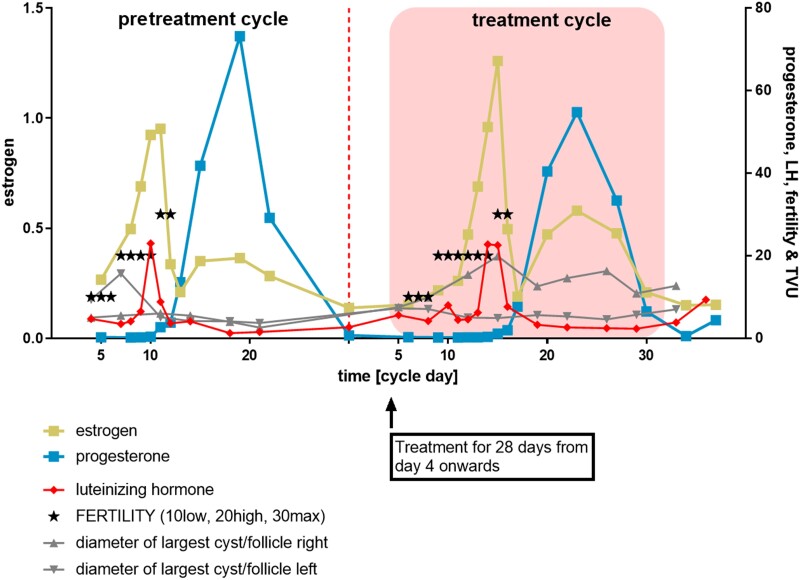
Results: In both study populations, we observed substantial, dose-dependent increases in circulating concentrations of the inactive androgen metabolite androsterone and minor increases in circulating etiocholanolone and dihydrotestosterone concentrations. In premenopausal women, androsterone concentrations increased 2.95-fold on average (95% confidence interval: 0.35-3.55) during once- or twice-daily treatment. Note, no concomitant changes in serum 17β-estradiol and progesterone were observed, and menstrual cyclicity and ovarian function were not altered by the treatment.

Conclusions: Serum androsterone was identified as a robust response biomarker for AKR1C3 inhibitor treatment in women. Aldo-keto reductase 1C3 inhibitor administration for 4 weeks did not affect ovarian function.ClinicalTrials.gov Identifier: NCT02434640; EudraCT Number: 2014-005298-36.

Keywords: androgens; androsterone; endometriosis; menstrual cycle; ovary; ovulation; polycystic ovary syndrome; randomized clinical trial; steroid metabolism.


Figures

Figure 1.
Figure 1.
Steroid metabolism pathways: Expected effects of treatment with an AKR1C3 inhibitor. (1) Progesterone is a substrate of AKR1C3 (and other enzymes); AKR1C3 (and AKR1C1) reduces progesterone to 20α-hydroxyprogesterone., Increased progesterone concentrations are expected upon treatment with an AKR1C3 inhibitor. (2) Androstenedione is a substrate of AKR1C3. Conversion to testosterone is expected to be reduced during treatment with an AKR1C3 inhibitor., (3) Estrone (E1) is a substrate of AKR1C3 (and other enzymes). A reduction in E2 concentrations and an increase in E1 concentrations are expected upon treatment with an AKR1C3 inhibitor. (4) 11-Deoxycorticosterone is inactivated by AKR1C3. This effect—which is outside the focus of this paper—is mentioned only for completeness. Orange boxes: analytes included in the AbsoluteIDQ Stero17 kit. Gray boxes: other metabolites in the pathway.
Figure 2.
Figure 2.
Study design and procedures. (A) Blood samples for PK analyses of BAY1128688 and its metabolite BAY1107202 (M-7) in plasma were collected predose and 0.25, 0.5, 1, 1.5, 2, 3, 4, 6, 8, 12, 24, 48, 72, 96, 120, 144, 192, 264, and 336 h of postdose in period 1 and—using the same sampling schedule until 192 h of postdose—on day 14 and following in period 2. Blood samples for PD analyses (steroid assay, eicosanoid assay, additional hormones, and prostaglandin metabolites within pathway) were taken at 0, 2, 4, 8, 12, 24, and 48 h after dosing on day 1 period 1 and on day 14 in period 2 and—following the same sampling schedule, also on day −1 before Period 1. Additionally, predose samples for PK and PD analyses were taken at predefined intervals in period 2. Safety monitoring included evaluation of AE reports, measurement of vital signs, electrocardiograms, and clinical laboratory tests. Independent of the three-step dose-escalation procedure (30 mg QD, 90 mg QD, and 60 mg BID), the PK of 3 mg BAY1128688 given in the form of three new 1 mg tablets was studied using the same protocol. (B) The pretreatment cycle started with the onset of menstrual bleeding and ended with the onset of the next menstrual bleeding. The treatment period started on day 4 after the onset of menstrual bleeding (cycle day 4). The duration of treatment was 28 days, irrespective of subsequent menstrual bleedings. Pretreatment cycle and treatment period could be separated by up to 2 menstrual cycles. Samples for PD analyses (steroid assay, eicosanoid assay, additional hormones, and prostaglandin metabolites within pathway, FSH, and LH) were taken at 3- to 4-day intervals on scheduled visits, on visits introduced through urinary E3G increases (high-fertility days), on the first days of menstrual bleeding before starting treatment and at the end of treatment. Samples for PK analyses of BAY1128688 and its metabolite BAY1107202 (M-7) in plasma were collected on any day between D15 and D28 of the treatment period, following the same sampling schedule as in part A of the study. BAY, BAY1128688; BID, twice daily; C…, day … of menstrual cycle; D…, d… day within cycle or period; E3G, estrone-3-glucuronide; LH, luteinizing hormone; PD, pharmacodynamic; PK, pharmacokinetic; QD, once daily; TVU, transvaginal ultrasound. *The washout between single-dose administration in period 1 and the first dose in period 2 was 14-28 days.
Figure 3.
Figure 3.
Steroid assays: Change-from-baseline versus time curves for selected analytes (means and standard deviations) (postmenopausal women, 14-day treatment period, and 5-day follow-up). The treatment history (14 days on treatment and 5-day follow-up without treatment) is depicted below the x-axes at the bottom of the picture. Changes from baseline were calculated as the ratio between the value at time X and the last value before administration of the first dose of BAY1128688 in period 2. The x-axis shows the time after the first dose in period 2 in days. For clarity, only the predose value is presented for days on which multiple samples were taken. NB: The analysis of intraday profiles did not reveal any circadian effects on steroid levels. For number of valid values per time point, see Table S2. The change-from-baseline versus time curves for estradiol and estrone are not presented here because these data sets contained too many invalid values and values below the detection limit. BID, twice daily; QD, once daily.
Figure 4.
Figure 4.
Blood sampling schedule for steroid and hormone measurements in premenopausal women (A) and individual androsterone serum concentrations before and during treatment with BAY1128688 60 mg QD (B) or BID (C). (A) The heat map shows for each steroid the quantity of observations (N) available per sampling time point relative to the LH peak. The quantity of observations is coded on a scale ranging from very few observations (small gray squares) to large number of observations (large dark red squares). The interval where the availability of observations was greatest in both cycles (day −5 to day +10 relative to the LH peak) was considered for AUC calculations. (B and C) For clarity, a log2 y-axis was used. The red dotted line indicates the first measurement in the treatment period. The numbers 1-19 represent individual study participants. 11DECORT, 11-deoxycorticosterone; 11DECORTS, 11-deoxycortisol; 17AHPROG, 17α-hydroxyprogesterone; ALDO 4, aldosterone; ANDRO2, androstenedione; ANDRO, androsterone; CORTSTE, corticosterone; CORTISOL, cortisol; CORTISON, cortisone; DHEAS, dehydroepiandrosterone; DHEA, dehydroepiandrosterone sulfate; DHT, dihydrotestosterone; ESTRA, estradiol; E1, estrone; ETCHOLA, etiocholanolone; P4, progesterone; TESTO, testosterone.
Figure 5.
Figure 5.
Exemplary individual hormone concentration (nm) and follicle size versus time curves. The above patterns of hormonal and follicle size changes indicate presence of an ovulation in an exemplary participant before treatment and on treatment with BAY1128688 60 mg BID. The asterisks refer to the ClearBlue fertility signals. Follicle diameters were determined during transvaginal ultrasound (TVU) examinations. Note: Confirmation of ovulation in the pretreatment cycle was a prerequisite for enrollment in the treatment phase.
Figure 6.
Figure 6.
Dose-normalized exposure of BAY1128688 in plasma at steady state (postmenopausal women; period 2, day 14). Box: 25th to 75th percentile; horizontal line: median; whiskers: 10th to 90th percentile; x: geometric mean. Note: Cmax/D for 60 mg BID administration is not presented because—unlike AUC—Cmax is affected by the dosing interval. AUC(0-24), area under the plasma concentration vs time curve from time 0 to 24 h postdose; BID, twice per day; Cmax, maximum observed concentration in plasma (within the dosing interval); D, dose; md, multiple dose.
Figure 7.
Figure 7.
Observed concentration-time curves (mg/dL) (A) and model-predicted concentration-time curves (µmol/L) (B and C) for total bilirubin in serum. (A) Mean bilirubin serum concentration-time curves observed in postmenopausal women during and after 14-day treatment with BAY1128688. The dashed horizontal line in indicates the ULN (1.23 mg/dL). Whiskers indicate standard deviations. The 3 mg group included five participants, the other groups seven participants each. (B) Model-predicted bilirubin serum concentration-time curves for premenopausal women taking 60 mg BAY1128688 QD. (Figure C see further below) Model-predicted bilirubin serum concentration-time curves for premenopausal women taking 60 mg BAY1128688 BID. BID, twice daily; CI, confidence interval; conc., concentration; MD, multiple dose; obs., observations; QD, once daily; sim., simulated; ULN, upper limit of normal.
Figure 7.
Figure 7.
Observed concentration-time curves (mg/dL) (A) and model-predicted concentration-time curves (µmol/L) (B and C) for total bilirubin in serum. (A) Mean bilirubin serum concentration-time curves observed in postmenopausal women during and after 14-day treatment with BAY1128688. The dashed horizontal line in indicates the ULN (1.23 mg/dL). Whiskers indicate standard deviations. The 3 mg group included five participants, the other groups seven participants each. (B) Model-predicted bilirubin serum concentration-time curves for premenopausal women taking 60 mg BAY1128688 QD. (Figure C see further below) Model-predicted bilirubin serum concentration-time curves for premenopausal women taking 60 mg BAY1128688 BID. BID, twice daily; CI, confidence interval; conc., concentration; MD, multiple dose; obs., observations; QD, once daily; sim., simulated; ULN, upper limit of normal.
Figure 8.
Figure 8.
Visual summary of main findings mapped onto steroidogenesis flowchart. Solid arrows: major conversion steps; dotted and dashed arrows: minor conversion steps. The different pathways of steroid genesis are highlighted by different shades of blue (classic pathway in dark blue; alternative/backdoor pathway in violet blue; 11-oxygenated androgen pathway in light blue). AKR1C3, aldo-keto reductase 1C3; CYP11B1, cytochrome P450 11B1; SRD5A, 5α-reductases.

References

    1. Tamae D, Mostaghel E, Montgomery B, et al. The DHEA-sulfate depot following P450c17 inhibition supports the case for AKR1C3 inhibition in high risk localized and advanced castration resistant prostate cancer. Chem Biol Interact. 2015;234:332–338. 10.1016/j.cbi.2014.12.012 - DOI - PMC - PubMed
    1. O'Reilly MW, Kempegowda P, Walsh M, et al. AKR1C3-mediated adipose androgen generation drives lipotoxicity in women with polycystic ovary syndrome. J Clin Endocrinol Metab. 2017;102(9):3327–3339. 10.1210/jc.2017-00947 - DOI - PMC - PubMed
    1. Matsuura K, Shiraishi H, Hara A, et al. Identification of a principal mRNA species for human 3alpha-hydroxysteroid dehydrogenase isoform (AKR1C3) that exhibits high prostaglandin D2 11-ketoreductase activity. J Biochem. 1998;124(5):940–946. 10.1093/oxfordjournals.jbchem.a022211 - DOI - PubMed
    1. Desmond JC, Mountford JC, Drayson MT, et al. The aldo-keto reductase AKR1C3 is a novel suppressor of cell differentiation that provides a plausible target for the non-cyclooxygenase-dependent antineoplastic actions of nonsteroidal anti-inflammatory drugs. Cancer Res. 2003;63(2):505–512. - PubMed
    1. Rakhila H, Carli C, Daris M, Lemyre M, Leboeuf M, Akoum A. Identification of multiple and distinct defects in prostaglandin biosynthetic pathways in eutopic and ectopic endometrium of women with endometriosis. Fertil Steril. 2013;100(6):1650–9.e1-2. 10.1016/j.fertnstert.2013.08.016 - DOI - PubMed

Publication types

Associated data