. 2023 Sep 1;35(9):3544-3565.
doi: 10.1093/plcell/koad162.

Acetylation of inorganic pyrophosphatase by S-RNase signaling induces pollen tube tip swelling by repressing pectin methylesterase

Affiliations

Acetylation of inorganic pyrophosphatase by S-RNase signaling induces pollen tube tip swelling by repressing pectin methylesterase

Chao Tang et al. Plant Cell. .

Abstract

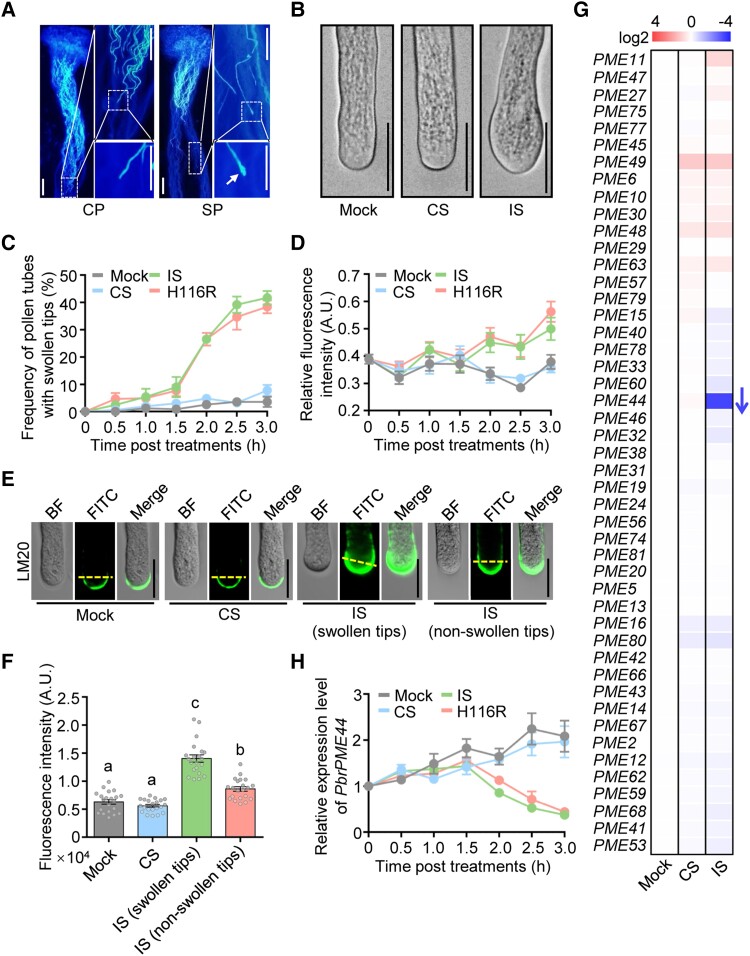
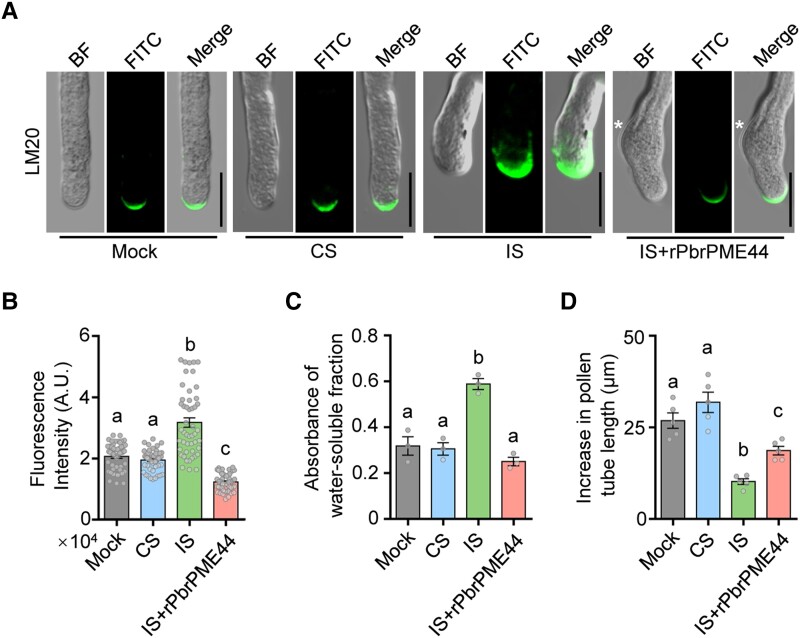
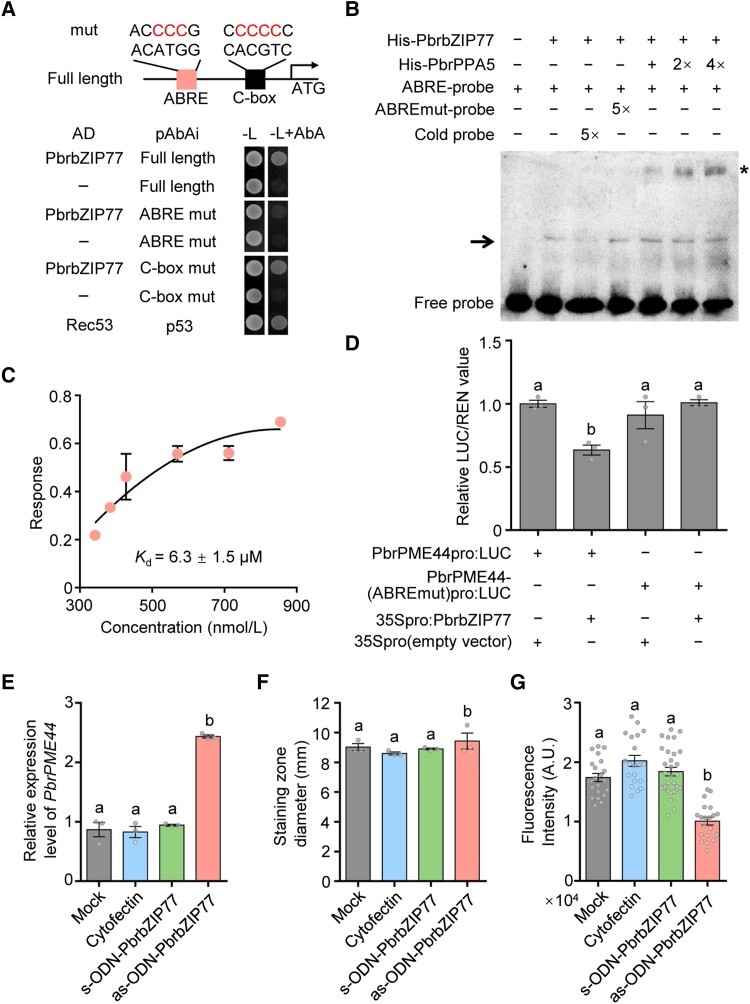
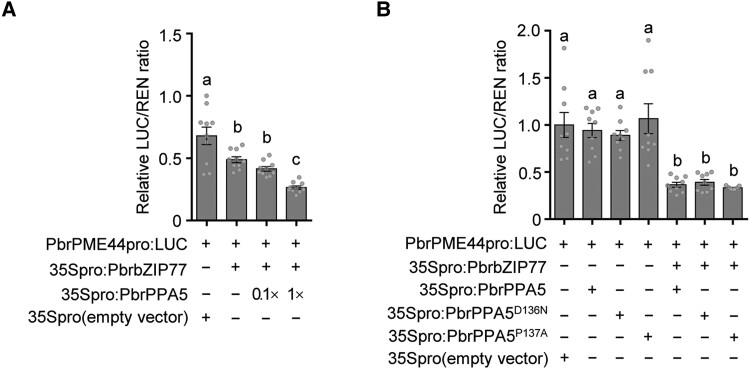
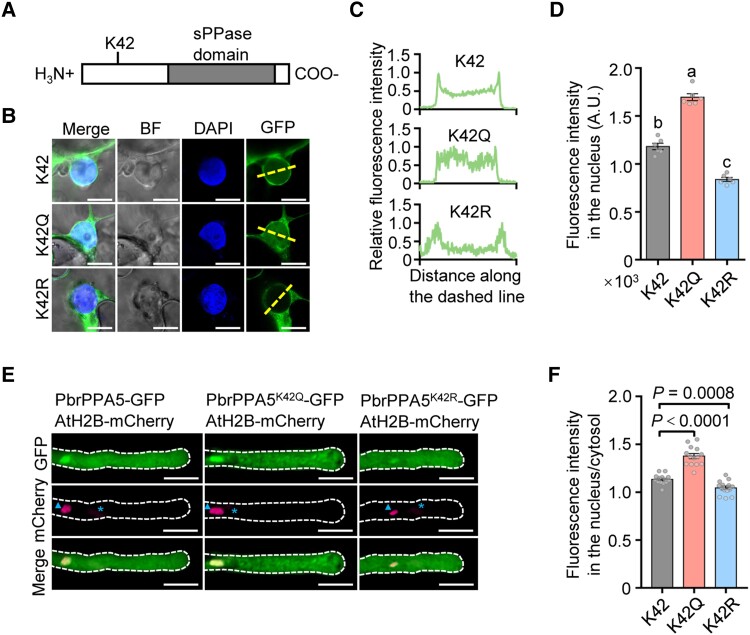
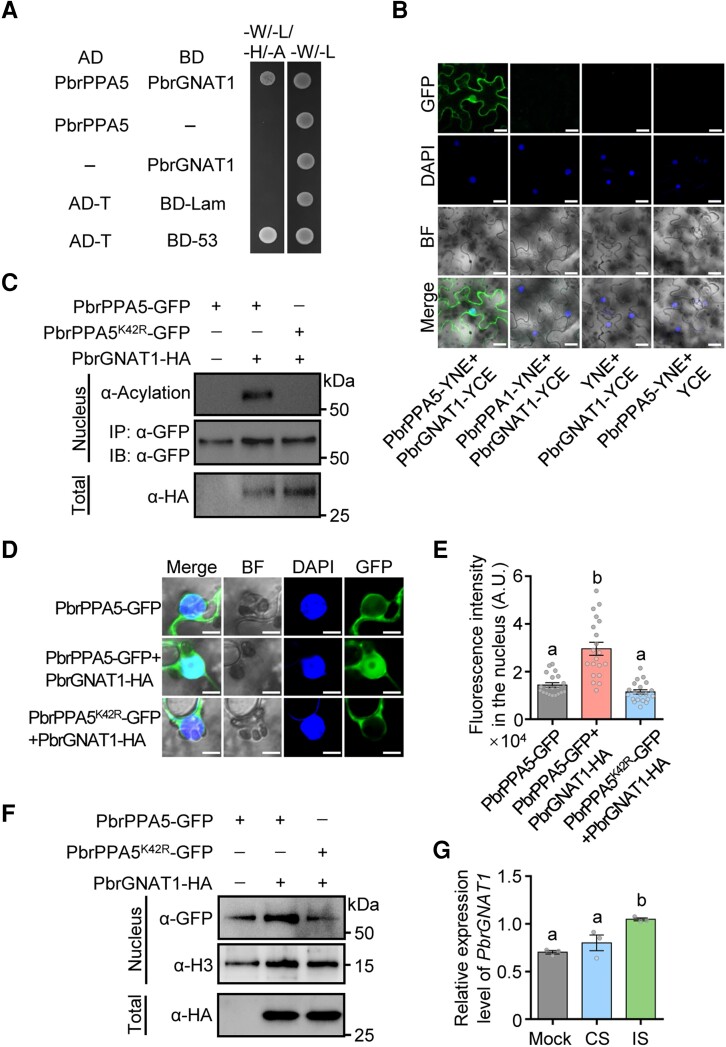
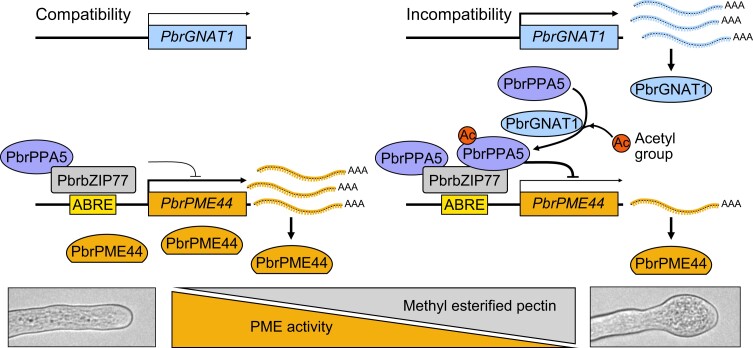
Self-incompatibility (SI) is a widespread genetically determined system in flowering plants that prevents self-fertilization to promote gene flow and limit inbreeding. S-RNase-based SI is characterized by the arrest of pollen tube growth through the pistil. Arrested pollen tubes show disrupted polarized growth and swollen tips, but the underlying molecular mechanism is largely unknown. Here, we demonstrate that the swelling at the tips of incompatible pollen tubes in pear (Pyrus bretschneideri [Pbr]) is mediated by the SI-induced acetylation of the soluble inorganic pyrophosphatase (PPA) PbrPPA5. Acetylation at Lys-42 of PbrPPA5 by the acetyltransferase GCN5-related N-acetyltransferase 1 (GNAT1) drives accumulation of PbrPPA5 in the nucleus, where it binds to the transcription factor PbrbZIP77, forming a transcriptional repression complex that inhibits the expression of the pectin methylesterase (PME) gene PbrPME44. The function of PbrPPA5 as a transcriptional repressor does not require its PPA activity. Downregulating PbrPME44 resulted in increased levels of methyl-esterified pectins in growing pollen tubes, leading to swelling at their tips. These observations suggest a mechanism for PbrPPA5-driven swelling at the tips of pollen tubes during the SI response. The targets of PbrPPA5 include genes encoding cell wall-modifying enzymes, which are essential for building a continuous sustainable mechanical structure for pollen tube growth.


Conflict of interest statement

Conflict of interest statement. None declared.

Figures

Figure 1.
Figure 1.
PbrS-RNase induces swelling at the tips of pollen tubes and suppresses PbrPME44 expression during the self-incompatibility response. A) Aniline blue staining of P. bretschneideri cv. Dangshansuli pistils 48 h after pollination with P. bretschneideri cv. Huanghua pollen (CP; compatible) and Dangshansuli pollen (SP; incompatible). Insets showing high-magnification views of the boxed areas are shown on the right. The SP tubes in SP had swollen tips (indicated by arrow). Scale bars, 100 μm. B) His-tagged rPbrS-RNases induce the swelling of SI pollen tubes in vitro after a 2.5-h treatment. Mock, liquid germination medium; CS, compatible rPbrS-RNase; IS, incompatible rPbrS-RNase. Scale bars, 20 μm. C) Time course analysis of the frequency of pollen tubes with swollen tips under mock, CS, IS, and H116R mutation treatments. H116R, incompatible rPbrS-RNases (rPbrS7-RNaseH116R + rPbrS34-RNaseH116R). Data are means ± SEM, n ≥ 30 pollen tubes. D) Quantitative analysis of the time course of fluorescence intensity of the LM20 antibody at the apical region (the area within 5 μm from the tip to the shank) of pollen tubes under mock, CS, IS, and H116R mutation treatments. Data are means ± SEM, n = 20 pollen tubes. E) rPbrS-RNases induce an increase in the level of methyl-esterified pectin in pollen tubes 2 h after mock, CS, and IS treatments regardless of whether the tips were swollen. Methyl-esterified pectins in the pollen tube were immunolabeled with LM20. BF, brightfield image; FITC, antirat IgG-FITC antibody. Scale bars, 20 μm. F) Quantitative analysis of the fluorescence intensity of LM20 at the apical regions of pollen tubes 2.0 h after mock, CS, and IS treatments. Data are means ± SEM, n ≥ 20 pollen tubes. G) Relative expression levels of 47 pollen-expressed PbrPME genes (Supplemental Table S2) 2.5 h after mock, CS, and IS treatments using the in vitro pollen culture system. Relative expression levels were normalized to that under mock treatment. The arrow indicates the only gene that was downregulated (fold change > 2). PbrTUB-2 was used as the reference gene. Data are means ± SEM, n = 3 biological replicates. H) Time course analysis of the expression levels of PbrPME44 in pollen tubes under mock, CS, IS, and H116R mutation treatments in vitro. For these treatments, pollen tubes (Dangshansuli; S7 or S34) were precultured in liquid germination medium for 1.5 h. PbrTUB-2 was used as the reference gene for normalization. Data are means ± SEM, n = 7 biological replicates. Statistical analysis results for all figures and supplemental figures are presented in Supplemental Data Set 4.
Figure 2.
Figure 2.
PbrPME44 alleviates the PbrS-RNase–induced increase in methyl-esterified pectin levels. A) Methyl-esterified pectins in the pollen tube were immunolabeled with the LM20 antibody 2 h after mock, CS, IS, and IS plus His-tagged rPbrPME44 protein treatments. For PME compensation experiments, pollen tubes were treated with rPbrS-RNases for 2 h, followed by the addition of rPbrPME44 and incubation for 1 h. The asterisks indicate the positions of swelling. Mock, liquid germination medium; CS, compatible rPbrS-RNase; IS, incompatible rPbrS-RNase; BF, brightfield image; FITC, antirat IgG-FITC antibody. Scale bars, 20 μm. B) Quantitative analysis of the fluorescence intensity of LM20 at the apical regions of the pollen tubes from A). Different lowercase letters indicate significant differences, as determined by ANOVA followed by Tukey's multiple comparison test (P < 0.05, n = 49 pollen tubes). Data are means ± SEM. C) Quantification of levels of methyl-esterified pectins (using ELISA) in alcohol-insoluble residues extracted from pollen tubes under the treatments indicated in A). Water was used as the elution buffer. The LM20 monoclonal antibody was used to detect methyl-esterified pectins. Different lowercase letters indicate significant differences as determined by ANOVA followed by Tukey's multiple comparison test (P < 0.05, n = 3 biological replicates). Data are means ± SEM. D) Quantitative analysis of the increase in pollen tube length under the indicated treatments in A). Five biological replicates were performed, with each replicate containing at least 30 pollen tubes. Different lowercase letters indicate significant differences, as determined by ANOVA followed by Tukey's multiple comparison test (P < 0.05). Data are means ± SEM.
Figure 3.
Figure 3.
PbrbZIP77 suppresses PbrPME44 expression by binding to the ABRE in its promoter. A) Y1H assays showing that the ABRE motif is essential for the binding of PbrbZIP77 to the PbrPME44 promoter. The 1,300-bp sequence upstream of the start codon of PbrPME44 was cloned into pAbAi as described in Materials and methods. The left box represents the ABA-responsive element (ACATGG) or its mutated form (ACCCCG). The right box represents the C-box element (CACGTC) or its mutated form (CCCCCC). B) Binding of His-tagged rPbrbZIP77 to the ABRE of the PbrPME44 promoter region and a supershift EMSA of the PbrPPA5–PbrbZIP77 complex. The 30-bp PbrPME44 promoter fragment containing the ABRE was labeled with biotin and used as a probe. − represents absence; + represents presence; the arrow indicates the shifted band; and the asterisk indicates the supershifted band. C) Quantification of the interaction between PbrbZIP77 and the 30-bp PbrPME44 promoter fragment containing the ABRE using a BLI assay. Three technical replicates were performed. D) PbrbZIP77-repressed PbrPME44 promoter activity depends on the ABRE in a dual-LUC assay. The empty vector (35Spro) served as a negative control, and the LUC/REN ratio of 35Spro was set to 1. − represents absence and + represents presence. Different lowercase letters indicate significant differences, as determined by ANOVA followed by Tukey's multiple comparison test (P < 0.05, n = 3 biological replicates). Data represent the means ± SEM. E)PbrPME44 is upregulated in pollen tubes 2 h after treatment with as-ODN-PbrbZIP77. Cytofectin (Lipofectamine 2000) was used as the transfection reagent. The sense oligodeoxynucleotide-PbrbZIP77 (s-ODN-PbrbZIP77) was used as the negative control. Mock, liquid germination medium. Different lowercase letters indicate significant differences, as determined by ANOVA followed by Tukey's multiple comparison test (P < 0.05, n = 3 biological replicates). Data are means ± SEM. F) Analysis of total PME activity by ruthenium red staining under mock, cytofectin, s-ODN-PbrbZIP1, and as-ODN-PbrbZIP1 treatments. The diameters of the stained zones were measured with calipers. Different lowercase letters indicate significant differences, as determined by ANOVA followed by Tukey's multiple comparison test (P < 0.05, n = 3 biological replicates). Data are means ± SEM. G) Quantitative analysis of the fluorescence intensity of LM20 at the apical regions of pollen tubes under mock, cytofectin, s-ODN-PbrbZIP1, and as-ODN-PbrbZIP1 treatments. Different lowercase letters indicate significant differences, as determined by ANOVA followed by Tukey's multiple comparison test (P < 0.05, n ≥ 20 pollen tubes). Data are means ± SEM.
Figure 4.
Figure 4.
PbrPPA5 interacts with PbrbZIP77 in vitro and in vivo. A) Y2H assay of the interaction between PbrPPA5 (activation domain, AD) and PbrbZIP77 (binding domain, BD). Coexpression of pGBKT7-P53 and pGADT7-T was used as a positive control and that of pGBKT7-Lam and pGADT7-T as a negative control. Interactions were determined based on growth on synthetic-defined (SD)/–W–L–H–A (–Ade–Leu–Trp–His) medium. B) BiFC assays of the interaction between PbrbZIP77 and PbrPPA5 constructs in N. benthamiana leaves. Vectors YNE and YCE contain the N-terminal and C-terminal fragments of YFP, respectively. Scale bars, 20 μm. C) LCI assay of the interaction between PbrbZIP77 and PbrPPA5 in N. benthamiana leaves. NLuc and Cluc are vectors containing the N-terminal and C-terminal fragments of firefly LUC, respectively. Coinfiltration of 35Spro:NLuc and 35Spro:Cluc was used as a negative control. D) Binding affinity assay showing the interaction kinetics (as indicated by Kd values) between His-tagged rPbrPPA5 and His-PbrbZIP77, as measured by MST analysis.
Figure 5.
Figure 5.
PbrPPA5 enhances PbrbZIP77-mediated suppression of PbrPME44 expression. A) PbrPPA5 promotes the PbrbZIP77-mediated suppression of PbrPME44 expression in a concentration-dependent manner, as measured in a dual-LUC assay. The empty vector (35Spro) served as a negative control, and the LUC/REN ratio of 35Spro was set to 1. The effector constructs consisted of the PbrbZIP77 or PbrPPA5 coding sequences driven by the 35S promoter; PbrPME44pro:LUC was used as the reporter construct. − represents absence, and + represents presence. Different lowercase letters indicate significant differences, as determined by ANOVA followed by Tukey's multiple comparison test (P < 0.05, n = 10 biological replicates). Data are means ± SEM. B) The cosuppressor activity of PbrPPA5 for PbrPME44 expression is independent of its sPPase activity. Dual-LUC assays were performed using N. benthamiana leaves coinfiltrated with the reporter construct PbrPME44pro:LUC and the effector constructs 35Spro:PbrbZIP77, 35Spro:PbrPPA5, 35Spro:PbrPPA5D136N, 35Spro:PbrPPA5P137A, and 35Spro (empty vector), as indicated. − represents absence and + represents presence. Different lowercase letters indicate significant differences, as determined by ANOVA followed by Tukey's multiple comparison test (P < 0.05, n = 9 biological replicates). Data are means ± SEM.
Figure 6.
Figure 6.
Acetylation of the K42 residue in PbrPPA5 promotes accumulation of PbrPPA5 in the nucleus. A) Structure of PbrPPA5 with the sPPase domain indicated. K42, the Lys residue at position 42 in the N-terminal region of PbrPPA5. B) Acetylation of the K42 residue in PbrPPA5 promotes its accumulation in the nucleus. Substitution of the K42 residue with a charge-conservative (positively charged) Arg residue (R) or an uncharged Glu residue (Q) mimics a nonacetylated or constitutively acetylated state, respectively. PbrPPA5-GFP (K42), PbrPPA5K42Q-GFP (K42Q), and PbrPPA5K42R-GFP (K42R) were transiently expressed in N. benthamiana leaves and observed under a confocal microscope. GFP signals represent the localizaiton of PbrPPA5 isoforms; DAPI was used as the nucleus marker. The dashed lines represent the positions used to measure fluorescence intensity. Scale bars, 10 μm. C) Quantitative analysis of the relative fluorescence intensity of GFP in the last column in B). Fluorescence intensity of PbrPPA5-GFP was measured using ZEN software in the area across the dashed line crossing the nucleus. The values on the x axis represent the distance along the dashed lines. The values on the y axis represent the fluorescence intensity of PbrPPA5-GFP. D) Quantitative analysis of the fluorescence intensity of PbrPPA5-GFP in the nucleus. Different lowercase letters indicate significant differences, as determined by ANOVA followed by Tukey's multiple comparison test (P < 0.05, n = 6 leaf cells). Data are means ± SEM. E) Images of the subcellular localization of PbrPPA5 and its mutant forms in pear pollen tubes. The expression of PbrPPA5-GFP, PbrPPA5K42Q-GFP, PbrPPA5K42R-GFP, and AtH2B-mCherry was driven by the NTP303 promoter. PbrPPA5-GFP, PbrPPA5K42Q-GFP, and PbrPPA5K42R-GFP were transiently coexpressed with AtH2B-mCherry in pear pollen tubes by particle bombardment. The pollen was cultured for 4 h after transformation. The asterisk represents the vegetative nucleus and the triangle represents the generative nucleus. Scale bars, 20 μm. F) Quantitative analysis of the ratio of fluorescence intensity in the nucleus/cytosol for PbrPPA5-GFP, PbrPPA5K42Q-GFP, and PbrPPA5K42R-GFP in the nuclei of pollen tubes from E). P-values were obtained by Student's t test. Data are means ± SEM; n = 10 pollen tubes.
Figure 7.
Figure 7.
PbrGNAT1 acetylates PbrPPA5 and promotes its nuclear accumulation. A) Y2H assay of the interactions between PbrPPA5 (activation domain, AD) and PbrGNAT1 (binding domain, BD). Coexpression of pGBKT7-P53 and pGADT7-T was used as a positive control and that of pGBKT7-Lam and pGADT7-T as a negative control. Interactions were determined based on growth on SD/–W–L–H–A (–Ade–Leu–Trp–His) medium. B) BiFC assays of the interaction between PbrPPA5 and PbrGNAT1 in N. benthamiana leaves. Vectors YNE and YCE contain the N-terminal and C-terminal fragments of YFP, respectively. Scale bars, 20 μm. C) PbrGNAT1 acetylates the K42 residue of PbrPPA5 in vivo. Substitution of K42 with a charge-conservative Arg residue (R) mimics a nonacetylated state. PbrGNAT1-HA with PbrPPA5-GFP or PbrPPA5K42R-GFP was transiently coexpressed in N. benthamiana leaves. Nuclear proteins were extracted and immunoprecipitated with magnetic beads containing α-GFP antibody. The protein extracts were immunoblotted with an α-acetylation antibody. The abundance of PbrGNAT1-HA, PbrPPA5-GFP, and PbrPPA5K42R-GFP was verified using an α-HA antibody and an α-GFP antibody, respectively. α-GFP was used as the loading control for nuclear proteins. D) Coexpression of PbrGNAT1 and PbrPPA5 promotes the accumulation of PbrPPA5 in the nucleus. PbrGNAT1-HA with PbrPPA5-GFP or PbrPPA5K42R-GFP was transiently expressed in N. benthamiana leaves. The fluorescence of their encoded proteins was observed under a confocal microscope. GFP signals represent the localizaiton of PbrPPA5 isoforms; DAPI was used as the nucleus marker. Scale bars, 10 μm. E) Quantitative analysis of the fluorescence intensity in the nucleus of PbrPPA5-GFP from D). Different lowercase letters indicate significant differences, as determined by ANOVA followed by Tukey's multiple comparison test (P < 0.05, n = 20 leaf cells). Data represent means ± SEM. F) Immunoblot analysis of PbrPPA5 in the nucleus from transiently infiltrated N. benthamiana leaves with or without coexpression of PbrGNAT1-HA. PbrPPA5-GFP and PbrPPA5K42R-GFP were detected using an α-GFP antibody, and an α-H3 antibody was used as the loading control for nuclear proteins. The expression of PbrGNAT1-HA in total leave protein was detected using an α-HA antibody. G) The expression levels of PbrGNAT1 in pollen tubes under 1 h mock, CS, and IS treatments in vitro. Mock, liquid germination medium; CS, compatible rPbrS-RNase; IS, incompatible rPbrS-RNase. PbrTUB-2 was used as the reference gene for normalization. Different lowercase letters indicate significant differences, as determined by ANOVA followed by Tukey's multiple comparison test (P < 0.05, n = 3 biological replicates). Data are means ± SEM.
Figure 8.
Figure 8.
SI induces PbrPPA5 accumulation in the nucleus. A) Immunoblot analysis showing that 1.5 h of IS treatment induces PbrPPA5 accumulation in the nucleus. Nucleus/cytosolic soluble fractions were isolated from pear pollen. α-H3.3 and α-GAPDH antibodies were used as the loading controls for nuclear and cytoplasmic proteins, respectively. Mock, liquid germination medium; CS, compatible rPbrS-RNase; IS, incompatible rPbrS-RNase. B) Images of the SI-induced PbrPPA5 accumulation in the nuclei of pollen tubes 1.5 h after IS treatment. The expression of PbrPPA5-GFP and AtH2B-mCherry was driven by the NTP303 promoter, and PbrPPA5-GFP and AtH2B-mCherry were transiently coexpressed in pear pollen tubes by particle bombardment. The transformed pear pollen was cultured for 3 h and then treated for 1.5 h with mock, CS, and IS treatments. The asterisks represent the vegetative nuclei and the triangles represent the generative nuclei. Scale bars, 20 μm. C) Quantitative analysis of the ratio of fluorescence intensity of PbrPPA5-GFP in the nucleus/cytosol in the nuclei of pollen tubes from B). Different lowercase letters indicate significant differences, as determined by ANOVA followed by Tukey's multiple comparison test (P < 0.05, n ≥ 12 pollen tubes). Data are means ± SEM.
Figure 9.
Figure 9.
A working model for the role of PbrPPA5 in tip swelling of pear pollen tubes under SI challenge. In growing pollen tubes, PbrPPA5 interacts with PbrbZIP77, and the PbrPPA5–PbrbZIP77 complex suppresses the expression of PbrPME44 by binding to the ABRE in its promoter to maintain the balance between methyl-esterified and deesterified pectin levels in pollen tubes. During the SI response, the expression level of PbrGNAT1 increases, and PbrGNAT1 acetylates PbrPPA5, inducing the accumulation of PbrPPA5 in the nucleus. PbrPPA5 in the nucleus binds to PbrbZIP77 to enhance the repression of PbrPME44. The downregulation of PbrPME44 leads to an increase in methyl-esterified pectin levels in the pollen tube cell wall, resulting in swelling at the tips of pollen tubes.

Comment in

References

    1. Anderson MA, Cornish EC, Mau S-L, Williams EG, Hoggart R, Atkinson A, Bonig I, Grego B, Simpson R, Roche PJ, et al. . Cloning of cDNA for a stylar glycoprotein associated with expression of self-incompatibility in Nicotiana alata. Nature 1986:321(6065):38–44. 10.1038/321038a0 - DOI
    1. Baeza J, Smallegan MJ, Denu JM. Mechanisms and dynamics of protein acetylation in mitochondria. Trends Biochem Sci. 2016:41(3):231–244. 10.1016/j.tibs.2015.12.006 - DOI - PMC - PubMed
    1. Bosch M, Cheung AY, Hepler PK. Pectin methylesterase, a regulator of pollen tube growth. Plant Physiol. 2005:138(3):1334–1346. 10.1104/pp.105.059865 - DOI - PMC - PubMed
    1. Bosch M, Franklin-Tong VE. Temporal and spatial activation of caspase-like enzymes induced by self-incompatibility in Papaver pollen. Proc Natl Acad Sci U S A. 2007:104(46):18327–18332. 10.1073/pnas.0705826104 - DOI - PMC - PubMed
    1. Bosch M, Hepler PK. Pectin methylesterases and pectin dynamics in pollen tubes. Plant Cell 2005:17(12):3219–3226. 10.1105/tpc.105.037473 - DOI - PMC - PubMed

Publication types