. 2023 Jul 25;205(7):e0007523.
doi: 10.1128/jb.00075-23. Epub 2023 Jun 12.

Genetic Analysis Reveals a Requirement for the Hybrid Sensor Kinase RscS in para-Aminobenzoic Acid/Calcium-Induced Biofilm Formation by Vibrio fischeri

Affiliations

Genetic Analysis Reveals a Requirement for the Hybrid Sensor Kinase RscS in para-Aminobenzoic Acid/Calcium-Induced Biofilm Formation by Vibrio fischeri

Courtney N Dial et al. J Bacteriol. .

Abstract

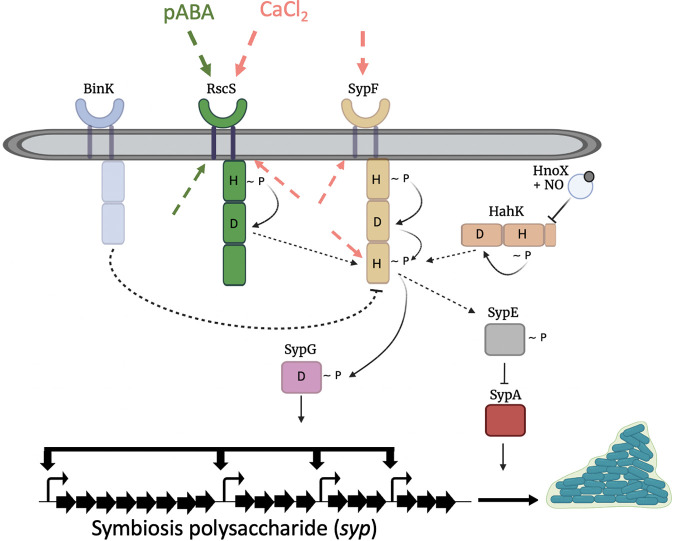
The marine bacterium Vibrio fischeri initiates symbiotic colonization of its squid host, Euprymna scolopes, by forming and dispersing from a biofilm dependent on the symbiosis polysaccharide locus (syp). Historically, genetic manipulation of V. fischeri was needed to visualize syp-dependent biofilm formation in vitro, but recently, we discovered that the combination of two small molecules, para-aminobenzoic acid (pABA) and calcium, was sufficient to induce wild-type strain ES114 to form biofilms. Here, we determined that these syp-dependent biofilms were reliant on the positive syp regulator RscS, since the loss of this sensor kinase abrogated biofilm formation and syp transcription. These results were of particular note because loss of RscS, a key colonization factor, exerts little to no effect on biofilm formation under other genetic and medium conditions. The biofilm defect could be complemented by wild-type RscS and by an RscS chimera that contains the N-terminal domains of RscS fused to the C-terminal HPT domain of SypF, the downstream sensor kinase. It could not be complemented by derivatives that lacked the periplasmic sensory domain or contained a mutation in the conserved site of phosphorylation, H412, suggesting that these cues promote signaling through RscS. Lastly, pABA and/or calcium was able to induce biofilm formation when rscS was introduced into a heterologous system. Taken together, these data suggest that RscS is responsible for recognizing pABA and calcium, or downstream consequences of those cues, to induce biofilm formation. This study thus provides insight into signals and regulators that promote biofilm formation by V. fischeri. IMPORTANCE Bacterial biofilms are common in a variety of environments. Infectious biofilms formed in the human body are notoriously hard to treat due to a biofilm's intrinsic resistance to antibiotics. Bacteria must integrate signals from the environment to build and sustain a biofilm and often use sensor kinases that sense an external signal, which triggers a signaling cascade to elicit a response. However, identifying the signals that kinases sense remains a challenging area of investigation. Here, we determine that a hybrid sensor kinase, RscS, is crucial for Vibrio fischeri to recognize para-aminobenzoic acid and calcium as cues to induce biofilm formation. This study thus advances our understanding of the signal transduction pathways leading to biofilm formation.

Keywords: RscS; Vibrio fischeri; biofilms; calcium signaling; pABA; sensor kinase; signal transduction.


Conflict of interest statement

The authors declare no conflict of interest.

Figures

FIG 1
FIG 1
Model of biofilm regulation in V. fischeri. Many two-component regulators positively and negatively regulate biofilm formation through control of syp transcription and eventual SYP production. Our current evidence suggests that the hybrid sensor kinase, RscS, responds to pABA or a downstream effector, in the presence of calcium, to promote biofilm formation. The green and pink dashed arrows represent potential sensory regions for recognizing pABA and calcium (or their downstream consequences), respectively, including the periplasmic loop region and PAS domain (not shown) of RscS and the periplasmic loop region, HAMP domain (not shown), and HPT domain of SypF. These cues appear to promote an RscS-dependent phosphorelay that drives the activation of the response regulator SypG via the HPT domain of the sensor kinase SypF. Another hybrid sensor kinase, HahK, also functions upstream of SypF’s HPT domain to promote biofilm formation. There are also three negative regulators: HnoX, BinK, and SypE. HnoX, a nitric oxide-binding protein, inhibits biofilm formation by controlling HahK activity and thus syp transcription. BinK, a hybrid sensor kinase, is a strong negative regulator of syp transcription that may remove phosphoryl groups from SypF. Finally, the response regulator SypE controls biofilm formation posttranscriptionally by inhibiting the activity of the positive regulator SypA. For simplicity, monomer forms of the proteins are shown. This figure was exported under a paid subscription. Image created with BioRender.com.
FIG 2
FIG 2
The HPT domain of SypF is necessary and sufficient for biofilm formation in TBS containing pABA and Ca2+. (A) Colony biofilm formation was evaluated following growth on tTBS with pABA and calcium (TPC) of the following strains: WT ES114, the ΔsypG mutant (KV1787), the sypG complement (KV6475), the ΔsypF mutant (KV5367), the sypF complement (KV6659), and the sypF mutant complemented with only the SypF HPT domain (KV7226). Pictures were taken using the Zeiss Stemi 2000-c microscope with ×6.5 magnification at 72 h before and after disruption using a toothpick. Pictures are representative of three separate experiments. Arrows indicate where “pulling,” indicating cohesion, was observed. Dotted arrows represent where “pulling” was observed but to a lesser extent, with portions of the colony breaking off during disruption. (B) Biofilm cohesion was quantified from images as described in Materials and Methods with scores of 1 assigned to a null phenotype and 4 to the most biofilm formation/the strongest phenotypes (most/strongest). Statistics for panel B were performed via a one-way ANOVA using Tukey’s multiple-comparison test, where biofilm strength was the dependent variable. *, P = 0.0210; **, P = 0.0017; ****, P < 0.0001. (C) sypA promoter activity (Miller units) was measured using a PsypA-lacZ reporter present in the parent (KV8079) and ΔsypG and ΔsypF derivatives (KV10307 and KV10317, respectively) following subculture for 22 h in tTBS (T), tTBS+calcium (TC), tTBS+pABA (TP), and tTBS+pABA/calcium (TPC). Statistics for panel C were performed via a two-way ANOVA using Tukey’s multiple-comparison test, where Miller units was the dependent variable. ****, P < 0.0001.
FIG 3
FIG 3
HahK and HnoX are not required for pABA/calcium induced biofilms. (A) Colony biofilm formation was evaluated following growth on TPC of the following strains: WT (ES114), ΔhahK (KV7964), ΔhnoX (KV8025), and ΔhahK ΔhnoX (KV8484) strains. (B) Colony biofilm formation was evaluated following growth on TPC of the following strains: ΔsypF+sypF-hpt (KV7226) (same image as Fig. 2A), ΔhahK ΔsypF+sypF-hpt (KV9968), and ΔhnoX ΔsypF+sypF-hpt (KV10226). The data in this panel were obtained at the same time as those in Fig. 2A, and the ΔsypF+sypF-hpt is repeated here to facilitate comparisons across figures. Pictures were taken using the Zeiss Stemi 2000-c microscope (×6.5 magnification) at 72 h before and after disruption using a toothpick. Pictures are representative of three separate experiments. Arrows indicate where “pulling,” indicating cohesion, was observed. Dotted arrows represent where “pulling” was observed but to a lesser extent, with portions of the colony breaking off during disruption. (C) Biofilm cohesion was quantified from images as described in Materials and Methods with scores of 1 assigned to a null phenotype and 4 to the most/strongest. Statistics for panel C were performed via a one-way ANOVA using Tukey’s multiple-comparison test, where biofilm strength was the dependent variable. No significance was reached.
FIG 4
FIG 4
RscS is required for the induction of syp transcription. sypA promoter activity (Miller units) was measured using a PsypA-lacZ reporter fusion in the parent strain (KV8079) or ΔrscS or ΔhahK derivatives (KV9653 and KV10304, respectively) following subculture for 22 h in tTBS (T), TC, TP, and TPC. Statistics were performed via a two-way ANOVA using Tukey’s multiple-comparison test, where Miller unit(s) was the dependent variable. ****, P < 0.0001.
FIG 5
FIG 5
RscS is critical for pABA-stimulated ES114 biofilms. (A) Colony biofilm formation was evaluated following growth on TPC of the following strains: WT (ES114), ΔrscS (KV10130), ΔrscS+rscS (KV10166), ΔsypF+sypF-hpt (KV7226), and ΔrscS ΔsypF+sypF-hpt (KV9953). Pictures were taken using a Zeiss Stemi 2000-c microscope with ×6.5 magnification at 72 h before and after disruption using a toothpick. Pictures are representative of three separate experiments. Arrows indicate where “pulling,” indicating cohesion, was observed. Dotted arrows represent where “pulling” was observed but to a lesser extent, with portions of the colony breaking off during disruption. (B) Colony biofilm formation was evaluated following growth on TPC of the following strains: sypG-D53E (sypG*; KV6527), ΔrscS+sypG* (KV10391), ΔsypE+sypG* (KV10444), and ΔrscS ΔsypE+sypG* (KV10442). Pictures were taken using the Zeiss Stemi 2000-c microscope with ×6.5 magnification at 72 h before and after disruption using a toothpick. Pictures are representative of 3 separate experiments. Arrows indicate where “pulling,” indicating cohesion, was observed. Dotted arrows represent where “pulling” was observed but to a lesser extent, with portions of the colony breaking off during disruption. For both sypG* ΔsypE derivatives (with or without an intact rscS), the colony biofilms were adherent to the plate and were not perturbable using the toothpick assay. (C) Biofilm cohesion was quantified from images as described in Materials and Methods with scores of 1 assigned to a null phenotype and 4 to the most/strongest. Statistics for panel C were performed via a one-way ANOVA using Tukey’s multiple-comparison test, where biofilm strength was the dependent variable. **, P < 0.0094; ***, P = 0.0003; ****, P < 0.0001.
FIG 6
FIG 6
Multicopy expression of rscS induces biofilm formation on medium containing pABA/calcium. (A) Colony biofilm formation was assessed following growth on tTBS (T), TC, TP, and TPC of the following strains: ES114/pKV69 (vector control) and ES114/pLMS33 (wild-type rscS on a plasmid; pRscS). Pictures were taken using the Zeiss Stemi 2000-c microscope (×6.5 magnification) at 72 h before and after disruption using a toothpick. Pictures are representative of three separate experiments. Arrows indicate where “pulling,” indicating cohesion, was observed. Dotted arrows represent where “pulling” was observed but to a lesser extent, with portions of the colony breaking off during disruption. (B) Biofilm cohesion was quantified from images as described in Materials and Methods with scores of 1 assigned to a null phenotype and 4 to the most/strongest. Statistics for panel C were performed via a two-way ANOVA using Tukey’s multiple-comparison test, where biofilm strength was the dependent variable. *, P = 0.0170; **, P < 0.0071; ****, P < 0.0001.
FIG 7
FIG 7
Multicopy expression of rscS induces syp transcription in response to pABA and calcium. sypA promoter activity (Miller units) was measured following a 22-h subculture in tTBS (T), TC, TP, and TPC of the PsypA-lacZ reporter strain KV8079 that contained either pKV69 (vector control [VC]) or pLMS33 (pRscS). Statistics were performed via a two-way ANOVA using Tukey’s multiple-comparison test, where Miller unit(s) was the dependent variable. ****, P < 0.0001.
FIG 8
FIG 8
Multicopy expression of rscS induces biofilm formation dependent on SypF’s HPT domain. Colony biofilm formation was assessed following growth on tTBS (T), TC, TP, and TPC of the following strains: ΔsypF (KV5267) with either pKV69 (vector control) (A) or pLMS33 (wild-type rscS; pRscS) (B), ΔsypF + sypF-hpt (KV7226) with either pKV69 (vector control) (C) or pLMS33 (pRscS) (D). Pictures were taken using the Zeiss Stemi 2000-c microscope (×6.5 magnification) at 72 h before and after disruption using a toothpick. Pictures are representative of three separate experiments. Arrows indicate where “pulling,” indicating cohesion, was observed. Dotted arrows represent where “pulling” was observed but to a lesser extent, with portions of the colony breaking off during disruption. (E) Biofilm cohesion was quantified from images as described in Materials and Methods with scores of 1 assigned to a null phenotype and 4 to the most/strongest. Statistics were performed via a two-way ANOVA using Tukey’s multiple-comparison test, where biofilm strength was the dependent variable. **, P = 0.0073; ****, P < 0.0001.
FIG 9
FIG 9
Multicopy expression of sypF does not induce biofilm formation on tTBS+pABA medium. Colony biofilm formation was assessed following growth on TP and TPC of ES114 carrying either (A) pKV69 (vector control) or (B) pCLD54 (pSypF). Pictures were taken using the Zeiss Stemi 2000-c microscope (×6.5 magnification) at 72 h before and after disruption using a toothpick. Pictures are representative of three separate experiments. Arrows indicate where “pulling,” indicating cohesion, was observed. Dotted arrows represent where “pulling” was observed but to a lesser extent, with portions of the colony breaking off during disruption. (C) Biofilm cohesion was quantified from images as described in Materials and Methods with scores of 1 assigned to a null phenotype and 4 to the most/strongest. Statistics were performed via a two-way ANOVA using Tukey’s multiple-comparison test, where biofilm strength was the dependent variable. *, P = 0.0121; ***, P = 0.0005.
FIG 10
FIG 10
The RscS-SypF chimera can complement rscS and sypF deletions. Colony biofilm formation was evaluated following growth on tTBS (T), TC, TP, and TPC of the following strains: ΔrscS+rscS-sypF chimera (KV10302) (A), ΔsypF+rscS-sypF chimera (KV10355) (B), ΔsypF ΔrscS+rscS-sypF chimera (KV10351) (C), and ΔsypF rscS Δhpt::sypF-hpt+rscS-sypF chimera (KV10397) (D). Pictures were taken using the Zeiss Stemi 2000-c microscope with ×6.5 magnification at 72 h before and after disruption using a toothpick. Pictures are representative of three separate experiments. Arrows indicate where “pulling,” indicating cohesion, was observed. Dotted arrows represent where “pulling” was observed but to a lesser extent, with portions of the colony breaking off during disruption. (E) Biofilm cohesion was quantified from images as described in Materials and Methods with scores of 1 assigned to a null phenotype and 4 to the most/strongest. Statistics were performed via a two-way ANOVA using Tukey’s multiple-comparison test, where biofilm strength was the dependent variable. *, P = 0.0122; ***, P = 0.0007; ****, P < 0.0001.
FIG 11
FIG 11
KB2B1 readily forms a biofilm on all LBS media but not all tTBS media. (A) Colony biofilm formation was evaluated following growth on LBS (L), LBS+calcium (LC), LBS+pABA (LP), LBS+pABA/calcium (LPC), tTBS (T), TC, TP, and TPC of WT KB2B1. Pictures were taken using the Zeiss Stemi 2000-c microscope (×6.5 magnification) at 72 h before and after disruption using a toothpick. Pictures are representative of three separate experiments. Arrows indicate where “pulling,” indicating cohesion, was observed. (B) Biofilm cohesion was quantified from images as described in Materials and Methods with scores of 1 assigned to a null phenotype and 4 to the most/strongest. Statistics were performed via a one-way ANOVA using Tukey’s multiple-comparison test, where biofilm strength was the dependent variable. **, P = 0.0025.
FIG 12
FIG 12
RscS responds to pABA and calcium in a heterologous system. Colony biofilm formation was evaluated following growth on tTBS (T), TC, TP, and TPC of the following strains: WT KB2B1 (A), KB2B1+rscSES114 (KV10409) (B), and KB2B1+sypFES114 (KV10389) (C). Pictures were taken using the Zeiss Stemi 2000-c microscope (×6.5 magnification) at 72 h before and after disruption using a toothpick. Pictures are representative of three separate experiments. Arrows indicate where “pulling,” indicating cohesion, was observed. (D) Biofilm cohesion was quantified from images as described in Materials and Methods with scores of 1 assigned to a null phenotype and 4 to the most/strongest. Statistics were performed via a one-way ANOVA using Tukey’s multiple-comparison test, where biofilm strength was the dependent variable. *, P < 0.0342; **, P < 0.006; ***, P < 0.001; ****, P < 0.0001.

Similar articles

Cited by

References

    1. Liu C, Sun D, Zhu J, Liu W. 2018. Two-component signal transduction systems: a major strategy for connecting input stimuli to biofilm formation. Front Microbiol 9:3279. doi:10.3389/fmicb.2018.03279. - DOI - PMC - PubMed
    1. Szurmant H, White RA, Hoch JA. 2007. Sensor complexes regulating two-component signal transduction. Curr Opin Struct Biol 17:706–715. doi:10.1016/j.sbi.2007.08.019. - DOI - PMC - PubMed
    1. Zschiedrich CP, Keidel V, Szurmant H. 2016. Molecular mechanisms of two-component signal transduction. J Mol Biol 428:3752–3775. doi:10.1016/j.jmb.2016.08.003. - DOI - PMC - PubMed
    1. Mascher T, Helmann JD, Unden G. 2006. Stimulus perception in bacterial signal-transducing histidine kinases. Microbiol Mol Biol Rev 70:910–938. doi:10.1128/MMBR.00020-06. - DOI - PMC - PubMed
    1. Bhate MP, Molnar KS, Goulian M, DeGrado WF. 2015. Signal transduction in histidine kinases: insights from new structures. Structure 23:981–994. doi:10.1016/j.str.2015.04.002. - DOI - PMC - PubMed

Publication types

LinkOut - more resources