. 2023 Aug 17;11(4):e0111523.
doi: 10.1128/spectrum.01115-23. Epub 2023 Jun 12.

Characterization of the Inflammatory Response Evoked by Bacterial Membrane Vesicles in Intestinal Cells Reveals an RIPK2-Dependent Activation by Enterotoxigenic Escherichia coli Vesicles

Affiliations

Characterization of the Inflammatory Response Evoked by Bacterial Membrane Vesicles in Intestinal Cells Reveals an RIPK2-Dependent Activation by Enterotoxigenic Escherichia coli Vesicles

Himadri B Thapa et al. Microbiol Spectr. .

Abstract

Although the immunomodulatory potency of bacterial membrane vesicles (MVs) is widely acknowledged, their interactions with host cells and the underlying signaling pathways have not been well studied. Herein, we provide a comparative analysis of the proinflammatory cytokine profile secreted by human intestinal epithelial cells exposed to MVs derived from 32 gut bacteria. In general, outer membrane vesicles (OMVs) from Gram-negative bacteria induced a stronger proinflammatory response than MVs from Gram-positive bacteria. However, the quality and quantity of cytokine induction varied between MVs from different species, highlighting their unique immunomodulatory properties. OMVs from enterotoxigenic Escherichia coli (ETEC) were among those showing the strongest proinflammatory potency. In depth analyses revealed that the immunomodulatory activity of ETEC OMVs relies on a so far unprecedented two-step mechanism, including their internalization into host cells followed by intracellular recognition. First, OMVs are efficiently taken up by intestinal epithelial cells, which mainly depends on caveolin-mediated endocytosis as well as the presence of the outer membrane porins OmpA and OmpF on the MVs. Second, lipopolysaccharide (LPS) delivered by OMVs is intracellularly recognized by novel caspase- and RIPK2-dependent pathways. This recognition likely occurs via detection of the lipid A moiety as ETEC OMVs with underacylated LPS exhibited reduced proinflammatory potency but similar uptake dynamics compared to OMVs derived from wild-type (WT) ETEC. Intracellular recognition of ETEC OMVs in intestinal epithelial cells is pivotal for the proinflammatory response as inhibition of OMV uptake also abolished cytokine induction. The study signifies the importance of OMV internalization by host cells to exercise their immunomodulatory activities. IMPORTANCE The release of membrane vesicles from the bacterial cell surface is highly conserved among most bacterial species, including outer membrane vesicles (OMVs) from Gram-negative bacteria as well as vesicles liberated from the cytoplasmic membrane of Gram-positive bacteria. It is becoming increasingly evident that these multifactorial spheres, carrying membranous, periplasmic, and even cytosolic content, contribute to intra- and interspecies communication. In particular, gut microbiota and the host engage in a myriad of immunogenic and metabolic interactions. This study highlights the individual immunomodulatory activities of bacterial membrane vesicles from different enteric species and provides new mechanistic insights into the recognition of ETEC OMVs by human intestinal epithelial cells.

Keywords: ETEC; HT-29; IL-8; LPS; OMV; RIPK2; bacterial membrane vesicles; caspase; cytokine; cytokines; inflammatory response; interleukins; intestinal epithelial cell; lipopolysaccharide; outer membrane vesicles; porin; porins.


Conflict of interest statement

The authors declare no conflict of interest.

Figures
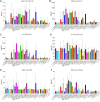
FIG 1
FIG 1
Proinflammatory cytokine response to MVs derived from diverse intestinal bacteria in human intestinal cells. ENA-78/CXCL5 (A), GRO-alpha/CXCL1 (B), IL-8/CXCL8 (C), IP-10/CXCL10 (D), MDC/CCL22 (E) and MIP-3alpha/CCL20 (F) were detected, and levels were quantified by ELISA in supernatants of HT-29 intestinal cells incubated for 16 h with equal amounts of MVs derived from the bacterial species indicated on the x axis, respectively. MVs are sorted alphabetically by their donor species separated by Gram-negative (left) and Gram-positive (right) bacteria. Incubation with saline served as a negative control (no MVs [far right]). The corresponding basal level of each cytokine/chemokine produced by HT-29 is given by the median value of the control (no MVs) and highlighted with a horizontal black line. Data are indicated as the median ± interquartile range. (A) n = 4 for B. thetaiotaomicron, F. nucleatum and Y. enterocolitica; n = 11 for E. cloacae and no MVs, n = 7 for enteroaggregative E. coli (EAEC) 55989, EPEC E2348/69, and L. acidophilus; n = 8 for EAEC 042, EAEC 17-2, enteroinvasive E. coli (EIEC) EDL 1284, EIEC HN280, ETEC 1392-75, uropathogenic E. coli (UPEC) CFT073, K. oxytoca, S. flexneri, and Pediococcus acidilactici; n = 10 for ETEC 10407 (WT) and E. coli Nissle; n = 5 for P. vulgaris; n = 9 for Shigella sonnei and V. cholerae; n = 6 for all other data sets. (B) n = 8 for B. fragilis, EAEC 55989, EAEC 042, EAEC 17-2, EIEC EDL 1284, EIEC HN280, ETEC 1392-75, EPEC E2348/69, P. vulgaris, S. Typhimurium, and Y. enterocolitica; n = 12 for Bacteroides thetaiotaomicron, Bacteroides vulgatus, E. cloacae, UPEC CFT073, E. coli Nissle, and K. oxytoca; n = 18 for ETEC 10407 (WT); n = 9 for UPEC 536; n = 14 for no MVs; n = 10 for all other data sets. (C) n = 12 for E. cloacae, K. oxytoca, S. sonnei, and L. acidophilus; n = 47 for ETEC 10407 (WT); n = 16 for UPEC CFT073 and V. cholerae; n = 4 for UPEC UTI89; n = 14 for E. coli Nissle; n = 28 for no MVs; n = 8 for all other data sets; (D) n = 6 for B. fragilis, UPEC CFT07, UPEC 536, K. pneumoniae, P. vulgaris, V. cholerae, and Y. enterocolitica; n = 11 for B. vulgatus; n = 10 for EIEC EDL 1284; n = 12 for ETEC 10407 (WT) and no MVs; n = 4 for F. nucleatum; n = 7 for L. acidophilus; n = 8 for all other data sets. (E) n = 12 for B. thetaiotaomicron, V. cholerae, P. acidilactici, and no MVs; n = 14 for ETEC 10407 (WT); n = 10 for E. cloacae and K. oxytoca; n = 8 for all other data sets. (F) n = 4 for EIEC EDL 1284; n = 16 for ETEC 10407 (WT) and V. cholerae; n = 12 for E. coli Nissle; n = 14 for no MVs; n = 8 for all other data sets.
FIG 2
FIG 2
IL-8 response in HT-29 intestinal cells to OMVs derived from ETEC H10407 WT or diverse surface mutants. Cytokine levels were quantified by ELISA in supernatants of HT-29 intestinal cells incubated for 16 h with equal amounts of OMVs. Donor strains of the OMVs are indicated on the x axis. (A) HT-29 cells were exposed to OMVs derived from ETEC H10407 (WT) or deletion strains as indicated. In addition, OMVs of the WT were either treated with proteinase K prior to their incubation with HT-29 cells (WT + prot. K) or exposed to HT-29 cells in the presence of the uptake inhibitor dynasore (WT + dynasore). Incubation with saline or the uptake inhibitor dynasore served as negative controls (no OMVs or no OMVs + dynasore). (B) HT-29 cells were exposed to OMVs derived from deletion mutants harboring empty vector (p) or expression plasmids as indicated. (A and B) Data are indicated as the median ± interquartile range (n = 16 for no OMVs, n = 27 for WT, n = 12 for WT + prot. K as well as ΔmsbB p, n = 13 for ΔmsbB, n = 11 for ΔeltA, n = 17 for ΔmsbB pmsbB, and n = 8 for all other data sets) Asterisks highlight significant differences between respective data sets (*, P < 0.05 by Kruskal-Wallis test, followed by Dunn’s post hoc test for multiple comparisons or Mann-Whitney U test for single comparisons).
FIG 3
FIG 3
Uptake of OMVs derived from ETEC H10407 WT by HT-29 intestinal cells depends on surface porins OmpA and OmpF. (A) HT-29 intestinal epithelial cells were incubated for 8 h with rhodamine-labeled OMVs derived from the ETEC H10407 WT, ΔmsbB, ΔeltA, ΔompC, ΔompA, or ΔompF strain. Alternatively, OMVs derived from the ETEC H10407 WT were treated with proteinase K prior to their incubation with HT-29 cells (WT + prot. K). Uptake was detected by an increase in relative fluorescence units (RFU) measured every hour. Wells containing rhodamine-labeled OMVs without cells served as a blank. Shown are the mean ± standard deviation, where n = 8 for the WT, ΔompC, ΔompA, and ΔompF strains and n = 6 for all other data sets. (B) Shown are the median area under the curve (AUC) values ± interquartile range retrieved from the uptake analyses in HT-29. Asterisks highlight significant differences between respective data sets (*, P < 0.05 by Kruskal-Wallis test, followed by Dunn’s post hoc test).
FIG 4
FIG 4
Uptake of OMVs derived from the ETEC H10407 WT by HT-29 intestinal cells is significantly reduced by dynasore or nystatin. (A) HT-29 intestinal epithelial cells were incubated for 8 h with rhodamine-labeled OMVs derived from the ETEC H10407 WT in the presence of uptake inhibitors cytochalasin D, wortmannin, chlorpromazine, nystatin, and dynasore or the solvent DMSO (w/o inhibitor). Uptake is detected by an increase in relative fluorescence units (RFU) measured every hour. Wells containing rhodamine-labeled OMVs from the WT without cells served as a blank. Shown is the mean ± standard deviation, where n = 8. (B) Shown are the median area under the curve (AUC) values ± interquartile range retrieved from the uptake analyses in HT-29. Asterisks highlight significant differences between respective data sets (*, P < 0.05 by Kruskal-Wallis test, followed by Dunn’s post hoc test).
FIG 5
FIG 5
RIPK2 and caspase inhibitor block IL-8 response provoked by OMVs from the ETEC H10407 WT strain in HT-29 intestinal cells. Cytokine levels were quantified by ELISA in supernatants of HT-29 intestinal cells incubated for 16 h with OMVs derived from the ETEC H10407 WT (w OMVs) in the presence of solvent DMSO (w/o inhibitor) or inhibitors for MyD88 (NPB2-29328), Nod1 (ML130), Nod2 (GSK717), caspase (Z-YVAD-FMK), or RIPK2 (gefitinib and GSK583) cascades. Incubation with solvent DMSO served as the negative control (no OMVs). Data are indicated as the median ± interquartile range (n = 30 for no OMVs, n = 57 for OMVs w/o inhibitor, n = 8 for NPB2-29328 and gefitinib, n = 10 for ML130, n = 7 for GSK717, n = 20 for Z-YVAD-FMK, and n = 28 for GSK583). Asterisks highlight significant differences between respective data sets (*, P < 0.05 by Kruskal-Wallis test, followed by Dunn’s post hoc test).
FIG 6
FIG 6
Visualization of RIPosome formation in HT-29 intestinal cells upon exposure to OMVs from the ETEC H10407 WT strain. Shown are transmission (top row) and fluorescence (bottom row) micrographs of HT-29 cells transfected with expression plasmids for EGFP (control), EGFP-RIPK2, or EGFP-RIPK2 Y474F after 16 h of incubation with OMVs from the ETEC H10407 WT (w OMVs) or saline (w/o OMVs). Dead cells were visualized by propidium iodine staining and excluded from RIPosome formation analyses. (A representative example is provided in Fig. S6.) Scale bar = 10 μm.
FIG 7
FIG 7
Knockdown of RIPK2 reduces IL-8 release induced by OMVs from the ETEC H10407 WT strain in HT-29 intestinal cells. (A and B) HT-29 cells were treated for 48 h with RIPK2 siRNA or a nontargeting control (ctrl) siRNA or left untreated (w/o siRNA), followed by a 16-h exposure to OMVs derived from the ETEC H10407 WT. (A) Immunoblot analysis of whole-cell lysates from HT-29 cells treated as described above. Immunoblots probed with anti-RIPK2 antibody and GAPDH-antibody as loading control are shown. (B) IL-8 release was quantified by ELISA in supernatants of HT-29 cells treated as described above. Data are indicated as the median ± interquartile range (n = 10 for w/o siRNA and ctrl RNA as well as n = 8 for RIPK2 siRNA). Asterisks highlight significant differences between respective data sets (*, P < 0.05 by Kruskal-Wallis test, followed by Dunn’s post hoc test).

Similar articles

Cited by

References

    1. Toyofuku M, Schild S, Kaparakis-Liaskos M, Eberl L. 2023. Composition and functions of bacterial membrane vesicles. Nat Rev Microbiol doi:10.1038/s41579-023-00875-5. - DOI - PubMed
    1. Mashburn LM, Whiteley M. 2005. Membrane vesicles traffic signals and facilitate group activities in a prokaryote. Nature 437:422–425. doi:10.1038/nature03925. - DOI - PubMed
    1. Kulp A, Kuehn MJ. 2010. Biological functions and biogenesis of secreted bacterial outer membrane vesicles. Annu Rev Microbiol 64:163–184. doi:10.1146/annurev.micro.091208.073413. - DOI - PMC - PubMed
    1. Guerrero-Mandujano A, Hernandez-Cortez C, Ibarra JA, Castro-Escarpulli G. 2017. The outer membrane vesicles: secretion system type zero. Traffic 18:425–432. doi:10.1111/tra.12488. - DOI - PubMed
    1. Shapira M. 2016. Gut microbiotas and host evolution: scaling up symbiosis. Trends Ecol Evol 31:539–549. doi:10.1016/j.tree.2016.03.006. - DOI - PubMed

Publication types

MeSH terms

Substances

LinkOut - more resources