. 2023 Aug 15;83(16):2750-2762.
doi: 10.1158/0008-5472.CAN-22-3646.

Temozolomide Sensitizes ARID1A-Mutated Cancers to PARP Inhibitors

Affiliations

Temozolomide Sensitizes ARID1A-Mutated Cancers to PARP Inhibitors

Zheng-Cheng Yu et al. Cancer Res. .

Abstract

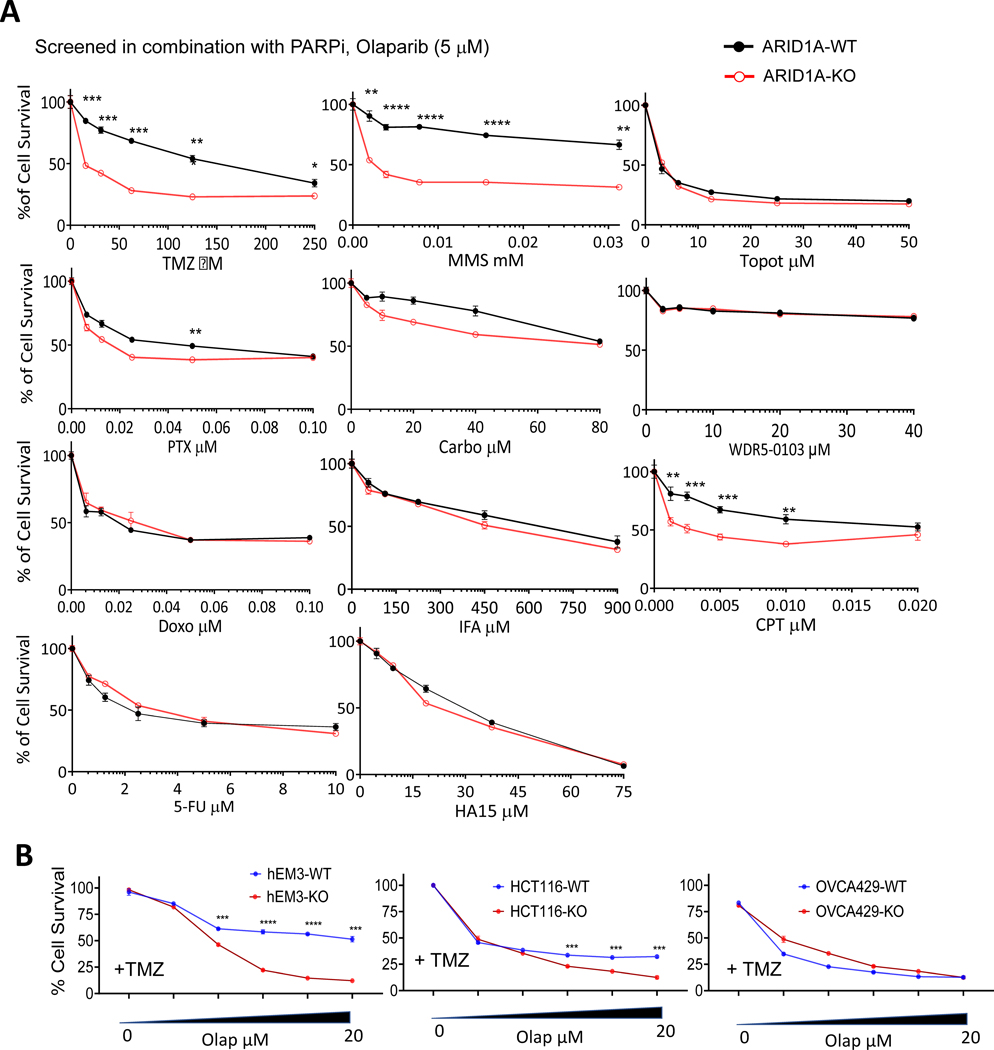
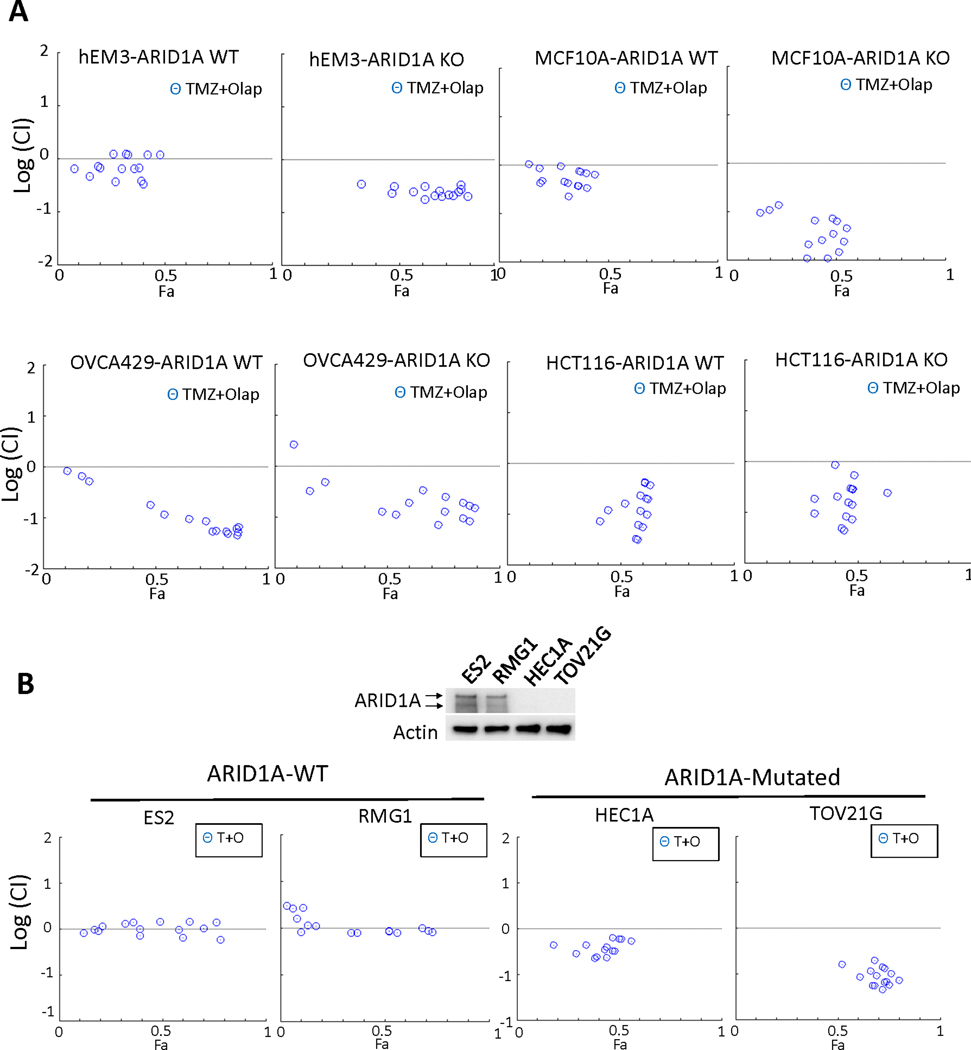
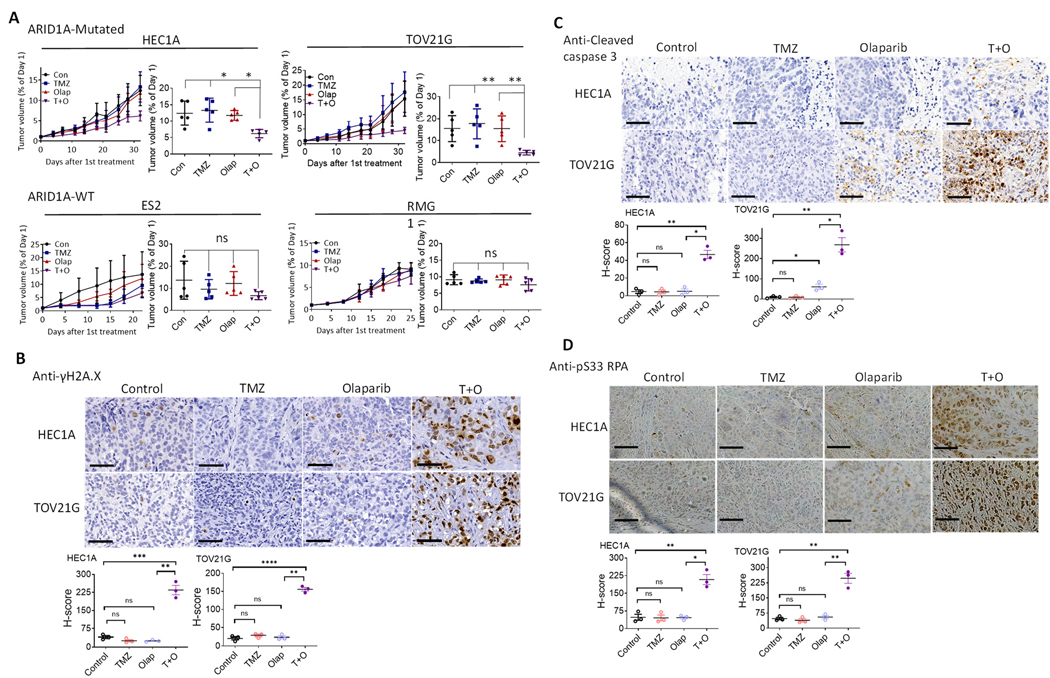
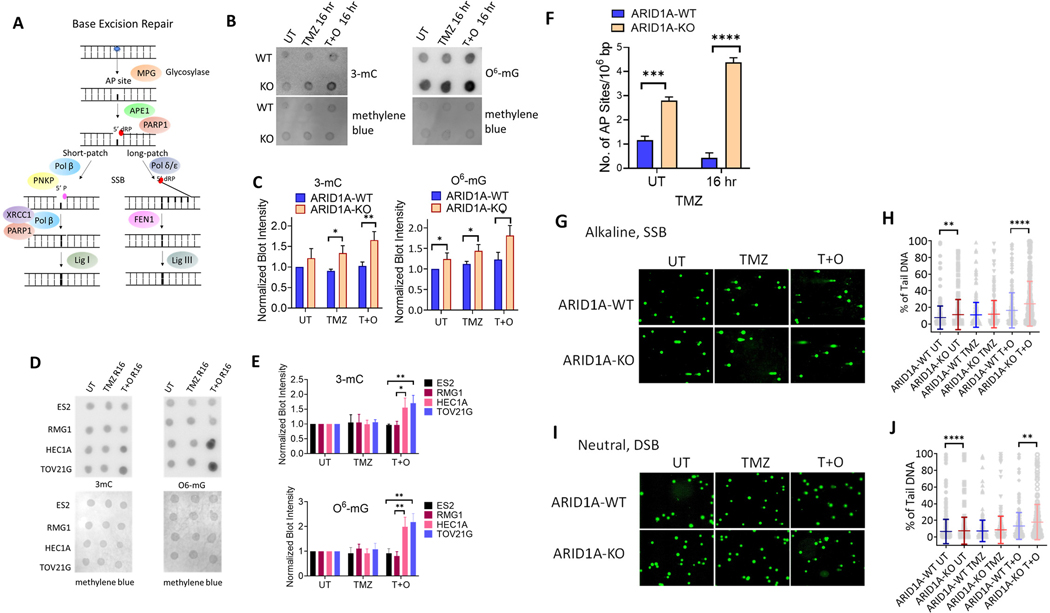
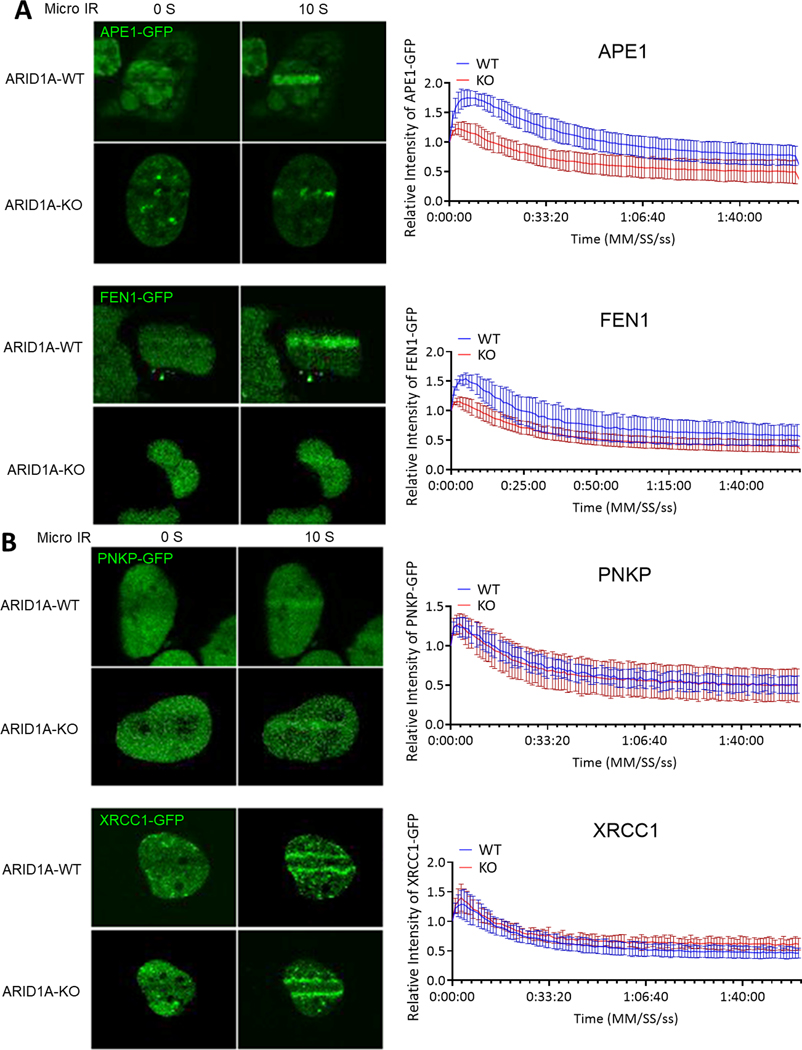
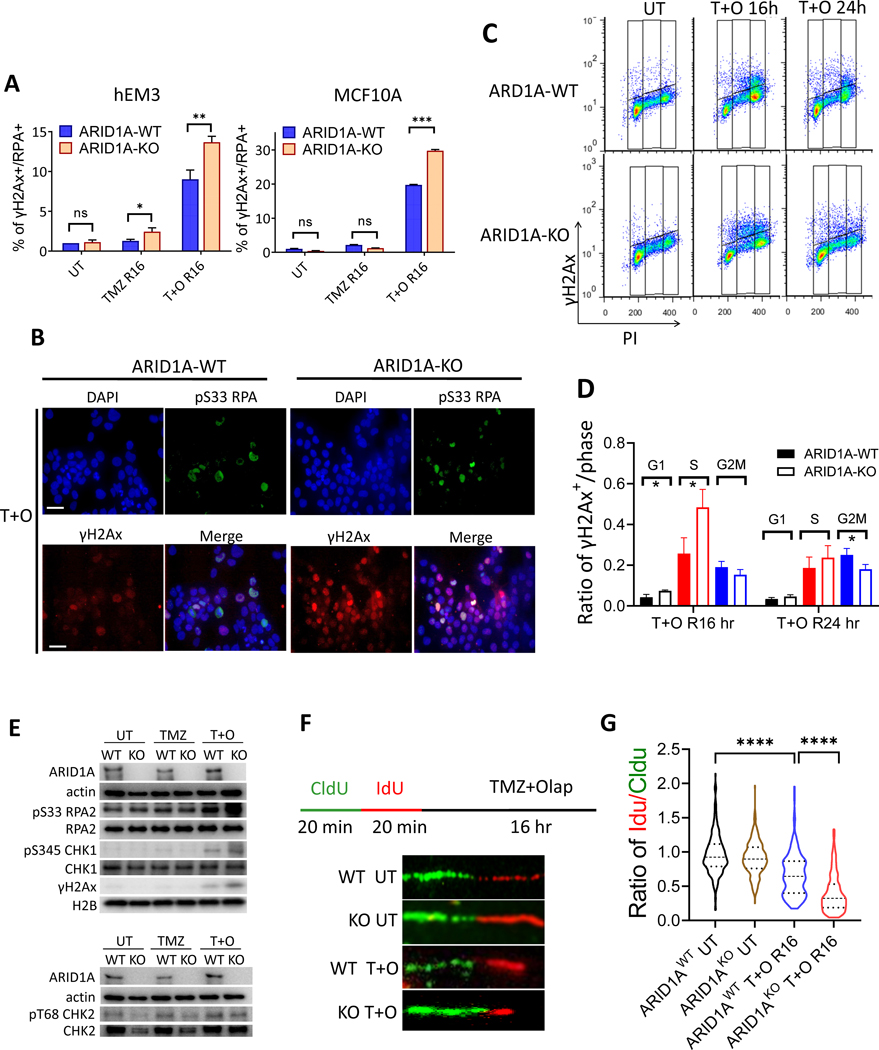
ARID1A is a subunit of SWI/SNF chromatin remodeling complexes and is mutated in many types of human cancers, especially those derived from endometrial epithelium, including ovarian and uterine clear cell carcinoma (CCC) and endometrioid carcinoma (EMCA). Loss-of-function mutations in ARID1A alter epigenetic regulation of transcription, cell-cycle checkpoint control, and DNA damage repair. We report here that mammalian cells with ARID1A deficiency harbor accumulated DNA base lesions and increased abasic (AP) sites, products of glycosylase in the first step of base excision repair (BER). ARID1A mutations also delayed recruitment kinetics of BER long-patch repair effectors. Although ARID1A-deficient tumors were not sensitive to monotherapy with DNA-methylating temozolomide (TMZ), the combination of TMZ with PARP inhibitors (PARPi) potently elicited double-strand DNA breaks, replication stress, and replication fork instability in ARID1A-deficient cells. The TMZ and PARPi combination also significantly delayed in vivo growth of ovarian tumor xenografts carrying ARID1A mutations and induced apoptosis and replication stress in xenograft tumors. Together, these findings identified a synthetic lethal strategy to enhance the response of ARID1A-mutated cancers to PARP inhibition, which warrants further experimental exploration and clinical trial validation.

Significance: The combination of temozolomide and PARP inhibitor exploits the specific DNA damage repair status of ARID1A-inactivated ovarian cancers to suppress tumor growth.


Conflict of interest statement

The authors declare that they have no competing interest.

Figures

Figure 1.
Figure 1.. Alkylating agent sensitizes ARID1A-KO cells to Olaparib
(A) Viabilities of hEM3 ARID1A-WT and ARID1A-KO cells. Cells were treated with the indicated chemotherapeutic drugs agents in the presence of 5 μM Olaparib (Olap). **P < 0.01, ***P < 0.001, ****P < 0.001, Student’s t-test. (B) Viability of hEM3 and OVCA429 ARID1A-WT or ARID1A-KO cells assessed in the presence of 100 μM temozolomide (TMZ) in combination with serially increased doses of Olaparib. ***P < 0.001, ****P < 0.001, Student’s t-test.
Figure 2.
Figure 2.. Synergy between DNA alkylating drug and PARP inhibitor in ARID1A-deficient and ARID1A-proficient cell lines.
(A) Cytotoxicity test reported by logarithmic combination index (CI) plots of DNA alkylating agent Temozolomide (TMZ) in combination with PARP inhibitor, Olaparib, in ARID1A-WT and ARID1A-KO hEM3 cells from endometrial tissue, MCF-10a cells derived from mammary gland epithelium, OVCA429 cells from an ovarian cancer case, and HCT116 cells from a colorectal cancer case. Drugs were applied over a range of concentrations, and the Fa (Fraction Affected) represents the fraction of affected cells by treatment. The horizontal dashed line at Log (CI) = 0 separates synergistic [Log (CI)<0] from antagonistic [Log (CI)>0] and additive [Log (CI)=0] drug-drug interactions. (B) (Top) Immunoblot of ARID1A protein expression in tumor cell lines ES2, RMG1, HEC1A, and TOV21G. ES2 and RMG1 express ARID1A and lack mutations in the ARID1A gene. HEC1A and TOV21G do not display detectable ARID1A expression, and both cells have deleterious mutations in ARID1A. (Bottom) Log (CI) plots showing response to TMZ/Olaparib (T+O) in ARID1A-WT and in ARID1A-mutated cells.
Figure 3.
Figure 3.. TMZ and Olap combination is effective in treating ovarian xenograft tumors with ARID1A mutations.
(A) In vivo tumor xenografts from ES2, RMG1, HEC1A, and TOV21G cells. Tumor-bearing mice were treated with vehicle (control), TMZ, Olap, or TMZ+Olap (T+O). Tumor growth was measured as tumor volume over a period of 30 days (left) and end point tumor volume compared to day 1 (right). Data are normalized to tumor volume collected at day 1 and presented as mean ± SEM (n = 5). Mann–Whitney test (two-tailed) was used to calculate significance of differences between two comparison groups; *P < 0.01; **P < 0.001. (B-D) In the two ARID1A-mutant xenograft tumors, HEC1A and TOV21G, the effect of in vivo treatment on replication stress and apoptotic tendency was evaluated using three different markers: γH2A.X (B), cleaved caspase 3 (C), and pS33 RPA (D). (Top) IHC imaging results. Cells expressing the selected markers were immunodetected with DAB. (Bottom) H-score was used to quantify IHC signals of the three markers and is presented as mean ± SEM (n = 3); *P < 05, **P < 0.01, ***P < 0.001, ****P < 0.0001, Student’s t-test. Scale bar in each photomicrograph represents 60 μm.
Figure 4.
Figure 4.. Defective Base Excision Repair in ARID1A-Deficient Endometrial Epithelial Cells.
(A) The mechanism of Base Excision Repair (BER). Alkylating agents such as Temozolomide (TMZ) can induce methylation of DNA bases, which is repaired through BER. When such lesions are induced, the DNA glycosylase MPG will remove the entire base from the DNA strand resulting in an abasic (AP) site. Subsequently, AP endonuclease (APE1) cleaves the AP site where a 5’ deoxyribose phosphate (dRP) end is exposed. From here, this pathway may diverge into two DNA repair routes: short patch repair or long patch repair. In the short patch repair pathway, the dirty ends are cleaned up by Pol β or PNKP. PARP1 first binds to damaged DNA and initiates recruitment of XRCC1 and DNA polymerase beta (Pol β). They collectively form a complex and replace a complementary nucleotide using the sister strand as a template. The newly synthesized DNA is ligated by DNA ligase I (Lig I). In the long patch repair pathway, a longer strand (2–10 bases) is synthesized by DNA polymerase delta/epsilon (Pol δ/ε) to replace the redundant 5’ dRP end, which is then removed by the flap endonuclease (FEN1). The newly synthesized DNA strand is ligated by DNA ligase III (Lig III). (B) Dot blot showing levels of alkylated DNA in hEM3 ARID1A-WT and ARID1A-KO cells exposed to the indicated treatment regimens for 4 hrs, then recovery for 16 hrs. (Left) Methylcytosine (3-mC), (Right) O6-Methylguanine (O6-mG). Untreated (UT), Temozolomide (TMZ), combination of Temozolomide and Olaparib (T+O). Methylene blue staining is used as a loading control. (C) Normalized blot intensity calculated from result shown in B. Student’s t-test was used to calculate significance and to normalize the result. Data are presented as mean ± SEM. n=3; *P < 0.05; **P < 0.01. (D) Dot blot showing levels of alkylated DNA assessed in Type I ovarian cancer cell lines with (HEC1A, TOV21G) or without (ES2, RMG1) ARID1A mutation exposed to the indicated condition. Methylene blue staining is used as a loading control. *P < 0.05; **P < 0.01 (Multiple unpaired t-test). (E) Normalized blot intensity calculated from results shown in D. **P < 0.01 (Multiple unpaired t-test). (F) Number of apurinic (AP) sites per 106 base pair (bp) in hEM3 ARID1A-WT and ARID1A-KO cells at 0 hr and 16 hr after TMZ drug treatment. AP sites result from DNA glycosylase, an upstream effector in the BER pathway. The value was measured using an AP site quantification kit (Cell Biolabs). Student t-test was used to calculate significance. Data are presented as mean ± SEM. n=3; ***P < 0.001, ****P < 0.0001 (Multiple unpaired t-test). (G) Alkaline comet assay was performed on hEM3 cells (ARID1A-WT and -KO) 16 hours after the treatment with TMZ, TMZ+O, or vehicle control (UT). (H) Quantification of data from (G). Data are presented as mean ± SEM, **P < 0.01, ****P < 0.0001 (Mann-Whitney test). (I) Neutral comet assay was performed on hEM3 cells (ARID1A-WT and ARID1A-KO) 16 hours after the treatment with TMZ, TMZ+O, or vehicle control. (J) Quantification of data from (I). Data are presented as mean ± SEM; **P < 0.01, ****P < 0.0001 (Mann-Whitney test).
Figure 5.
Figure 5.. Short patch pathway is not influenced by ARID1A-KO under micro-irradiation (micro-IR).
(A) (Left) Representative live-cell images of hEM3 ARID1A-KO and control cells expressing APE1-GFP and FEN1-GFP at 0 and 10 seconds after micro-IR. (Right) Relative fluorescence intensity at irradiated area measured every second for 2 minutes and plotted as mean ± SEM after normalization to the background fluorescence intensity using Image J. (B) (Left) Representative live-cell images of hEM3 ARID1A-KO and control cells expressing PNKP-GFP and XRCC1-GFP at 0 and 10 seconds after micro-IR. (Right) Relative fluorescence intensity at irradiated area measured every second for 2 minutes and plotted as mean ± SEM after normalization to the background fluorescence intensity using Image J.
Figure 6.
Figure 6.. Elevated replication stress in ARID1A-KO cells after combination treatment with TMZ+Olap.
(A) Level of replication stress in response to indicated drug treatment is represented by percentage of cells positive for both γH2A.X signaling (γH2A.X+) and RPA chromatin binding (RPA+) in ARID1A-WT and ARID1A-KO cell lines derived from hEM3, MCF-10a, HCT116, and OVCA429. n=3; *P < 0.05. **P < 0.01; ***P < 0.005 (Multiple unpaired t-test). (B) Immuno-fluorescence images of hEM3 ARID1A-WT and ARID1A-KO cells treated with TMZ+Olap for 4 hrs then recovery for 16 hrs. Anti-pS33 RPA antibody is tagged with a red fluorophore and anti-γH2A.X with a green fluorophore. Scale bar in each photomicrograph is 10 μm. (C) Flow cytometric analysis of cell cycle distribution and γH2A.X expression in hEM3 ARID1A-WT and ARID1A-KO cells at 0, 16, and 24 hours after TMZ+Olap treatment. (D) Quantification of γH2A.X+ cells normalized to each cell cycle stage. Data are presented as mean ± SEM, n = 3; *P < 0.05 (Multiple unpaired t-test). (E) Expression levels of replication markers assessed by immunoblots. CHK1 and RPA are phosphorylation substrates of ATR, whereas CHK2 is the phosphorylation substrate of ATM. (F) Top: Schema showing cells incubated with thymidine analogue CIdU for 20 min followed by IdU for 20 min, and then treated with TMZ+Olap for 16 h. CIdU (green) and IdU (red) incorporation into DNA tracks was visualized by immunofluorescence. Bottom: DNA fiber analysis showing DNA tracks with incorporation of CIdU (green) and IdU (red) analogues. (G) Length of each labeled track (CIdU and IdU) in DNA combing assay was measured using Image J and quantified by violin plot after normalization of IdU to CIdU. Mann Whitney test was used calculate significance. Approximately 300 tracks were counted for each group; ****P < 0.0001.

References

    1. Kurman RJ, Shih Ie M. The Dualistic Model of Ovarian Carcinogenesis: Revisited, Revised, and Expanded. Am J Pathol 2016;186:733–47 - PMC - PubMed
    1. Cho KR, Shih Ie M. Ovarian cancer. Annu Rev Pathol 2009;4:287–313 - PMC - PubMed
    1. Kurman RJ, Shih Ie M. The origin and pathogenesis of epithelial ovarian cancer: a proposed unifying theory. Am J Surg Pathol 2010;34:433–43 - PMC - PubMed
    1. Koshiyama M, Matsumura N, Konishi I. Recent concepts of ovarian carcinogenesis: type I and type II. Biomed Res Int 2014;2014:934261 - PMC - PubMed
    1. Wiegand KC, Shah SP, Al-Agha OM, Zhao Y, Tse K, Zeng T, et al. ARID1A mutations in endometriosis-associated ovarian carcinomas. N Engl J Med 2010;363:1532–43 - PMC - PubMed

Publication types

MeSH terms