. 2023 Aug 15;83(16):2675-2689.
doi: 10.1158/0008-5472.CAN-22-3645.

Syk Inhibition Reprograms Tumor-Associated Macrophages and Overcomes Gemcitabine-Induced Immunosuppression in Pancreatic Ductal Adenocarcinoma

Affiliations

Syk Inhibition Reprograms Tumor-Associated Macrophages and Overcomes Gemcitabine-Induced Immunosuppression in Pancreatic Ductal Adenocarcinoma

Deepak Rohila et al. Cancer Res. .

Abstract

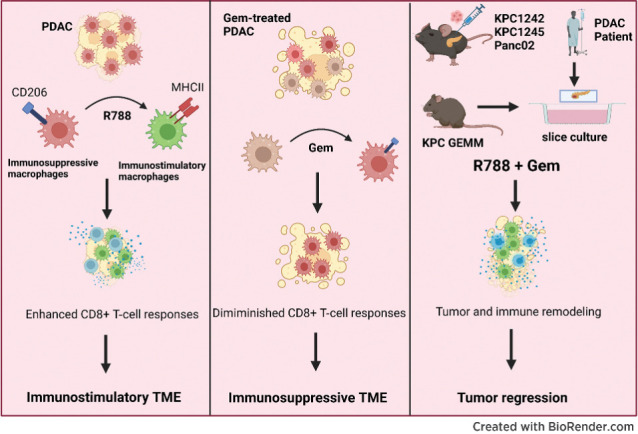
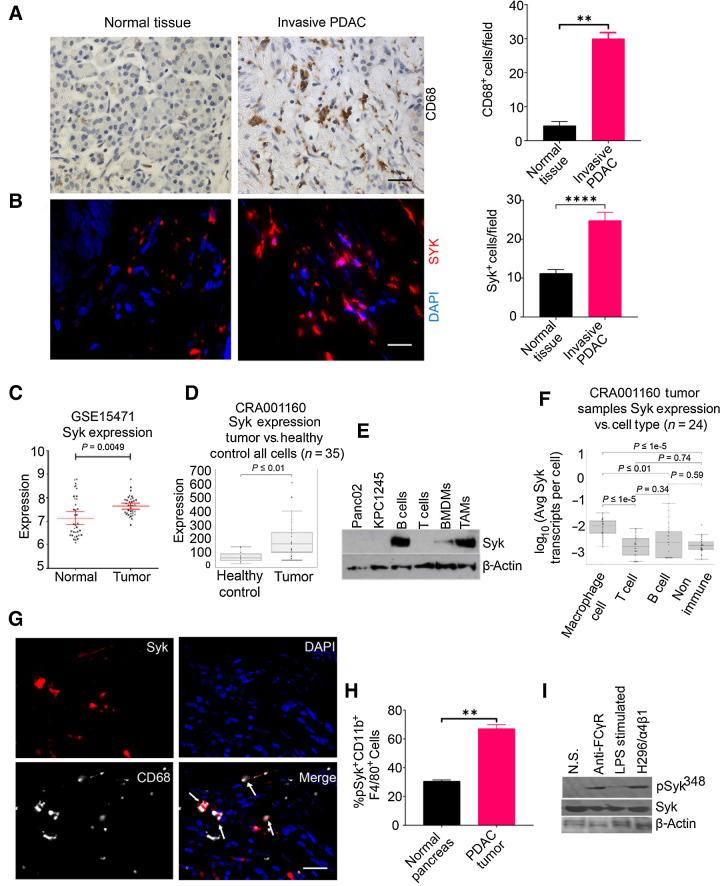
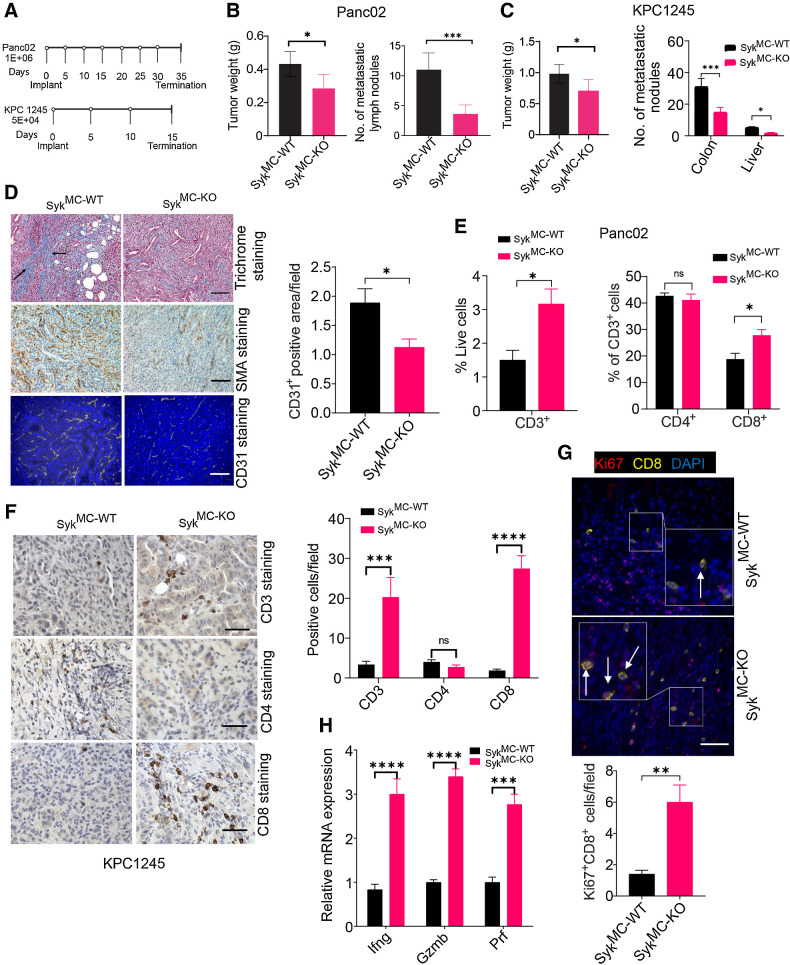
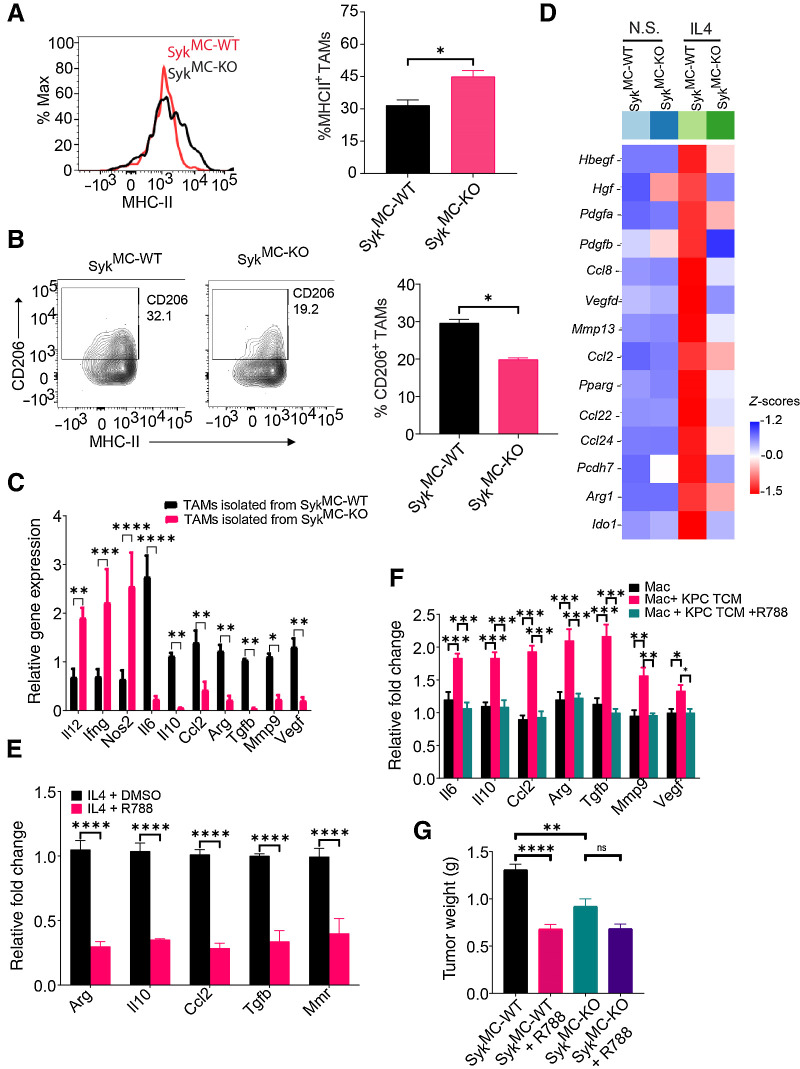
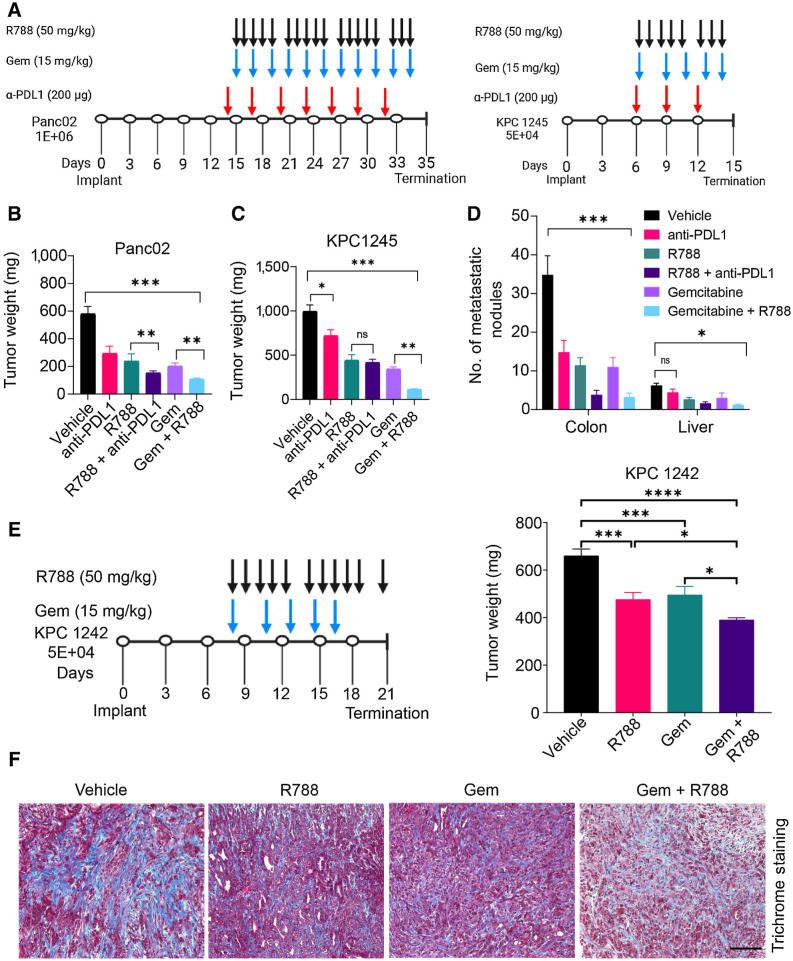
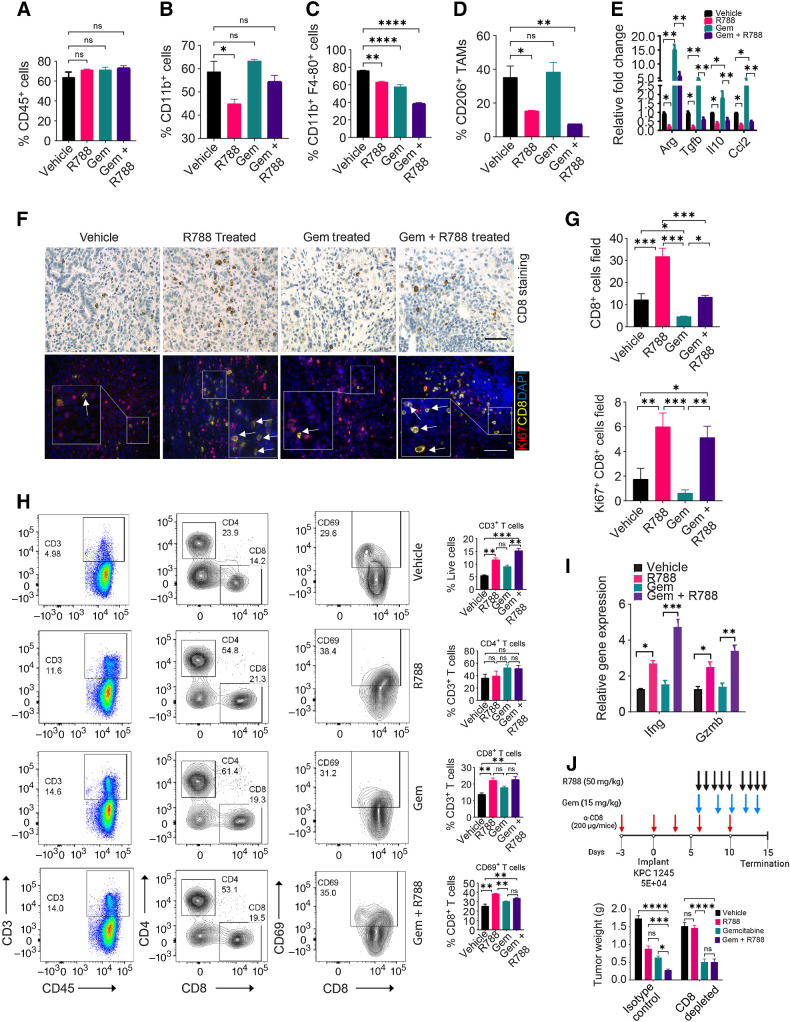
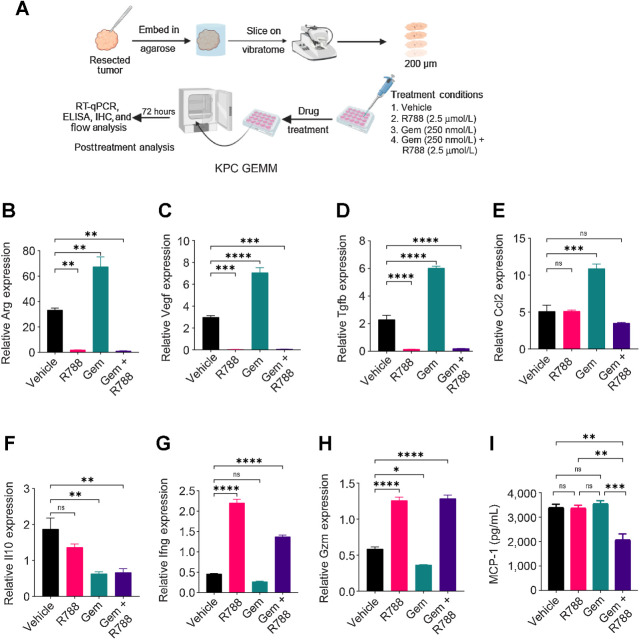
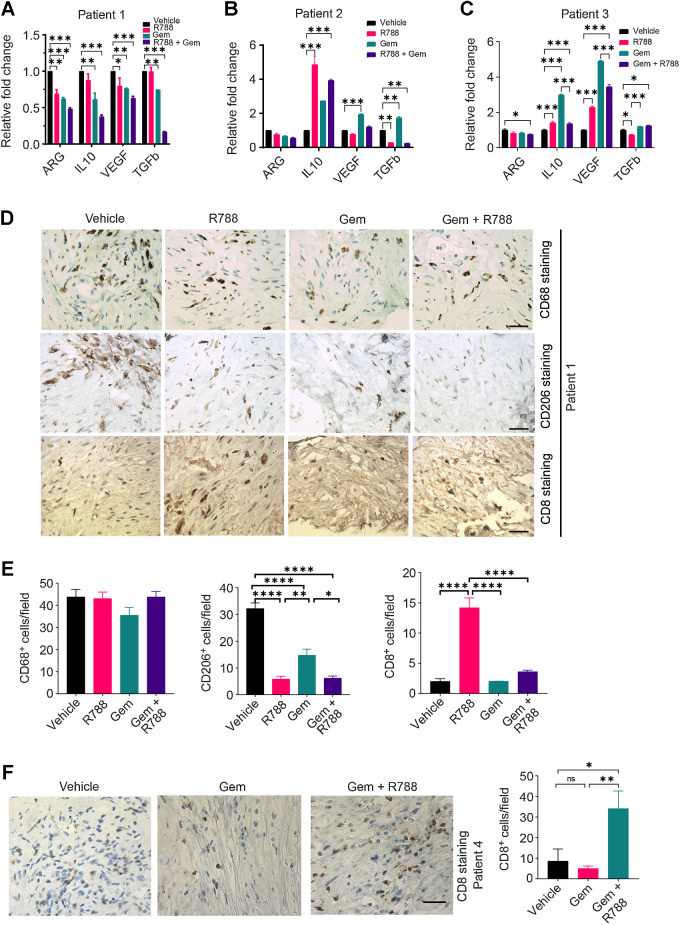
Pancreatic ductal adenocarcinoma (PDAC) is an insidious disease with a low 5-year survival rate. PDAC is characterized by infiltration of abundant tumor-associated macrophages (TAM), which promote immune tolerance and immunotherapeutic resistance. Here we report that macrophage spleen tyrosine kinase (Syk) promotes PDAC growth and metastasis. In orthotopic PDAC mouse models, genetic deletion of myeloid Syk reprogrammed macrophages into immunostimulatory phenotype, increased the infiltration, proliferation, and cytotoxicity of CD8+ T cells, and repressed PDAC growth and metastasis. Furthermore, gemcitabine (Gem) treatment induced an immunosuppressive microenvironment in PDAC by promoting protumorigenic polarization of macrophages. In contrast, treatment with the FDA-approved Syk inhibitor R788 (fostamatinib) remodeled the tumor immune microenvironment, "re-educated" protumorigenic macrophages towards an immunostimulatory phenotype and boosted CD8+ T-cell responses in Gem-treated PDAC in orthotopic mouse models and an ex vivo human pancreatic slice culture model. These findings illustrate the potential of Syk inhibition for enhancing the antitumor immune responses in PDAC and support the clinical evaluation of R788 either alone or together with Gem as a potential treatment strategy for PDAC.

Significance: Syk blockade induces macrophage polarization to an immunostimulatory phenotype, which enhances CD8+ T-cell responses and improves gemcitabine efficacy in pancreatic ductal adenocarcinoma, a clinically challenging malignancy.


Figures

None
Graphical abstract
Figure 1. Syk-positive macrophages accumulate in murine and human PDAC. A and B, Left, IHC or IF staining of human invasive PDAC patient sample and normal pancreas for CD68 (A) and SYK (B). Scale bar, 20 μm. Right, quantification of CD68+ macrophages or SYK+ cells/40× microscopic field in the tissue sections (n = 3). The tissue sections were stained with DAPI to detect nuclei in B. Statistical significance was determined by Student t test. C and D, Relative SYK mRNA expression in human PDAC as compared with normal pancreas tissue in data set GSE15471 (C) and scRNA-seq data set (CRA001160; D). Statistical significance was determined by Wilcoxin-signed rank test. E, Western blot images showing expression of Syk and β-actin in cell lines, B cells, T cells, BMDMs, and TAMs. F, Syk expression in macrophages, B cells, and nonimmune cells in human PDAC, using scRNA-seq data set (CRA001160). G, Figure shows IF staining of Syk (red) and CD68 (aqua) in a tissue section from human invasive PDAC. The dual-positive cells are indicated by arrows. Scale bar, 10 μm. H, FACS quantification of pSyk348+ CD11b+F4/80+ cells in normal pancreas and KPC1245 PDAC (n = 3). I, Immunoblot showing pSyk348 activation in Panc02 PDAC TAMs stimulated with Fc gamma ligation, 1 μg/mL LPS, or adhered to H296 (ligand for α4β1). **, P < 0.01; ****, P < 0.0001. N.S., no stimulation.
Figure 1.
Syk-positive macrophages accumulate in murine and human PDAC. A and B, Left, IHC or IF staining of human invasive PDAC patient sample and normal pancreas for CD68 (A) and SYK (B). Scale bar, 20 μm. Right, quantification of CD68+ macrophages or SYK+ cells/40× microscopic field in the tissue sections (n = 3). The tissue sections were stained with DAPI to detect nuclei in B. Statistical significance was determined by Student t test. C and D, Relative SYK mRNA expression in human PDAC as compared with normal pancreas tissue in data set GSE15471 (C) and scRNA-seq data set (CRA001160; D). Statistical significance was determined by Wilcoxin-signed rank test. E, Western blot images showing expression of Syk and β-actin in cell lines, B cells, T cells, BMDMs, and TAMs. F, Syk expression in macrophages, B cells, and nonimmune cells in human PDAC, using scRNA-seq data set (CRA001160). G, Figure shows IF staining of Syk (red) and CD68 (aqua) in a tissue section from human invasive PDAC. The dual-positive cells are indicated by arrows. Scale bar, 10 μm. H, FACS quantification of pSyk348+ CD11b+F4/80+ cells in normal pancreas and KPC1245 PDAC (n = 3). I, Immunoblot showing pSyk348 activation in Panc02 PDAC TAMs stimulated with Fc gamma ligation, 1 μg/mL LPS, or adhered to H296 (ligand for α4β1). **, P < 0.01; ****, P < 0.0001. N.S., no stimulation.
Figure 2. Macrophage Syk regulates immunosuppression, PDAC growth, and metastasis. A, Panc02 and KPC1245 tumors were orthotopically implanted into SykMC-WT and SykMC-KO mice according to the depicted schema. B and C, Left, weights of pancreata containing Panc02 (B) or KPC1245 (C) tumors from SykMC-WT and SykMC-KO mice. Right panels of B and C show quantification of metastatic nodules in colonic lymph nodes and liver. Significance testing was performed by nonparametric t tests. D, Left, representative images showing trichrome, αSMA, and CD31 staining in KPC1245 PDAC tumors. Scale bar, 50 μm. Right, CD31 quantification. E, FACS quantification of CD3+, CD4+, and CD8+ T cells in Panc02 PDAC tumors. F, Left, IHC of KPC1245-PDAC tumors for CD3, CD4+, and CD8. Scale bar, 20 μm. Right, immunodetection of T cells/microscopic field (n = 3). G, Top, IF staining of CD8 (yellow), DAPI (blue), and Ki67 (red) in KPC1245-PDAC tumors. Bottom, quantification data. Scale bar, 10 μm. H, mRNA expression of Ifng, Gzm, and Prf in orthotopic SykMC-WT and SykMC-KO Panc02 tumors. Statistical significance was determined using the Student t test or one-way ANOVA with Tukey post hoc multiple pairwise testing when analyzing more than two groups. *, P < 0.05; **, P < 0.01; ***, P < 0.001; ****, P < 0.0001; ns, not significant.
Figure 2.
Macrophage Syk regulates immunosuppression, PDAC growth, and metastasis. A, Panc02 and KPC1245 tumors were orthotopically implanted into SykMC-WT and SykMC-KO mice according to the depicted schema. B and C, Left, weights of pancreata containing Panc02 (B) or KPC1245 (C) tumors from SykMC-WT and SykMC-KO mice. Right panels of B and C show quantification of metastatic nodules in colonic lymph nodes and liver. Significance testing was performed by nonparametric t tests. D, Left, representative images showing trichrome, αSMA, and CD31 staining in KPC1245 PDAC tumors. Scale bar, 50 μm. Right, CD31 quantification. E, FACS quantification of CD3+, CD4+, and CD8+ T cells in Panc02 PDAC tumors. F, Left, IHC of KPC1245-PDAC tumors for CD3, CD4+, and CD8. Scale bar, 20 μm. Right, immunodetection of T cells/microscopic field (n = 3). G, Top, IF staining of CD8 (yellow), DAPI (blue), and Ki67 (red) in KPC1245-PDAC tumors. Bottom, quantification data. Scale bar, 10 μm. H, mRNA expression of Ifng, Gzm, and Prf in orthotopic SykMC-WT and SykMC-KO Panc02 tumors. Statistical significance was determined using the Student t test or one-way ANOVA with Tukey post hoc multiple pairwise testing when analyzing more than two groups. *, P < 0.05; **, P < 0.01; ***, P < 0.001; ****, P < 0.0001; ns, not significant.
Figure 3. Syk promotes immunosuppressive programing of macrophages in vitro and in vivo. A and B, Representative FACS plots (left) and FACS quantification (right) of MHCII+ TAMs (A) and CD206+ TAMs (B) in representative KPC1245 tumors from SykMC-WT and SykMC-KO mice (n = 4). Cells were gated on CD11b+F4/80+Gr1− TAMs. C, Relative mRNA expression of genes in TAMs isolated from orthotopic SykMC-WT and SykMC-KO Panc02 tumors. D, Relative mRNA expression of genes in nonstimulated (N.S.) and IL4-stimulated SykMC-WT and SykMC-KO BMDMs as determined by RNA sequencing. E and F, Relative mRNA expression of genes in R788-treated macrophages polarized with IL4 in vitro (E) or KPC1245-TCM induced TAMs in vitro (F). G, Weight of R788-treated and control-treated orthotopic tumors from SykMC-WT and SykMC-KO mice (n = 5). *, P < 0.05; **, P < 0.01; ***, P < 0.001; ****, P < 0.0001; ns, not significant.
Figure 3.
Syk promotes immunosuppressive programing of macrophages in vitro and in vivo. A and B, Representative FACS plots (left) and FACS quantification (right) of MHCII+ TAMs (A) and CD206+ TAMs (B) in representative KPC1245 tumors from SykMC-WT and SykMC-KO mice (n = 4). Cells were gated on CD11b+F4/80+Gr1 TAMs. C, Relative mRNA expression of genes in TAMs isolated from orthotopic SykMC-WT and SykMC-KO Panc02 tumors. D, Relative mRNA expression of genes in nonstimulated (N.S.) and IL4-stimulated SykMC-WT and SykMC-KO BMDMs as determined by RNA sequencing. E and F, Relative mRNA expression of genes in R788-treated macrophages polarized with IL4 in vitro (E) or KPC1245-TCM induced TAMs in vitro (F). G, Weight of R788-treated and control-treated orthotopic tumors from SykMC-WT and SykMC-KO mice (n = 5). *, P < 0.05; **, P < 0.01; ***, P < 0.001; ****, P < 0.0001; ns, not significant.
Figure 4. Syk inhibition reduces tumor growth and sensitizes PDAC tumors to gemcitabine. A, Schemas for the administration of R788 or anti-PDL1 mAb or Gem in Panc02 or KPC1245 tumors. B and C, Weights of pancreata from Panc02 (B) and KPC1245 (C) tumors treated with drugs (n = 5) as depicted in schema in A. D, Metastatic nodules in treated KPC1245 (n = 5) PDAC tumors. Significance testing was performed by one-way ANOVA with Tukey post hoc multiple pairwise testing. E, Weights of pancreata from KPC1242 tumors treated with drugs (n = 5) as depicted in schema. F, Images showing Trichrome staining in PDAC tumors. Scale bar, 50 μm. *, P < 0.05; **, P < 0.01; ***, P < 0.001; ****, P < 0.0001; ns, not significant.
Figure 4.
Syk inhibition reduces tumor growth and sensitizes PDAC tumors to gemcitabine. A, Schemas for the administration of R788 or anti-PDL1 mAb or Gem in Panc02 or KPC1245 tumors. B and C, Weights of pancreata from Panc02 (B) and KPC1245 (C) tumors treated with drugs (n = 5) as depicted in schema in A. D, Metastatic nodules in treated KPC1245 (n = 5) PDAC tumors. Significance testing was performed by one-way ANOVA with Tukey post hoc multiple pairwise testing. E, Weights of pancreata from KPC1242 tumors treated with drugs (n = 5) as depicted in schema. F, Images showing Trichrome staining in PDAC tumors. Scale bar, 50 μm. *, P < 0.05; **, P < 0.01; ***, P < 0.001; ****, P < 0.0001; ns, not significant.
Figure 5. R788 overcomes Gem-induced immunosuppression and increases cytotoxic T cells in PDAC. A–D, FACS quantification of intratumoral CD45+ cells (A), CD11b+ cells (B), CD11b+Gr1−F4/80+ TAMs (C), and CD206+ TAMs (D) in end-stage KPC1245 tumors (n = 4) from Fig. 4C. E, Relative mRNA expression data of immunosuppressive genes in KPC1245 tumors from Fig. 4C (n = 3). F, IHC of KPC1245 PDAC tumors for CD8 (scale bar, 20 μm; top) and IF staining of CD8 (yellow) and Ki67 (red) in KPC1245-PDAC tumors (bottom). G, Quantification of CD8+ cells/40× (n = 3; top) and quantification of Ki67+CD8+ cells/40× (bottom) in tissue sections. Scale bar, 20 μm H. FACS plots (right) and quantification (left) of CD3+, CD4+ CD8+ T cells, CD44+CD62L−, CD69+ T cells in KPC1245 PDAC. I, Relative mRNA expression of Ifnγ and Gzmb in KPC1245 tumors (n = 3). J, Top, schema showing administration of different drugs together with anti-CD8 depleting antibodies. Bottom, weight of pancreata containing KPC1245 tumors. Significance testing was performed by one-way ANOVA with Tukey post hoc multiple pairwise testing. *, P < 0.05; **, P < 0.01; ***, P < 0.001; ****, P < 0.0001; ns, not significant.
Figure 5.
R788 overcomes Gem-induced immunosuppression and increases cytotoxic T cells in PDAC. AD, FACS quantification of intratumoral CD45+ cells (A), CD11b+ cells (B), CD11b+Gr1F4/80+ TAMs (C), and CD206+ TAMs (D) in end-stage KPC1245 tumors (n = 4) from Fig. 4C. E, Relative mRNA expression data of immunosuppressive genes in KPC1245 tumors from Fig. 4C (n = 3). F, IHC of KPC1245 PDAC tumors for CD8 (scale bar, 20 μm; top) and IF staining of CD8 (yellow) and Ki67 (red) in KPC1245-PDAC tumors (bottom). G, Quantification of CD8+ cells/40× (n = 3; top) and quantification of Ki67+CD8+ cells/40× (bottom) in tissue sections. Scale bar, 20 μm H. FACS plots (right) and quantification (left) of CD3+, CD4+ CD8+ T cells, CD44+CD62L, CD69+ T cells in KPC1245 PDAC. I, Relative mRNA expression of Ifnγ and Gzmb in KPC1245 tumors (n = 3). J, Top, schema showing administration of different drugs together with anti-CD8 depleting antibodies. Bottom, weight of pancreata containing KPC1245 tumors. Significance testing was performed by one-way ANOVA with Tukey post hoc multiple pairwise testing. *, P < 0.05; **, P < 0.01; ***, P < 0.001; ****, P < 0.0001; ns, not significant.
Figure 6. R788 remodels immune microenvironment in KPC GEMM PDAC slice culture. A, Schematic representation of slice culture technique used for generating human and KPC GEMM PDAC slices. B–H, Relative mRNA expression of immune-response genes in the KPC GEMM PDAC slices treated with either 250 nmol/L Gem or 2.5 μmol/L R788 or a combination of both drugs. I, Concentration of MCP-1 (CCL2) in Gem and/or R788-treated slices. Significance testing was performed by one-way ANOVA with Tukey post hoc multiple pairwise testing. ns, not significant; *, P < 0.05; **, P < 0.01; ***, P < 0.001; ****, P < 0.0001.
Figure 6.
R788 remodels immune microenvironment in KPC GEMM PDAC slice culture. A, Schematic representation of slice culture technique used for generating human and KPC GEMM PDAC slices. BH, Relative mRNA expression of immune-response genes in the KPC GEMM PDAC slices treated with either 250 nmol/L Gem or 2.5 μmol/L R788 or a combination of both drugs. I, Concentration of MCP-1 (CCL2) in Gem and/or R788-treated slices. Significance testing was performed by one-way ANOVA with Tukey post hoc multiple pairwise testing. ns, not significant; *, P < 0.05; **, P < 0.01; ***, P < 0.001; ****, P < 0.0001.
Figure 7. R788 reduces the expression of markers associated with immunosuppressive TAMs and augments immunostimulatory responses in human PDAC slice culture ex vivo. A–C, Relative mRNA expression of immunosuppressive genes in the human PDAC slices treated with either 250 nmol/L Gem and/or 2.5 μmol/L R788 from patient 1 (A), patient 2 (B), and patient 3 (C). Significance testing was performed by one-way ANOVA with Tukey post hoc multiple pairwise testing. D and E, IHC (D) of human PDAC slices derived from donor 1 for CD206+, CD68+ macrophages, and CD8+ T cells (scale bar, 20 μm) and quantification (E) of CD68+, CD206+, and CD8+ cells/40× field. F, IHC of human PDAC slices derived from patient 4 for CD8+ T cells. Scale bar, 20 μm. *, P < 0.05; **, P < 0.01; ***, P < 0.001; ****, P < 0.0001; ns, not significant.
Figure 7.
R788 reduces the expression of markers associated with immunosuppressive TAMs and augments immunostimulatory responses in human PDAC slice culture ex vivo. AC, Relative mRNA expression of immunosuppressive genes in the human PDAC slices treated with either 250 nmol/L Gem and/or 2.5 μmol/L R788 from patient 1 (A), patient 2 (B), and patient 3 (C). Significance testing was performed by one-way ANOVA with Tukey post hoc multiple pairwise testing. D and E, IHC (D) of human PDAC slices derived from donor 1 for CD206+, CD68+ macrophages, and CD8+ T cells (scale bar, 20 μm) and quantification (E) of CD68+, CD206+, and CD8+ cells/40× field. F, IHC of human PDAC slices derived from patient 4 for CD8+ T cells. Scale bar, 20 μm. *, P < 0.05; **, P < 0.01; ***, P < 0.001; ****, P < 0.0001; ns, not significant.

References

    1. Rawla P, Sunkara T, Gaduputi V. Epidemiology of pancreatic cancer: global trends, etiology and risk factors. World J Oncol 2019;10:10–27. - PMC - PubMed
    1. McGuigan A, Kelly P, Turkington RC, Jones C, Coleman HG, McCain RS. Pancreatic cancer: a review of clinical diagnosis, epidemiology, treatment and outcomes. World J Gastroenterol 2018;24:4846–61. - PMC - PubMed
    1. Siegel RL, Miller KD, Fuchs HE, Jemal A. Cancer statistics, 2022. CA Cancer J Clin 2022;72:7–33. - PubMed
    1. Conroy T, Desseigne F, Ychou M, Bouche O, Guimbaud R, Becouarn Y, et al. FOLFIRINOX versus gemcitabine for metastatic pancreatic cancer. N Engl J Med 2011;364:1817–25. - PubMed
    1. Von Hoff DD, Ramanathan RK, Borad MJ, Laheru DA, Smith LS, Wood TE, et al. Gemcitabine plus nab-paclitaxel is an active regimen in patients with advanced pancreatic cancer: a phase I/II trial. J Clin Oncol 2011;29:4548–54. - PMC - PubMed

Publication types