. 2023 Jun 12;18(6):e0287123.
doi: 10.1371/journal.pone.0287123. eCollection 2023.

Effects of a short period of postural training on postural stability and vestibulospinal reflexes

Affiliations

Effects of a short period of postural training on postural stability and vestibulospinal reflexes

Claudia Grasso et al. PLoS One. .

Abstract

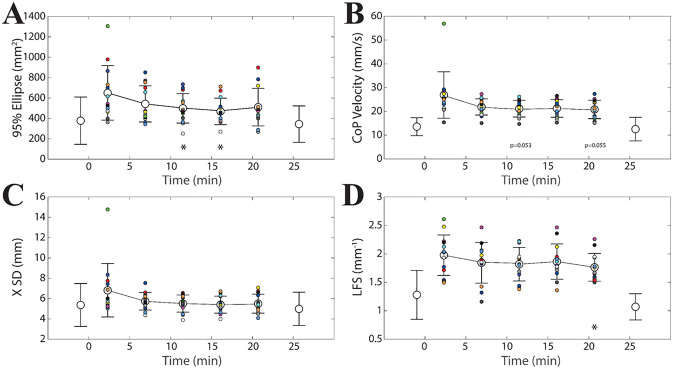
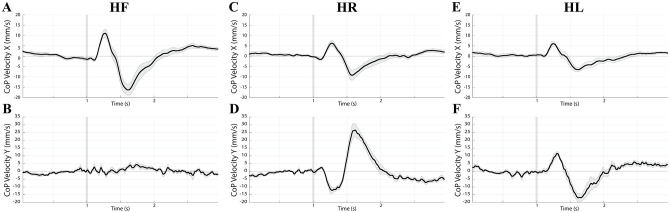
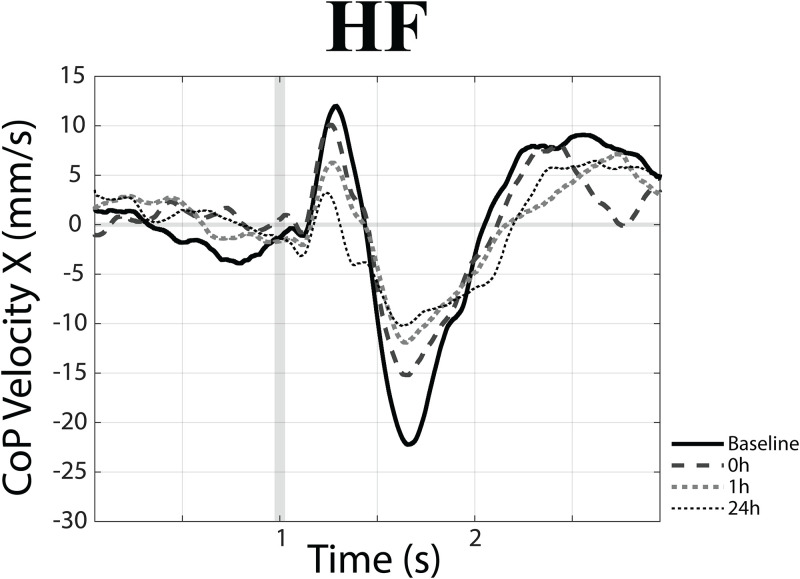
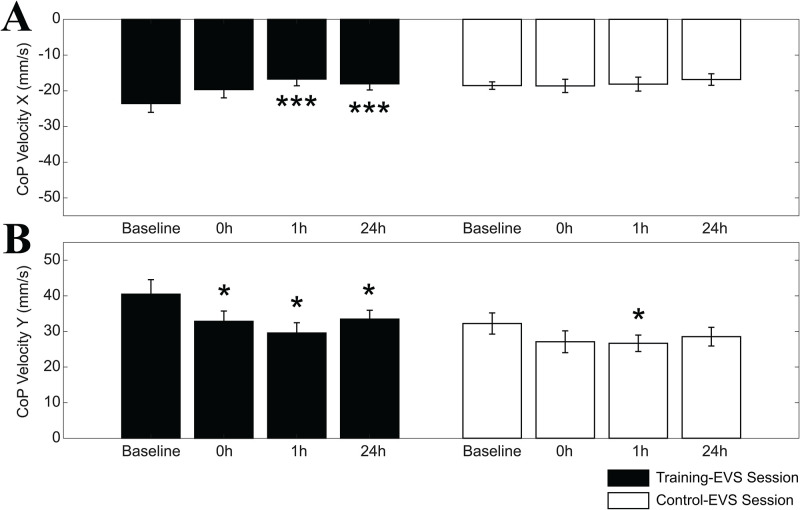
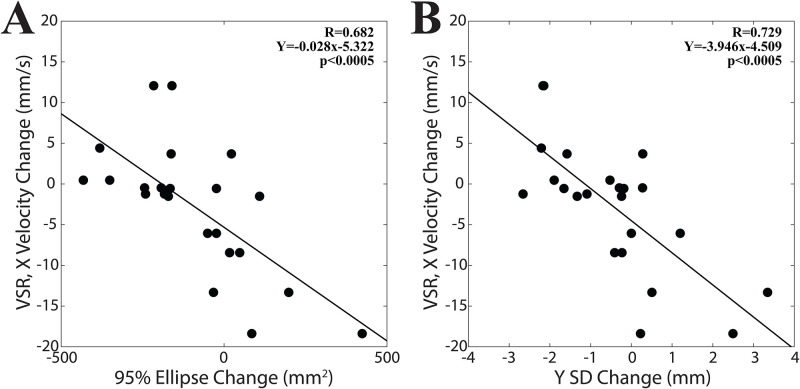
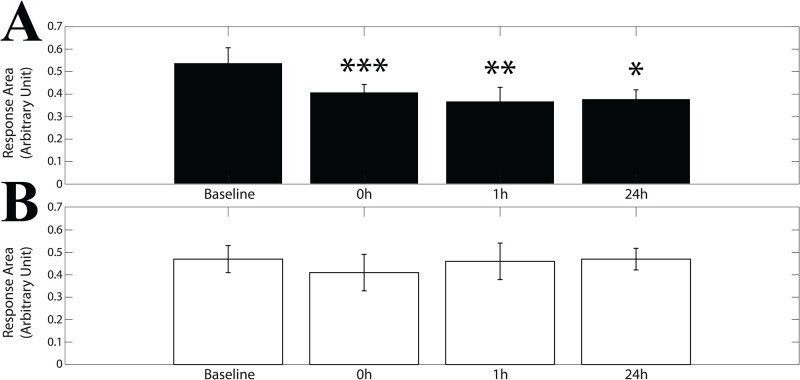
The effects of postural training on postural stability and vestibulospinal reflexes (VSRs) were investigated in normal subjects. A period (23 minutes) of repeated episodes (n = 10, 50 seconds) of unipedal stance elicited a progressive reduction of the area covered by centre of pressure (CoP) displacement, of average CoP displacement along the X and Y axes and of CoP velocity observed in this challenging postural task. All these changes were correlated to each other with the only exception of those in X and Y CoP displacement. Moreover, they were larger in the subjects showing higher initial instability in unipedal stance, suggesting that they were triggered by the modulation of sensory afferents signalling body sway. No changes in bipedal stance occurred soon and 1 hour after this period of postural training, while a reduction of CoP displacement was apparent after 24 hours, possibly due to a beneficial effect of overnight sleep on postural learning. The same period of postural training also reduced the CoP displacement elicited by electrical vestibular stimulation (EVS) along the X axis up to 24 hours following the training end. No significant changes in postural parameters of bipedal stance and VSRs could be observed in control experiments where subjects were tested at identical time points without performing the postural training. Therefore, postural training led to a stricter control of CoP displacement, possibly acting through the cerebellum by enhancing feedforward mechanisms of postural stability and by depressing the VSR, the most important reflex mechanism involved in balance maintenance under challenging conditions.


Conflict of interest statement

The authors have declared that no competing interests exist.

Figures

Fig 1
Fig 1. Effects of EVS on CoP position and velocity.
Grand average of CoP position (A, B) and velocity (C, D) changes elicited by EVS delivered in HL position. Modifications elicited along the X and Y axes are displayed in A/C and B/D, respectively. All the subjects analysed over a 3 seconds time frame have been included (n = 11). In each panel the grey area encompassing the average trace represents SE, while the vertical grey bar depicts the stimulus onset.
Fig 2
Fig 2. Effects of EVS on EMG activity.
Grand average of the EMG response of the right GM to EVS in HL (A) and HR (B) position. All the subjects analysed over a 3 seconds time frame are included (HL: n = 10, HR: n = 11). The surface of the grey area underlying the peak activity (response area) was computed as a measure of the EMG evoked-response strength. In each panel the dotted line represents SE, while the vertical grey bar is the stimulus onset. Data are expressed as a percentage of the average value evaluated over the pre-stimulus period.
Fig 3
Fig 3. Training-induced changes in unipedal stance.
Mean±SD values of 95% ellipse (A), CoP velocity (B), X SD (C) and Y SD (D) evaluated in unipedal stance at different time points during postural training. Data plotted in light grey, before and after the training interval, represent average values obtained in bipedal stance on hard support, eyes open. Asterisks indicate significant differences with respect to the first training time interval (0–4.6 minutes). *: p<0.05; **: p<0.02; ***: p<0.01. Single subject data relative to the training period can be identified on the basis of a colour code.
Fig 4
Fig 4. Correlation of training-induced changes in postural variables with their initial training interval values.
Data relative to the second (6.9 minutes), third (11.5 minutes), fourth (16.1 minutes) and fifth (20.7 minutes) time points of the training interval have been reported. A: 95% ellipse. B: CoP velocity. C: X SD. D: Y SD. In all the scatterplots data in ordinate correspond to the difference between the variable value at a given time point and the initial time point value (2.3 minutes). The lines are regression lines evaluated for all the plotted points.
Fig 5
Fig 5. Training-induced changes in unipedal stance observed following EVS.
Mean±SD values of 95% ellipse (A), CoP velocity (B), X SD (C) and LFS (D) evaluated in unipedal stance at different time points during postural training performed following EVS. Data plotted in light grey, before and after the training interval, represent average values obtained in bipedal stance on hard support, eyes open. Asterisks indicate significant differences with respect to the first training time interval (0–4.6 minutes). *: p<0.05; **: p<0.02; ***: p<0.01. Single subject data relative to the training period can be identified on the basis of a colour code.
Fig 6
Fig 6. Head position effects on EVS-elicited changes in CoP velocity.
Grand average of baseline CoP velocity changes elicited by EVS delivered in HF (A, B, n = 10), HR (C, D, n = 12) and HL (E, F, n = 11) position. Panels A, C, E and B, D, F, represent modifications elicited along the X and Y axes, respectively. All the subjects analysed over a 3 seconds time frame have been included. In each panel the grey area encompassing the average trace represents SE, while the vertical grey bar is the stimulus onset.
Fig 7
Fig 7. EVS-elicited changes in CoP velocity at different time points.
EVS-elicited changes in the X component of CoP velocity observed in a representative subject (HF position) at different time points (baselinecontrol, 0h, 1h, 24h) with respect to postural training.
Fig 8
Fig 8. Time changes in X and Y components of CoP velocity to EVS.
Mean±ES values of X (A) and Y (B) components of CoP velocity (V) changes evaluated at different time points. The training-EVS and the control-EVS sessions are represented by the black and white bars, respectively. Measurements were taken before the unipedal training/rest period (baseline), soon after (0h), as well as 1 hour (1h) and 24 hours (24h) later. Asterisks refer to significant differences with respect to baseline. *: p<0.05; **: p<0.02; ***: p<0.01.
Fig 9
Fig 9. Correlations between changes in body sway and EVS-evoked CoP responses elicited by postural training.
A. Relation between the changes observed during the last two time points of postural training in 95% ellipse (A) and Y SD (B), and those in the EVS-evoked CoP responses recorded along the X axis (HL position). In both A and B, negative values along the ordinate axis indicated largest drops of the peak-to-peak CoP velocity.
Fig 10
Fig 10. EVS-elicited changes in EMG activity.
Grand average of the EMG response recorded from the left (A, C, E) and right (B, D, F) to EVS in HF (A, B), HR (C, D) and HL (E, F) position, at the beginning of the training session (baseline). All the subjects analysed over a 3 seconds time frame have been included (HF: n = 9, HL: n = 10, HR: n = 11). In each panel the grey area encompassing the average black line represents SE, while the vertical grey line is the stimulus onset. Data are expressed as a percentage of the average value evaluated over the pre-stimulus period.
Fig 11
Fig 11. Training-related changes in EVS-evoked EMG responses of right and left muscles.
Mean±SE of response area absolute values evaluated across different head positions (HF, HR and HL) and muscles (GM and GL) for both right (A) and left (B) sides. Measurements were taken before (baseline), soon after (0h), as well as 1 hour (1h) and 24 hours (24h) after the training/rest period. Asterisks refer to significant differences with respect to control. *: p<0.05; **: p<0.02; ***: p<0.01.

Similar articles

Cited by

References

    1. Paillard T. Plasticity of the postural function to sport and/or motor experience. Neurosci Biobehav Rev. 2017;72: 129–152. doi: 10.1016/j.neubiorev.2016.11.015 - DOI - PubMed
    1. Kiers H, van Dieën J, Dekkers H, Wittink H, Vanhees L. A systematic review of the relationship between physical activities in sports or daily life and postural sway in upright stance. Sports Med. 2013;43: 1171–1189. doi: 10.1007/s40279-013-0082-5 - DOI - PubMed
    1. Low DC, Walsh GS, Arkesteijn M. Effectiveness of Exercise Interventions to Improve Postural Control in Older Adults: A Systematic Review and Meta-Analyses of Centre of Pressure Measurements. Sports Med. 2017;47: 101–112. doi: 10.1007/s40279-016-0559-0 - DOI - PMC - PubMed
    1. Huang Y, Liu X. Improvement of balance control ability and flexibility in the elderly Tai Chi Chuan (TCC) practitioners: a systematic review and meta-analysis. Arch Gerontol Geriatr. 2015;60: 233–238. doi: 10.1016/j.archger.2014.10.016 - DOI - PubMed
    1. DiStefano LJ, Clark MA, Padua DA. Evidence supporting balance training in healthy individuals: a systemic review. J Strength Cond Res. 2009;23: 2718–2731. doi: 10.1519/JSC.0b013e3181c1f7c5 - DOI - PubMed

Publication types