. 2023 Jun 12;19(6):e1010684.
doi: 10.1371/journal.pcbi.1010684. eCollection 2023 Jun.

Spatial dynamics of malaria transmission

Affiliations

Spatial dynamics of malaria transmission

Sean L Wu et al. PLoS Comput Biol. .

Abstract

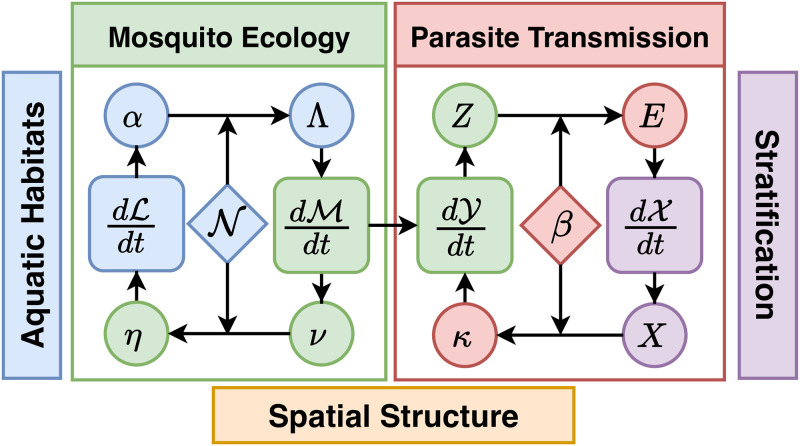
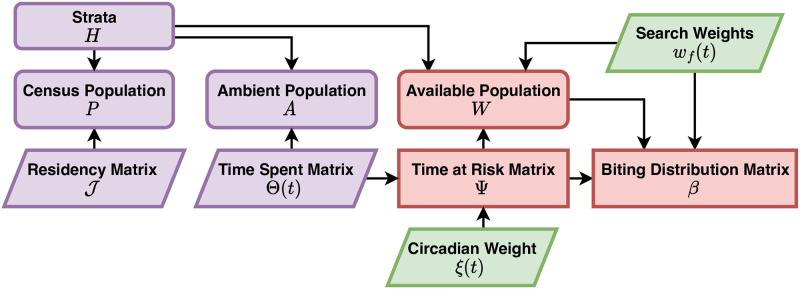
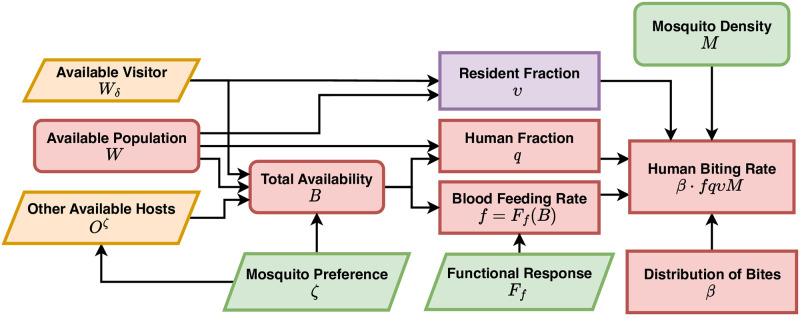
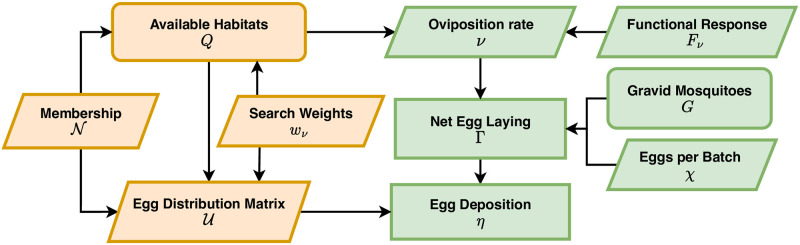
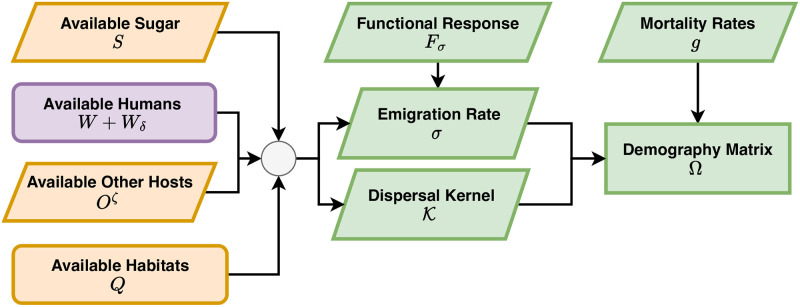
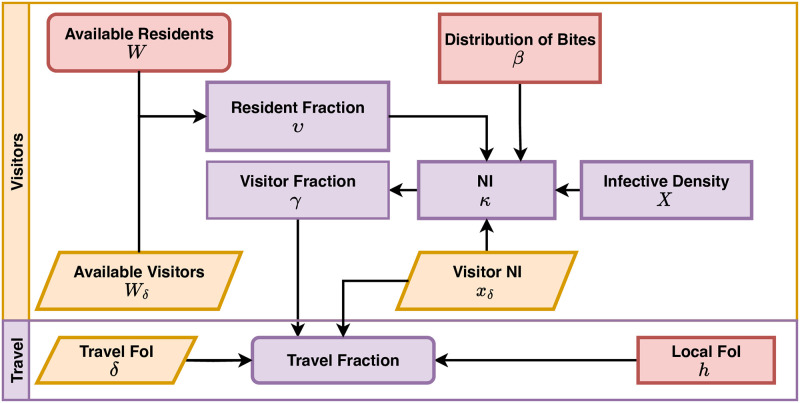
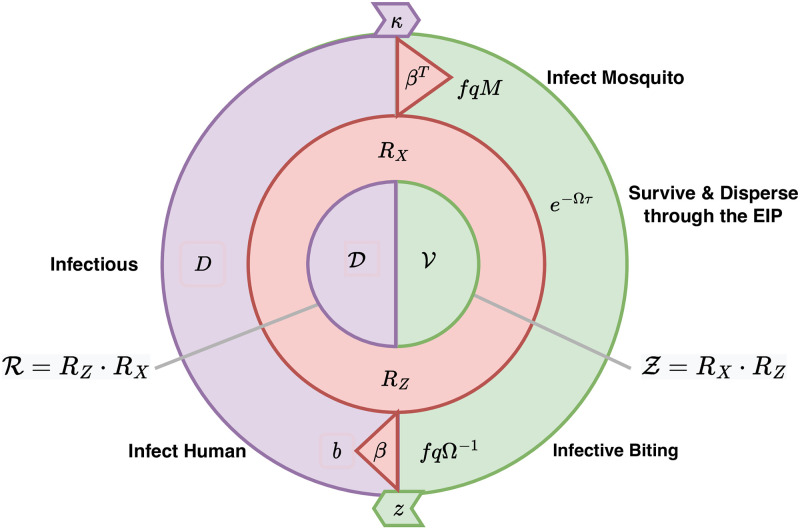
The Ross-Macdonald model has exerted enormous influence over the study of malaria transmission dynamics and control, but it lacked features to describe parasite dispersal, travel, and other important aspects of heterogeneous transmission. Here, we present a patch-based differential equation modeling framework that extends the Ross-Macdonald model with sufficient skill and complexity to support planning, monitoring and evaluation for Plasmodium falciparum malaria control. We designed a generic interface for building structured, spatial models of malaria transmission based on a new algorithm for mosquito blood feeding. We developed new algorithms to simulate adult mosquito demography, dispersal, and egg laying in response to resource availability. The core dynamical components describing mosquito ecology and malaria transmission were decomposed, redesigned and reassembled into a modular framework. Structural elements in the framework-human population strata, patches, and aquatic habitats-interact through a flexible design that facilitates construction of ensembles of models with scalable complexity to support robust analytics for malaria policy and adaptive malaria control. We propose updated definitions for the human biting rate and entomological inoculation rates. We present new formulas to describe parasite dispersal and spatial dynamics under steady state conditions, including the human biting rates, parasite dispersal, the "vectorial capacity matrix," a human transmitting capacity distribution matrix, and threshold conditions. An [Formula: see text] package that implements the framework, solves the differential equations, and computes spatial metrics for models developed in this framework has been developed. Development of the model and metrics have focused on malaria, but since the framework is modular, the same ideas and software can be applied to other mosquito-borne pathogen systems.


Conflict of interest statement

The authors declare no competing interests.

Figures

Fig 1
Fig 1. Models for malaria transmission dynamics are naturally modular (see Eq 1).
The dynamic modules describe a stratified human population (purple) that interacts through blood feeding (red) with adult mosquito populations in a discrete spatial domain; each patch could contain a set of aquatic habitats. Two components, L and M, describe mosquito ecology: dynamics of immature mosquitoes (blue) in aquatic habitats are described by a system of equations dL/dt; and dynamics of adult mosquitoes (green) are described by dM/dt. Habitat locations within patches are described by a membership matrix, N. Eggs hatch into larval mosquitoes, that develop, pupate, and later emerge from habitats as mature adults (α) and added to the adult populations in each patch (Λ). Adults lay eggs (ν), which are distributed spatially according to which patch habitats belong (N). Egg deposition rates at the habitats are (η). Two additional components, Y and X, describe parasite infection dynamics and transmission: that for mosquitoes, described by dY/dt and in humans, described by dX/dt, are linked through parasite transmission. A new model for blood feeding describes how blood meals are allocated among humans (β) and associated parasite transmission rates: the density of infectious humans by strata (X) is used to compute net infectiousness (NI) of humans to mosquitoes in patches (κ); and the density of infectious blood feeding mosquitoes (Z) is used to compute the entomological inoculation rate (EIR) on each strata (E).
Fig 2
Fig 2. Denominators and mixing.
A schematic diagram relating various concepts of population density under a model of human mobility, resulting in a biting distribution matrix, β. Here, and and in Figs 3–6, rounded rectangles denote endogenous state variables, sharp rectangles denote endogenous dynamical quantities, and parallelograms represent exogenous data or factors. Purple indicates the element is related to human populations, green for mosquitoes, and red for biting and transmission. Population strata (H) describe how persons are allocated across demographic characteristics. The matrix J distributes these strata across space (patch), according to place of residency. By combining information on how people spend their time across space (Θ(t)) and mosquito activity (ξ(t)) a time at risk (TaR) matrix Ψ is generated describing how person-time at risk is distributed across space. Because blood feeding can be modified by human and mosquito factors (e.g., net use and biting preferences), search weights (wf(t)) may further weight person-time at risk. The final result is a biting distribution matrix β, which is the fraction of each bite in each patch that would arise on an individual in each stratum, so diag(H) ⋅ β = 1.
Fig 3
Fig 3. Blood feeding and human biting rates.
The daily human biting rates (HBR) for the resident population strata are defined as the expected number of bites by vectors, per person, per day. To compute the HBR, we count up exposure over all the patches where residents spend time. We also consider the presence of visitors and other blood hosts (yellow input), which increases the total available hosts.
Fig 4
Fig 4. Egg laying and egg deposition.
The availability of aquatic habitats (Q) the patch sum of habitat search weights (Q=N·wν), and the egg distribution matrix (U) describes the locally normalized search weights. Available habitat determines per-capita oviposition rates (ν) by the population of gravid mosquitoes (G) in a patch through a functional response to availability, Fν(Q). The net egg laying rate, per-patch, is Γ = χνG. The eggs are distributed among the aquatic habitats (U) so that the egg deposition rates in habitats is η=U·Γ.
Fig 5
Fig 5. Adult mosquito demography is defined by survival and dispersal.
Mobility rates and dispersal are determined by the available of resources: aquatic habitats (Q), available humans (W + Wδ) and other blood hosts (Oζ), and sugar (S). The emigration rate is a functional response (Fσ) that increases if any one of the resources is missing. Resource availability and distance also play a role in computing the dispersal kernel, K, that determines where mosquitoes land if they leave a patch. When combined with mortality, a matrix Ω is produced which describes the behavior of adult mosquitoes after emergence.
Fig 6
Fig 6
To model malaria importation, we define a travel FoI for each stratum, δ(t), and two set of terms to model the role of visitors in mosquito blood feeding and parasite transmission: the available visitor population Wδ and the NI for the visitor population, by patch xδ. To model blood feeding and transmission, we compute a patch-specific resident fraction for blood feeding, υ, the fraction of all biting that occurs on a resident of the spatial domain. From this, we can compute the visitor reservoir fraction, γ, the travel fraction for incidence, and other measures of malaria importation.
Fig 7
Fig 7. A spatial life-cycle model.
A diagram that illustrates how the parameters describing each stage in the parasite’s life-cycle translate into a parasite’s reproductive success spatially, when mosquitoes and hosts move. The right half of the circle represents mosquitoes and the left half humans. The flow of events is clockwise. Mosquitoes must blood feed to become infected (fqM), and then survive and disperse through the EIP (e−Ωτ). infectious bites are distributed as long as a mosquito survives, while it blood feeds and disperses (fqΩ−1). The bites are distributed among humans (β) and some of them cause an infection (b). Parasites are transmitted for as long as humans remain infectious, measured in terms of the human transmitting capacity (HTC, or D days). Infectious humans are distributed wherever humans spend time at risk (affecting β). These processes are summarized differently to model parasite dispersal and parasite reproductive success. Dispersal counts from bite to bite using the VC matrix (V) and the HTC matrix (D). Threshold computations count from when a host becomes infectious to measure a parasite’s reproductive success in infectious mosquitoes (RZ); in infectious humans (RX); from human to humans among strata after a human becomes infectious (R); and from mosquito to mosquitoes (Z). R0 is the lead eigenvalue of R or Z. Under endemic conditions, we can also consider how frequently parasites are actually transmitted by including the probability a mosquito gets infected κ, and the probability a mosquito is infectious, given by the sporozoite rate z.
Fig 8
Fig 8. An important practical concern is spatial granularity of patches for simulation-based studies.
For Bioko Island, Equatorial Guinea, for example, we could define patches at several scales: the whole island; or approximately 240 occupied areas (1km × 1km, the squares); approximately 4, 400 occupied 100m × 100m sectors (points); or 8 distinct regions (the colors of the squares); or clusters of contiguous sectors (the colors of the points); or approximately 70,000 individual households. An important concern is that the weight of evidence—the number of observations per patch—declines sharply as granularity of the simulations increases. This framework makes it possible to define a set of nested (or partially nested) studies that modify the number and size of patches, which requires modifying the human and mosquito mobility sub-models, but that holds other aspects of the model constant.
Fig 9
Fig 9
(Left): bulk transmission metric describing transmission from the most densely populated area in Malabo, the capitol city, seen as the bright cell in the Northern tip of the island, to all other populated areas. (Right): bulk transmission from the most highly populated area in the south of the island (Luba), seen as the bright cell in the small harbor on the Western coast of the island. The base layer was created by to support malaria control operations [62] and shared under a CC BY 4.0 license. It is [available online] at https://figshare.com/articles/online_resource/Shape_Files_for_Bioko_Island_Equatorial_Guinea/22287580.
Fig 10
Fig 10. Structural elements of the framework are flexible to facilitate building models that are appropriate for various settings.
These diagrams illustrate two examples. left) A forest malaria model with seven patches (including 3 villages and 2 campsites), 6 population strata, and 5 aquatic habitats. The village residents are stratified into loggers and other residents. Loggers from different villages spend time at home or in campsites, which have no permanent residents. Aquatic habitats (the moons) can be in villages, in campsites, or in patches near villages. Some villages (e.g. village 3), could lack mosquitoes but still have populations at risk. Right) It is also possible to model indoor and outdoor blood feeding with indoor and outdoor patches that share the same place. In these models, movement indoors vs. outdoors in the same place is modeled differently from movement among outdoor patches.

References

    1. Smith DL, Battle KE, Hay SI, Barker CM, Scott TW, McKenzie FE. Ross, Macdonald, and a theory for the dynamics and control of mosquito-transmitted pathogens. PLoS Pathog. 2012;8(4):e1002588. doi: 10.1371/journal.ppat.1002588 - DOI - PMC - PubMed
    1. Reiner RC Jr, Perkins TA, Barker CM, Niu T, Chaves LF, Ellis AM, et al. A systematic review of mathematical models of mosquito-borne pathogen transmission: 1970-2010. J R Soc Interface. 2013;10(81):20120921. doi: 10.1098/rsif.2012.0921 - DOI - PMC - PubMed
    1. Smith DL, Perkins TA, Reiner RC Jr, Barker CM, Niu T, Chaves LF, et al. Recasting the theory of mosquito-borne pathogen transmission dynamics and control. Trans R Soc Trop Med Hyg. 2014;108(4):185–197. doi: 10.1093/trstmh/tru026 - DOI - PMC - PubMed
    1. Levin S. The Problem of Relevant Detail. In: Busenberg S, Martelli M, editors. Differential Equations Models in Biology, Epidemiology and Ecology: Proceedings of a Conference held in Claremont California, January 13–16, 1990. Berlin, Heidelberg: Springer Berlin Heidelberg; 1991. p. 9–15.
    1. Radcliffe J. The initial geographical spread of host-vector and carrier-borne epidemics. J Appl Probab. 1973;10(4):703–717. doi: 10.2307/3212374 - DOI