. 2023 Jun 20;120(25):e2213815120.
doi: 10.1073/pnas.2213815120. Epub 2023 Jun 12.

Anthropogenic climate change impacts exacerbate summer forest fires in California

Affiliations

Anthropogenic climate change impacts exacerbate summer forest fires in California

Marco Turco et al. Proc Natl Acad Sci U S A. .

Abstract

Record-breaking summer forest fires have become a regular occurrence in California. Observations indicate a fivefold increase in summer burned area (BA) in forests in northern and central California during 1996 to 2021 relative to 1971 to 1995. While the higher temperature and increased dryness have been suggested to be the leading causes of increased BA, the extent to which BA changes are due to natural variability or anthropogenic climate change remains unresolved. Here, we develop a climate-driven model of summer BA evolution in California and combine it with natural-only and historical climate simulations to assess the importance of anthropogenic climate change on increased BA. Our results indicate that nearly all the observed increase in BA is due to anthropogenic climate change as historical model simulations accounting for anthropogenic forcing yield 172% (range 84 to 310%) more area burned than simulations with natural forcing only. We detect the signal of combined historical forcing on the observed BA emerging in 2001 with no detectable influence of the natural forcing alone. In addition, even when considering fuel limitations from fire-fuel feedbacks, a 3 to 52% increase in BA relative to the last decades is expected in the next decades (2031 to 2050), highlighting the need for proactive adaptations.

Keywords: California; anthropogenic climate change; forest fires.


Conflict of interest statement

The authors declare no competing interest.

Figures

Fig. 1.
Fig. 1.
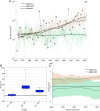
(A) Time series of summer (May to September) forest fire burned area (BA, in red) and spring to summer (April to October) maximum near surface temperature (TSMAX; in black) from 1971 to 2021; (B) observed versus out-of-sample 10-fold predicted changes in BA. Vertical gray lines indicate 2.5th and 97.5th percentiles of 10,000 different predictions. Colors indicate the decade of each sample. The Inset shows a map of California with the domain of interest shaded in gray.
Fig. 2.
Fig. 2.
Attribution of recent climate change considering (A) annual BA; (B) the impact of anthropogenic climate change on BA as a relative change in BA in CMIP6-ALL compared to CMIP6-NAT over 1971 to 1995, 1996 to 2021, and 1971 to 2021; and (C) the scaling factor from the detection analysis. The climate simulations are consistent with the observation if the lower bound of the shaded band is larger than zero. In panel A, the black line represents observed 21-y moving average, while dashed lines with open circles show the observed annual values; the brown and green solid lines represent the 21-y moving averages of the ensemble means of CMIP6-ALL and CMIP6-NAT historical experiments, and the thin brown and green lines are for 12 model ensemble means from CMIP6-ALL and CMIP6-NAT, respectively. In B, the median is shown as a solid line; the box indicates the 25 to 75 percentile range, while the whiskers show the 2.5 to 97.5 percentile range. In C, the brown (green) shaded band shows the 2.5 to 97.5 percentile range of the CMIP6-NAT (CMIP6-ALL) scaling factors. The impact simulations span 10,000 different predictions × 12 GCMs.
Fig. 3.
Fig. 3.
Forest fire area projections using static and dynamic models. (A) Burned areas simulated from CMIP6 climate models and the static climate-fire model (historical forcing until 2014 and SSP2-4.5 forcing 2015 to 2050). Model results are shown as 21-y moving averages to emphasize gradual changes rather than year-to-year fluctuations. Red bars are observations. (B) Time series of trailing 21-y moving average considering both static and dynamic models and (C) mean burned area in the period 2031 to 2050. The median is shown as a solid line; the box indicates the 25 to 75 percentile range, while the whiskers show the 2.5 to 97.5 percentile range. The BA simulations span 10,000 different predictions × 24 GCMs.

References

    1. Williams A. P., et al. , Observed impacts of anthropogenic climate change on wildfire in California. Earth’s Future 7, 892–910 (2019).
    1. Cal FIRE, Top 20 largest California wildfires (2022). Available at: https://www.fire.ca.gov/media/4jandlhh/top20_acres.pdf.
    1. Higuera P. E., Abatzoglou J. T., Record-setting climate enabled the extraordinary 2020 fire season in the western United States. Glob. Change Biol. 27, 1–2 (2021). - PubMed
    1. Buechi H., Weber P., Heard S., Cameron D., Plantinga A. J., Long-term trends in wildfire damages in California. Int. J. Wildland Fire 30, 757–762 (2021).
    1. Burke M., et al. , The changing risk and burden of wildfire in the United States. Proc. Natl. Acad. Sci. U.S.A. 118, e2011048118 (2021). - PMC - PubMed