. 2023 Jun 20;120(25):e2303764120.
doi: 10.1073/pnas.2303764120. Epub 2023 Jun 12.

The metabolic rate of the biosphere and its components

Affiliations

The metabolic rate of the biosphere and its components

Tori M Hoehler et al. Proc Natl Acad Sci U S A. .

Abstract

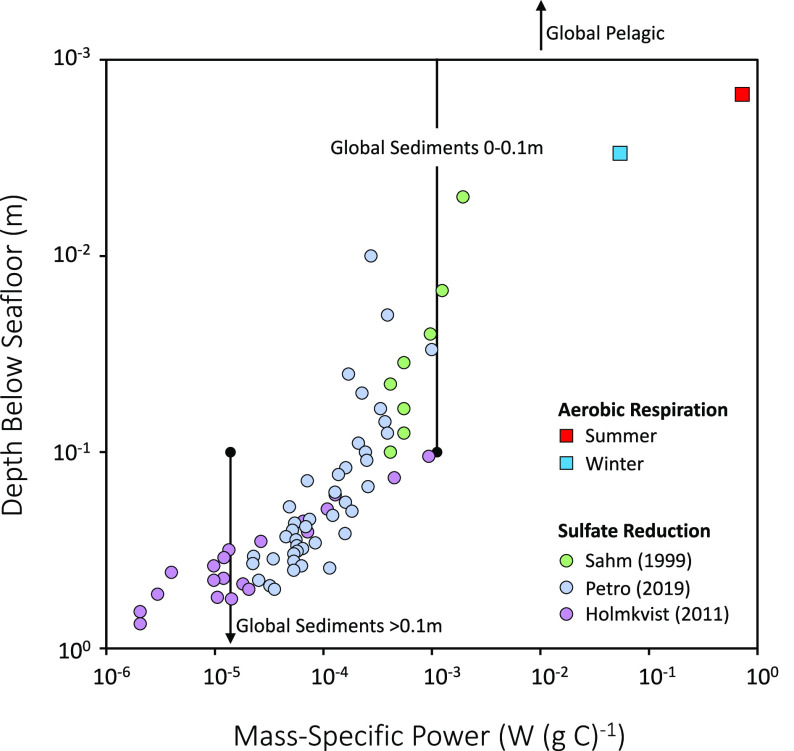
We assessed the relationship between rates of biological energy utilization and the biomass sustained by that energy utilization, at both the organism and biosphere level. We compiled a dataset comprising >10,000 basal, field, and maximum metabolic rate measurements made on >2,900 individual species, and, in parallel, we quantified rates of energy utilization, on a biomass-normalized basis, by the global biosphere and by its major marine and terrestrial components. The organism-level data, which are dominated by animal species, have a geometric mean among basal metabolic rates of 0.012 W (g C)-1 and an overall range of more than six orders of magnitude. The biosphere as a whole uses energy at an average rate of 0.005 W (g C)-1 but exhibits a five order of magnitude range among its components, from 0.00002 W (g C)-1 for global marine subsurface sediments to 2.3 W (g C)-1 for global marine primary producers. While the average is set primarily by plants and microorganisms, and by the impact of humanity upon those populations, the extremes reflect systems populated almost exclusively by microbes. Mass-normalized energy utilization rates correlate strongly with rates of biomass carbon turnover. Based on our estimates of energy utilization rates in the biosphere, this correlation predicts global mean biomass carbon turnover rates of ~2.3 y-1 for terrestrial soil biota, ~8.5 y-1 for marine water column biota, and ~1.0 y-1 and ~0.01 y-1 for marine sediment biota in the 0 to 0.1 m and >0.1 m depth intervals, respectively.

Keywords: energy metabolism; global energy budget; mass-specific power; metabolic rate.


Conflict of interest statement

The authors declare no competing interest.

Figures

Fig. 1.
Fig. 1.
(A) Basal metabolic power vs. biomass carbon calculated from metabolic rate measurements made on 2912 species. The solid black line is a power law fit to the entire dataset. (B) Mass-specific basal metabolic power (MSP) vs. biomass carbon. The solid black line and shaded region are, respectively, the geometric mean and SD (fivefold) among all species. In both panels, the solid, colored lines are log-log-linear correlations for specific taxonomic groups, identified by the color codes of “Organisms.” The ranges of maximum MSP for birds and mammals and for prokaryotes are denoted by dashed ovals. Note that the maximum MSP range denoted for prokaryotes is specific to a small group of fast-growing organisms and does not represent a broad survey of maximum prokaryote rates. An interactive version of this plot is accessible as "Supplementary Interactive Plot" or at https://doi.org/10.5281/zenodo.7877885.
Fig. 2.
Fig. 2.
Mass-specific power vs. carbon biomass for the global biosphere (red square) and for its marine and terrestrial components (blue and green circles, respectively). For marine and terrestrial primary producers (PP), the parenthetical designation “Photon Capture” refers to the total energy of photons captured into the light reactions of photosynthesis, while “Autotrophic Resp.” refers to the power provided by autotrophic respiration of photosynthetically fixed carbon. The dashed line and shaded region are, respectively, the all-species geometric mean and SD taken from the organism-level data (Fig. 1B), while vertical and horizontal error bars reflect the uncertainties shown in Table 1.
Fig. 3.
Fig. 3.
Mass-specific carbon turnover rate, μ*, vs. mass specific power, MSP, for a range of populations and environments. Diagonal dashed lines denote average biosynthesis yield (Y*) in diverse cultures of heterotrophic microorganisms growing aerobically (Lower line) or anaerobically (Upper line) on a range of substrates (46). data: cultures: aerobic glucose oxidizers: (50)–(52); methanogens: (47), (53); sulfate reducers: (54), (55). Pasture and forest soils: (56). Marine sediments: (44). Marine primary producers: (22); terrestrial primary producers: (57). Humans: (58). SI Appendix, section 4.1 provides further details on the source data and calculations.
Fig. 4.
Fig. 4.
MSP vs. depth in marine sediments from Aarhus Bay, Denmark. Squares: MSP associated with aerobic respiration of organic carbon during the summer (red) and winter (blue). Circles: MSP associated with sulfate-based respiration of organic matter compiled from three studies. Vertical lines denote the global MSP estimates for marine heterotrophs in the water column (“Global pelagic”) and 0 to 0.1 m and >0.1 m sediment layers. MSP is calculated from cell-specific sulfate reduction rates reported in refs. – and from O2 uptake measurements reported in ref.  (SI Appendix, section 4.2).

References

    1. Nagy K. A., Girard I. A., Brown T. K., Energetics of free-ranging mammals, reptiles, and birds. Annu. Rev. Nutr. 19, 247–277 (1999). - PubMed
    1. Makarieva A. M., et al. , Mean mass-specific metabolic rates are strikingly similar across life’s major domains: Evidence for life’s metabolic optimum. Proc. Natl. Acad. Sci. U.S.A. 105, 16994–16999 (2008). - PMC - PubMed
    1. Savage V. M., et al. , The predominance of quarter-power scaling in biology. Funct. Ecol. 18, 257–282 (2004).
    1. Makarieva A. M., Gorshkov V. G., Li B.-L., Energetics of the smallest: Do bacteria breathe at the same rate as whales? Proc. Biol. Sci. 272, 2219–2224 (2005). - PMC - PubMed
    1. Hudson L. N., Isaac N. J. B., Reuman D. C., The relationship between body mass and field metabolic rate among individual birds and mammals. J. Anim. Ecol. 82, 1009–1020 (2013). - PMC - PubMed

Publication types