. 2023 Jun 20;120(25):e2217737120.
doi: 10.1073/pnas.2217737120. Epub 2023 Jun 12.

A unified model for the dynamics of ATP-independent ultrafast contraction

Affiliations

A unified model for the dynamics of ATP-independent ultrafast contraction

Carlos Floyd et al. Proc Natl Acad Sci U S A. .

Abstract

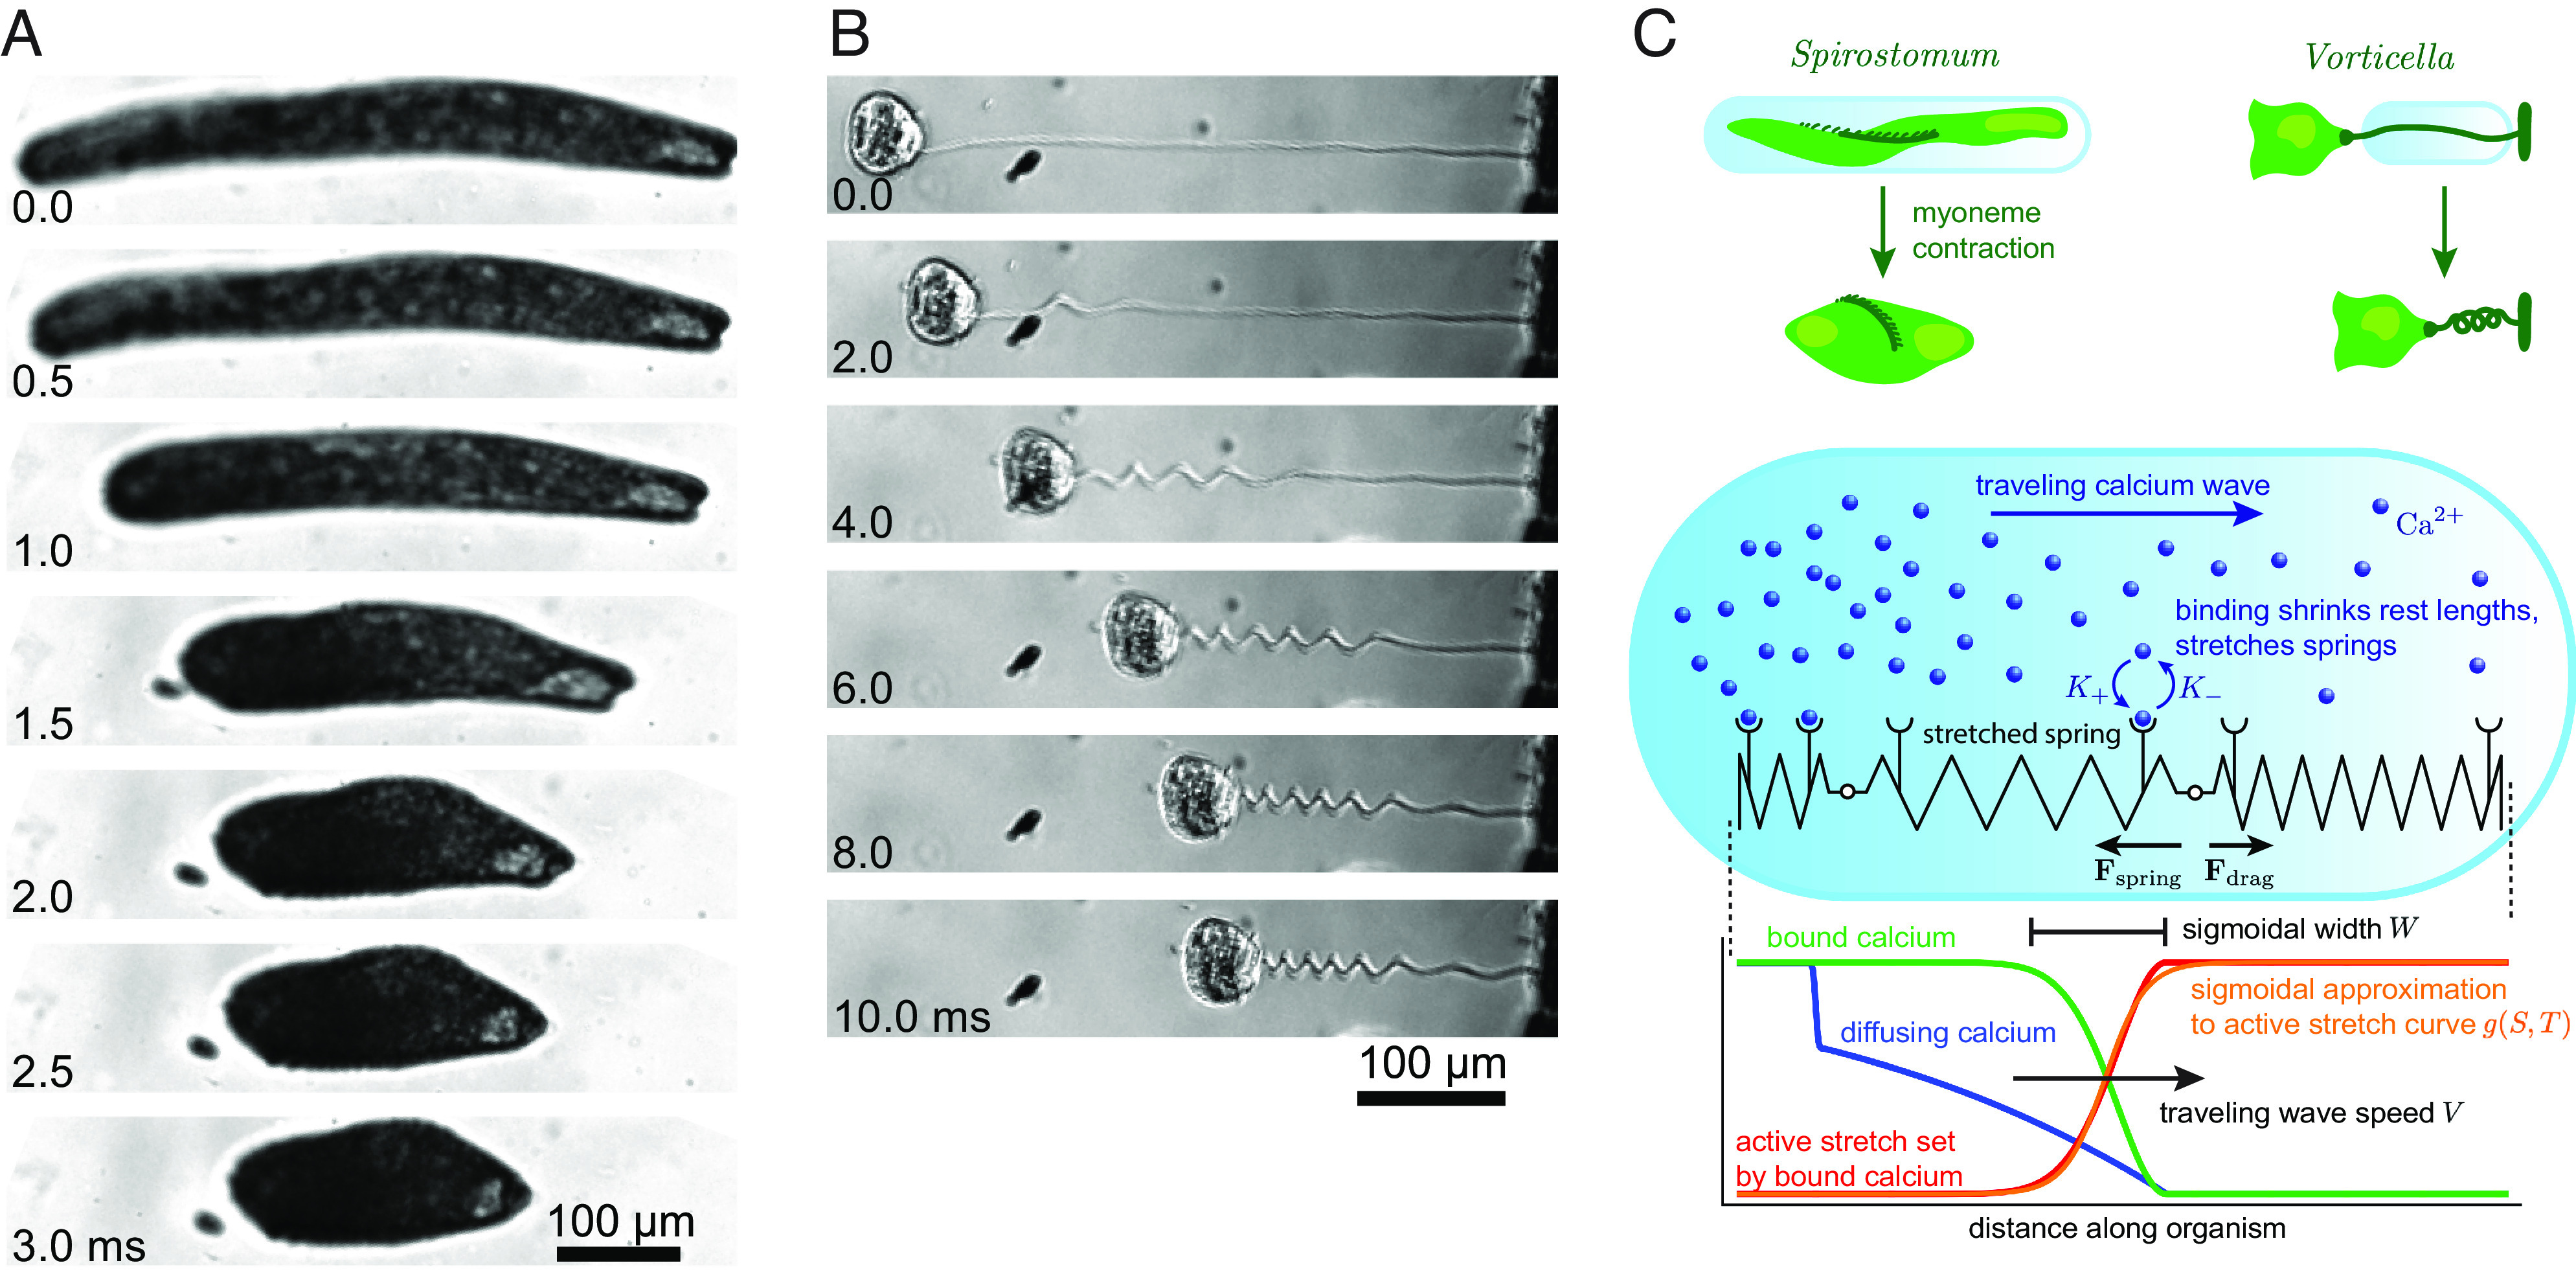
In nature, several ciliated protists possess the remarkable ability to execute ultrafast motions using protein assemblies called myonemes, which contract in response to Ca2+ ions. Existing theories, such as actomyosin contractility and macroscopic biomechanical latches, do not adequately describe these systems, necessitating development of models to understand their mechanisms. In this study, we image and quantitatively analyze the contractile kinematics observed in two ciliated protists (Vorticella sp. and Spirostomum sp.), and, based on the mechanochemistry of these organisms, we propose a minimal mathematical model that reproduces our observations as well as those published previously. Analyzing the model reveals three distinct dynamic regimes, differentiated by the rate of chemical driving and the importance of inertia. We characterize their unique scaling behaviors and kinematic signatures. Besides providing insights into Ca2+-powered myoneme contraction in protists, our work may also inform the rational design of ultrafast bioengineered systems such as active synthetic cells.

Keywords: calcium-powered dynamics; mechanochemical modeling; protist physiology; synthetic biology; ultrafast motion.


Conflict of interest statement

The authors declare no competing interest.

Figures

Fig. 1.
Fig. 1.
Myoneme-based contraction in ciliated protists. (A) Images of Spirostomum undergoing contraction, with the time in milliseconds labeled on the bottom left of each image. Rapid contraction begins at T = 0 ms and is followed by a slower reelongation phase (not depicted). Note that the left side of the organism begins contracting (between 0.5 and 1.0 ms) before the right (between 1.0 and 1.5 ms). (B) Same as (A) for Vorticella. (C) Schematic of the model. The contractile body of Spirostomum and stalk of Vorticella are abstracted as a 1D elastic medium in a viscous environment, represented as a chain of springs. The local spring rest length (depicted as the number of ridges) depends on the number of bound Ca2+ ions (shown as blue spheres bound to receptors on the springs). A rightward traveling Ca2+ wave thus shrinks the spring rest lengths, exerting forces in the chain which then contracts against viscous drag. The bottom graph schematically illustrates several quantities in our mechanochemical model at a fixed time, which we elaborate on in the main text.
Fig. 2.
Fig. 2.
Comparison of the model to experimental data. (A) Five measurements of Spirostomum contraction, collapsed to the same scale by normalizing length using the organism’s uncontracted length L and by offsetting time so that contraction begins around T = 10 ms. Thin lines represent individual contraction events, and we color each differently. The thick black curve shows the model fit to all of these trajectories at once; see SI Appendix, Supplementary Results, section B for fits to the individual curves. Vertical dashed lines indicate the times in the model solution when the center of the active stretch wave arrives at S = 0 and S = L. Time is shifted by choosing O = 10 ms in Eq. 22 to achieve numerical agreement between the boundary and initial conditions (see Material and Methods, Computational methods). (B) The corresponding rate trajectories, obtained by numerically differentiating the data in (A). Colors of individual events are the same as in (A). (C and D) The same as (A) and (B) but for Vorticella contraction. (E) Simulated length trajectories with V = 1 L/ms, α = 2 (L/ms)2, gmin = 0, O = 10 ms, and μ = 10 ms−1. The width W of the wave is varied from 0.1 L to 1.0 L in steps of 0.1 L as the colors range from blue to red. The inset shows how W depends on the binding rate K+ in the Ca2+ model. The total myoneme concentration Btot ranges from 500 to 4, 000 μM in multiples of 2 as the colors range from light green to purple. The dashed line in the inset represents the analytically predicted scaling WK+−1/2. For the remaining parameters used in the Inset, see SI Appendix, Table S4.
Fig. 3.
Fig. 3.
The nondimensional model and its limiting versions capture key kinematic properties of contraction. (A) Nondimensional length λ(t) as a function of time for the three versions of the nondimensional model. Parameter values are ηw, d = ηw, m = 1, w = 0.1, gmin = 0. The vertical lines at t = 2 and 3 indicate the times when the center of the active stretch wave enters and exits the system. The time argument for the quench solution is multiplied by ηw, m so that it can be compared to the other model solutions. For the quench model, the quench occurs at t = 2. (B) Same as (A) but with ηw, m = 2 and ηw, d = 20. (C and D) Scaling of λ˙max with ηw, m (C) and ηw, d (D) for the three models. The colors are the same as in (A). For panel (C), ηw, d is fixed at 8, while for panel (D), ηw, m is fixed at 2. (E) Heatmap of χ, the peak elastic energy stored in the system as a fraction of the maximum possible energy, as ηw, m and ηw, d are varied for the full model. Contours are drawn and labeled at selected values of χ.
Fig. 4.
Fig. 4.
Asymmetric contraction of Spirostomum. (A) A sequence of contours of Spirostomum obtained from 8,000-Hz video imaging. Colors range from yellow to purple as time ranges from 5.5 ms to 8 ms. The initial and final midlines, whose arc lengths determine the measured length of the organism, are drawn in yellow and purple. (B) The trajectory of the length during this contraction event. The dashed curved line shows the trajectory of the simulated model, which was fit to match the experimentally measured solid curve. (C) The displacement trajectories of the top (blue) and bottom (red) ends of the midlines and the corresponding quantities in the fitted model are shown as dashed curves. These displacements were measured by projecting the endpoints to the initial midline curve and computing the arc length from the end to the projected point. Asymmetric contraction can be observed as the top end begins contracting before the bottom end (by a time difference labeled ΔT), a feature that the fitted model reproduces. (D and E) Corresponding to Fig. 3 A and B, the entire x(s, t) curves for the full and quench models. The colors in these panels range from yellow to blue as t increases from 2 to 4 in steps of 0.1. Panels (F) and (G) show the same curves as a function of t, rather than s.
Fig. 5.
Fig. 5.
Experimentally measured contraction rate scaling. (A) Published data on the maximum contraction rate of Vorticella in solutions of different viscosities. Each colored line represents a single cell exposed to varying viscosities; these data are from figure 3B of ref. . The black points represent results from simulations, reproduced from figure 4A in ref. . The circle and square represent two values of the elastic stalk’s Young’s modulus. (B) Published data from figure 2 of ref. on the maximum contraction rate of Spirostomum in different viscosities and confinement methods: Orange represents a setup using plane parallel glass coverslips, and blue represents a setup using an agar channel. Each point represents an average of 10 to 23 measurements, and connecting lines are drawn to guide the eye. (C) Our measurements of the maximum contraction rate of free-swimming Spirostomum in solutions of different viscosities. The published data were extracted from refs. , , and using WebPlotDigitizer (66).
Fig. 6.
Fig. 6.
Schematic illustration of a chemical latch. The Left panel, adapted from ref. , illustrates a mechanical latch-and-spring system. A latch, shown in blue, slides frictionally off of a compressed spring, shown in gray, which allows for a fast release of the stored potential energy. The finite time during which the latch slides is highlighted in orange. The potential and kinetic energies of the system are schematically plotted at the bottom. At smaller scales, such as the scale of a single-cell organism like Spirostomum, a different paradigm accounts for the chemical nature of mechanical activation (via a traveling Ca2+ wave). This is illustrated in the Right panel, where analogous features of the dynamics in the macroscopic case are shown in the corresponding colors. The traveling wave is shown as a blue gradient, which controls the local rest length (indicated as the number of ridges) of internal springs, shown in gray.

References

    1. Murrell M., Oakes P. W., Lenz M., Gardel M. L., Forcing cells into shape: The mechanics of actomyosin contractility. Nat. Rev. Mol. Cell Biol. 16, 486–498 (2015). - PMC - PubMed
    1. Marshall W. F., Don’t blink: Observing the ultra-fast contraction of spasmonemes. Biophys. J. 94, 4–5 (2008). - PMC - PubMed
    1. Weis-Fogh T., Amos W., Evidence for a new mechanism of cell motility. Nature 236, 301–304 (1972). - PubMed
    1. Cachon J., Cachon M., Movement by non-actin filament mechanisms. Biosystems 14, 313–326 (1981). - PubMed
    1. Lynn D. H., The Ciliated Protozoa: Characterization, Classification, and Guide to the Literature (Springer, 2008).

Publication types

LinkOut - more resources