. 2023 Sep 1;11(9):1168-1183.
doi: 10.1158/2326-6066.CIR-22-0465.

Aerobic Exercise Alters the Melanoma Microenvironment and Modulates ERK5 S496 Phosphorylation

Affiliations

Aerobic Exercise Alters the Melanoma Microenvironment and Modulates ERK5 S496 Phosphorylation

Hannah Savage et al. Cancer Immunol Res. .

Abstract

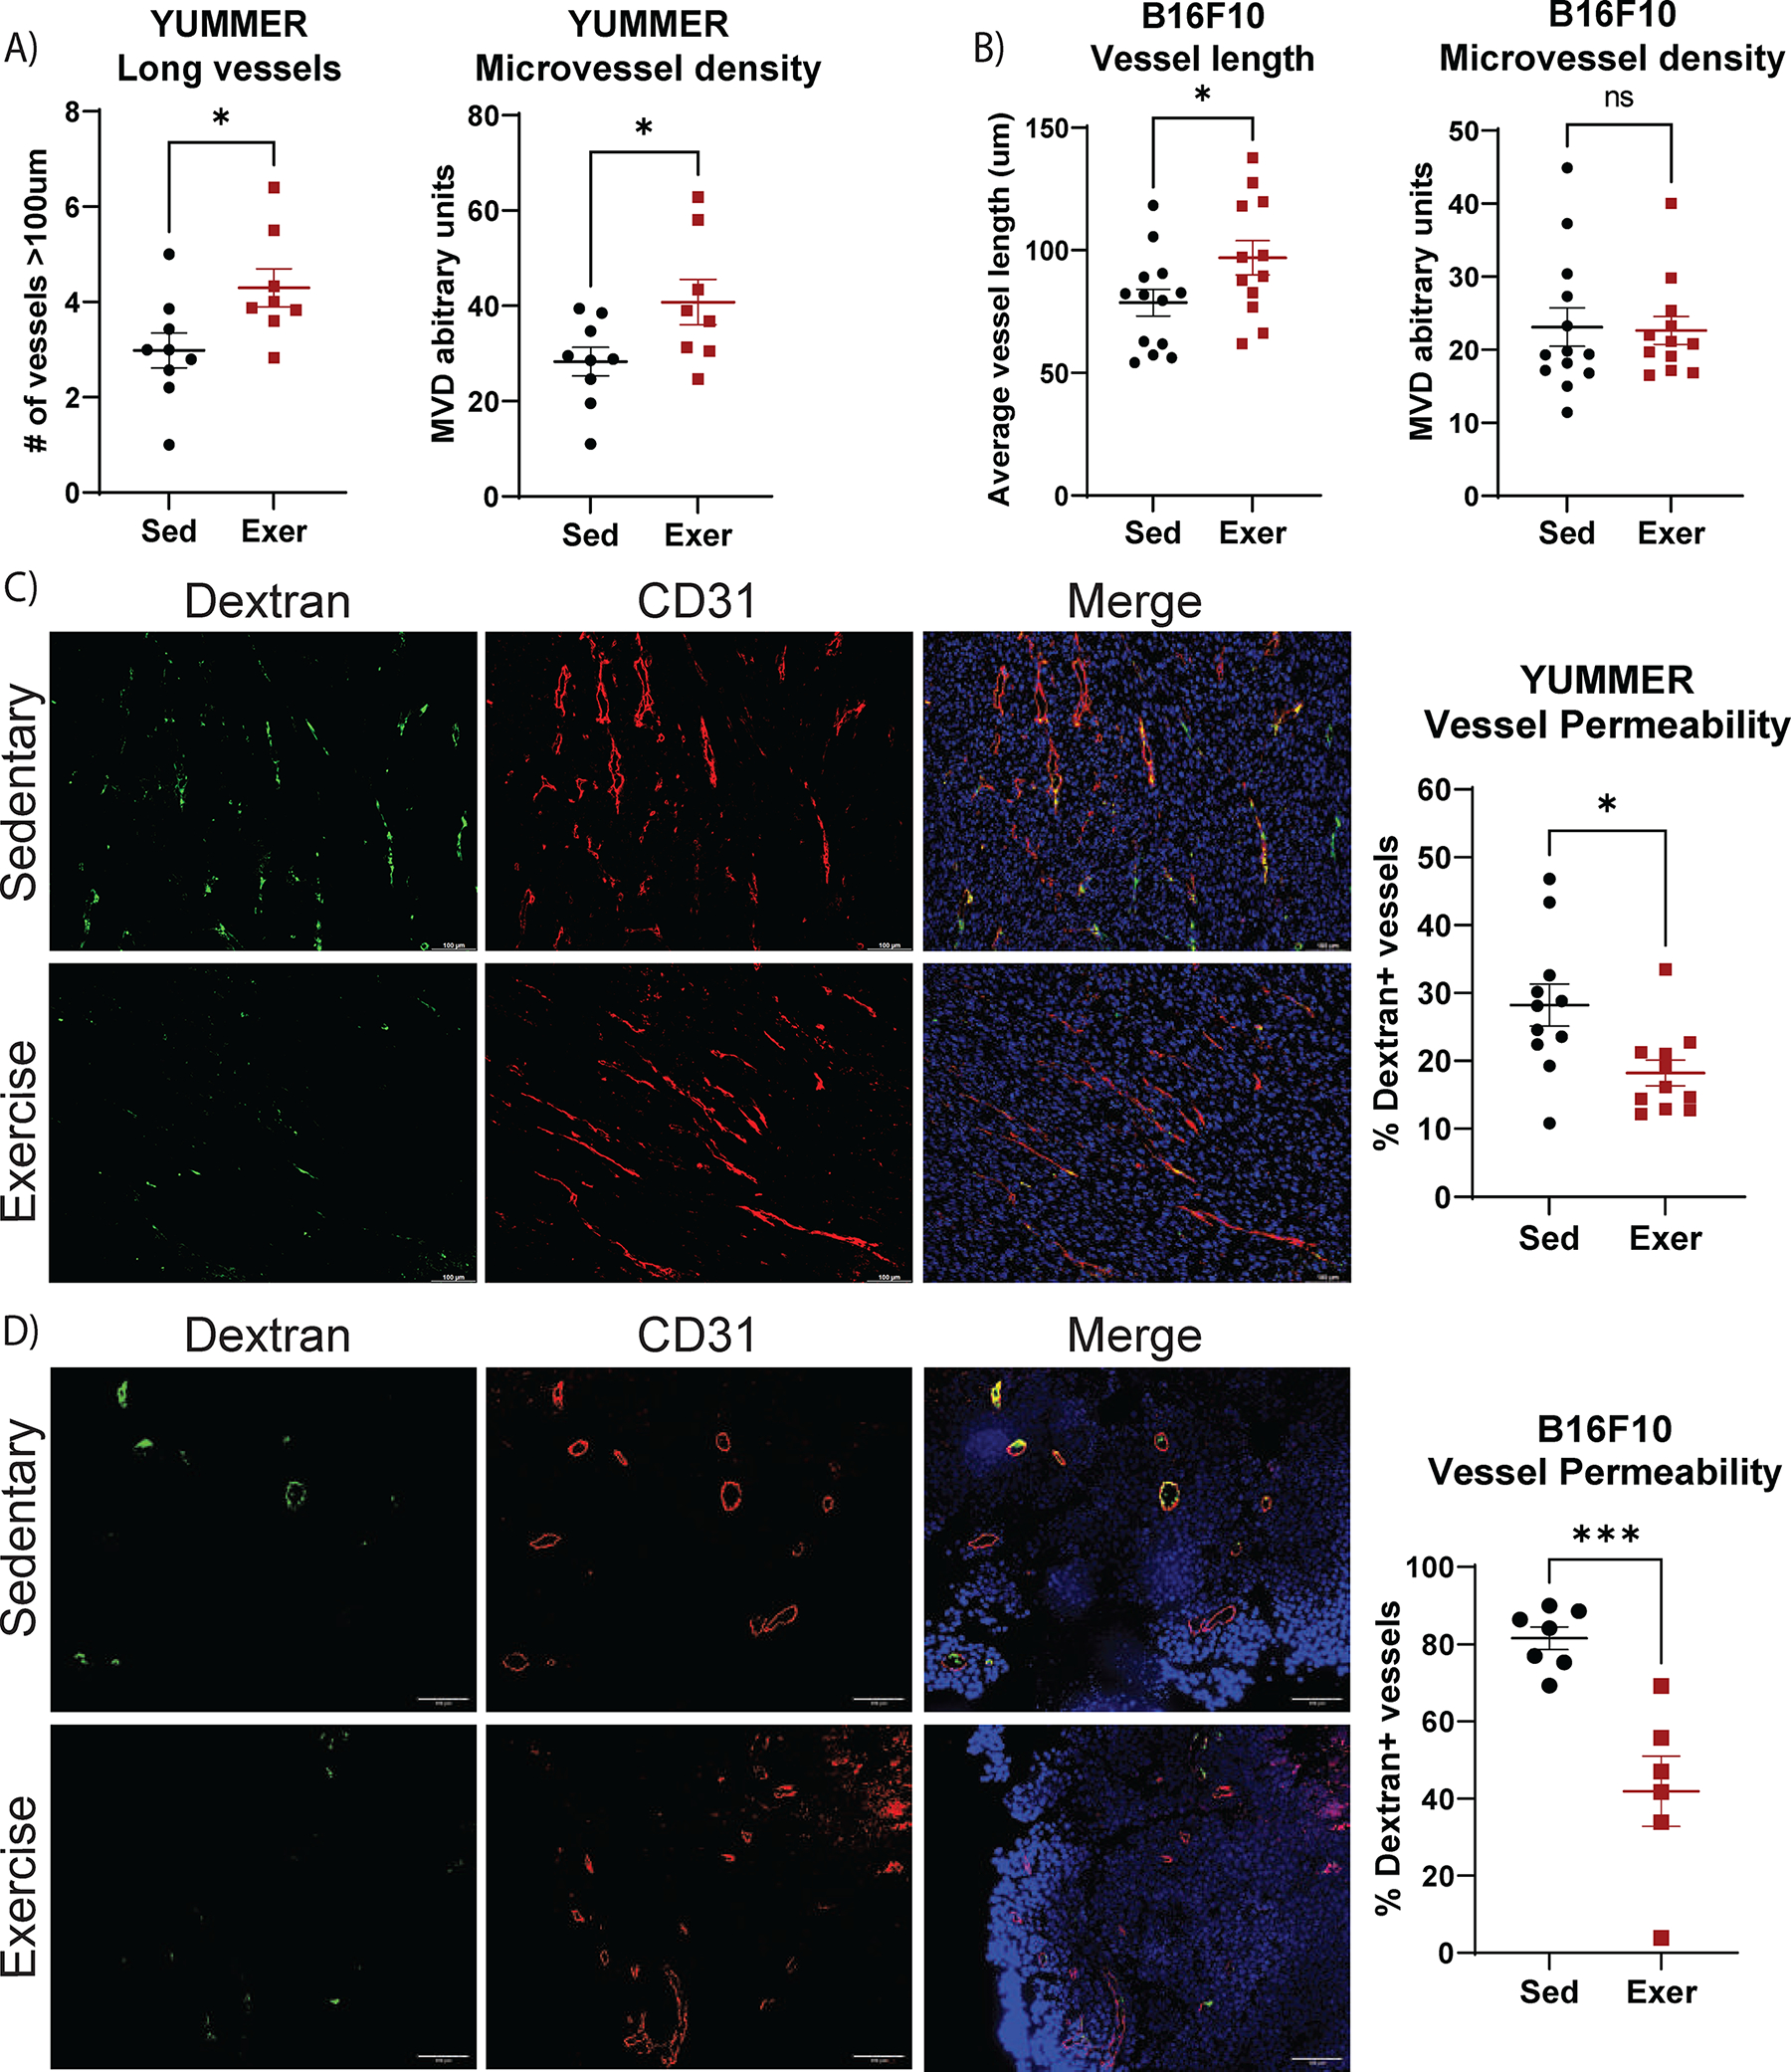
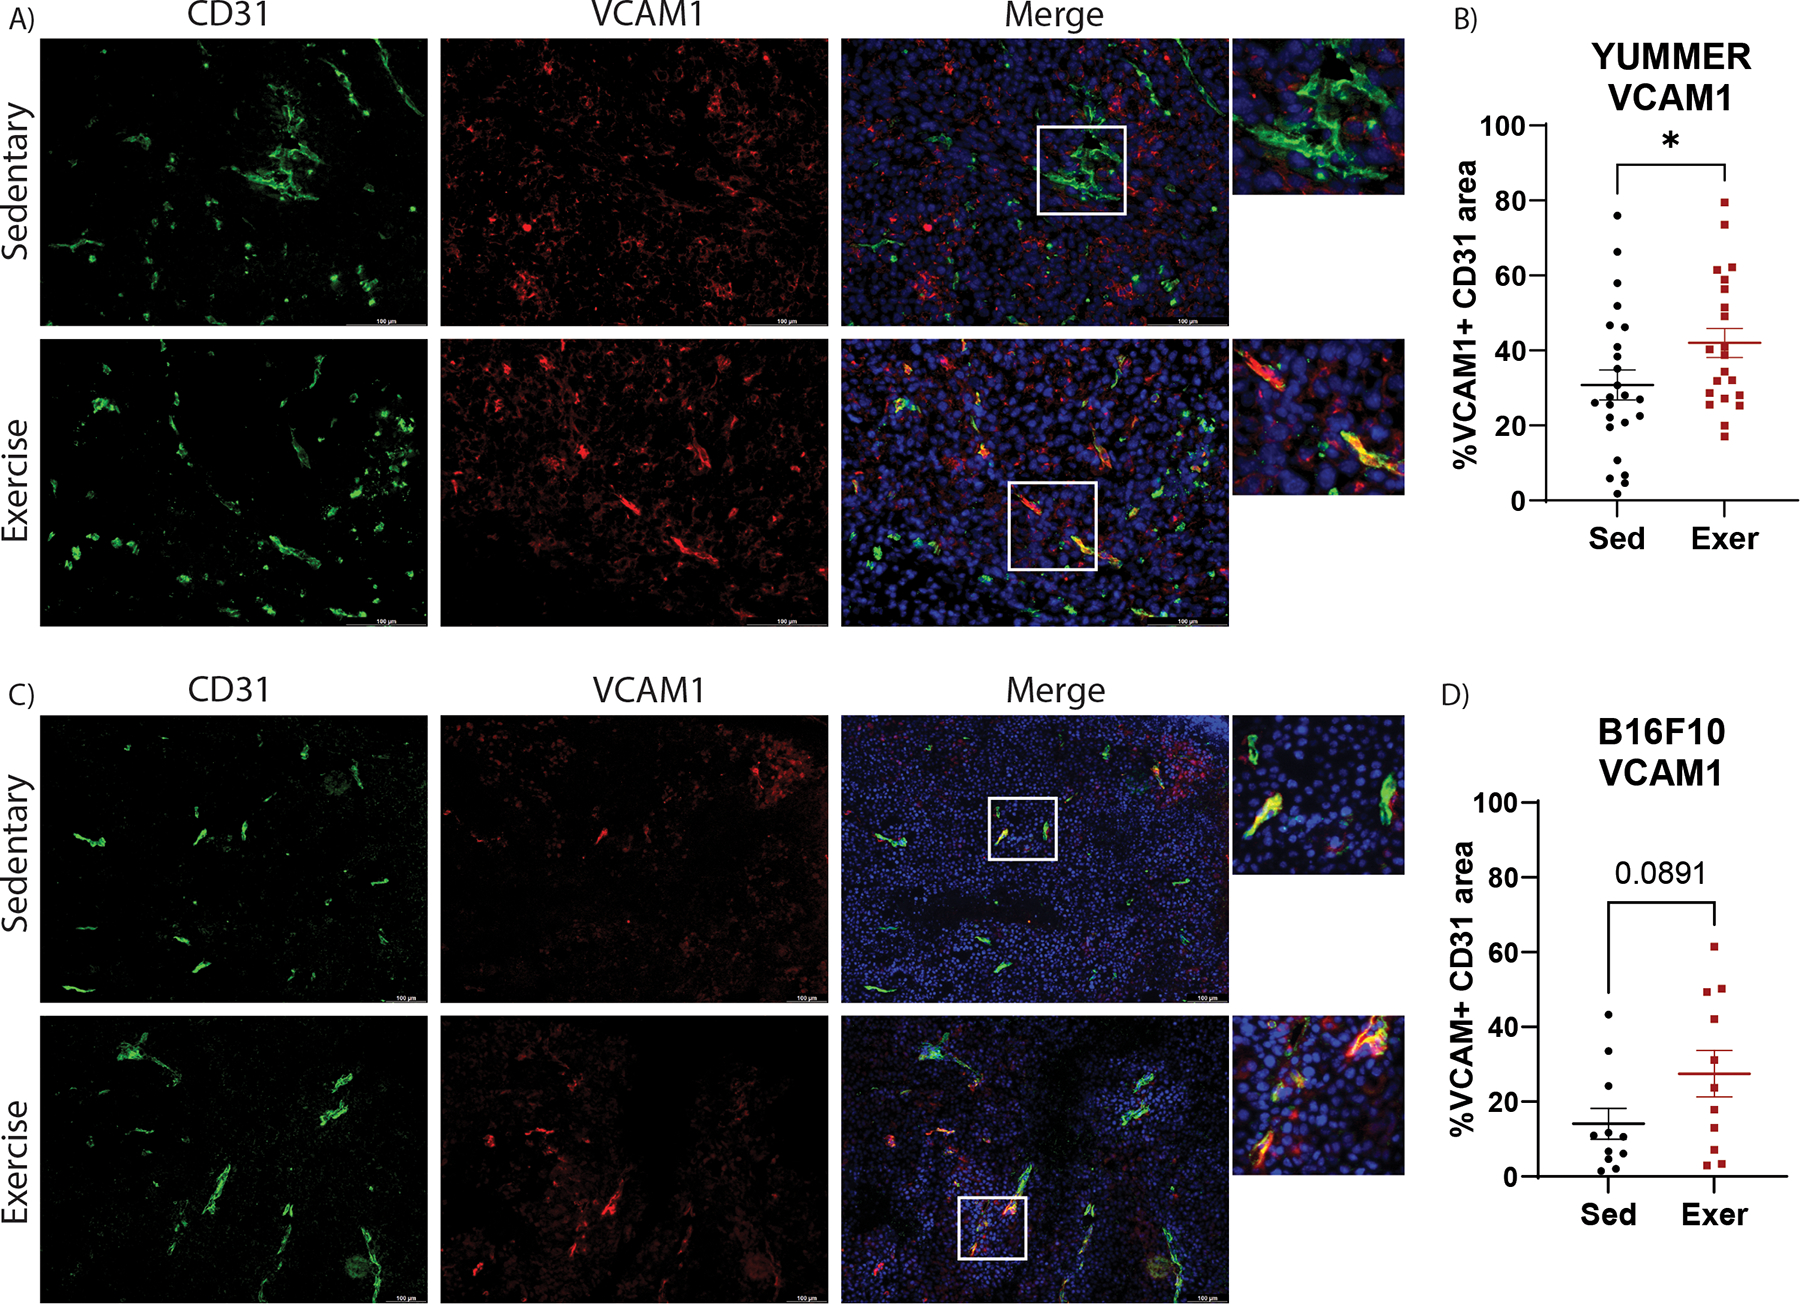
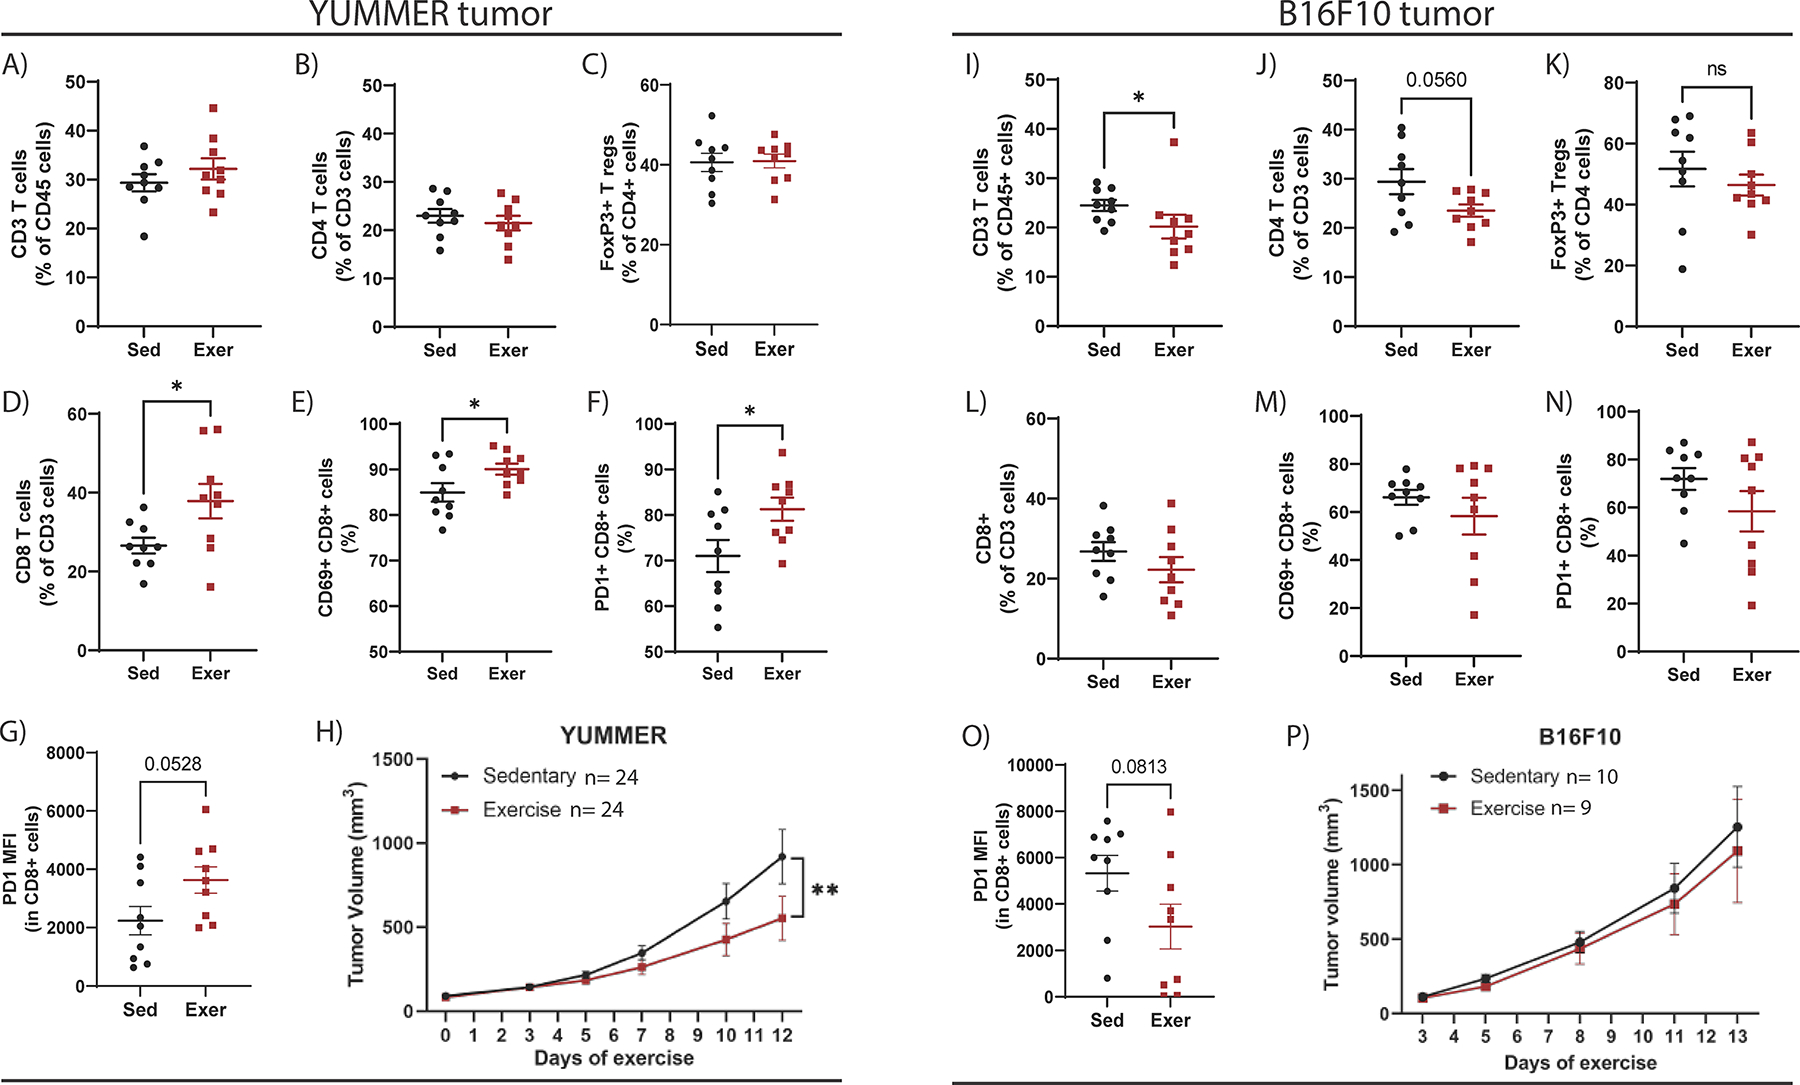
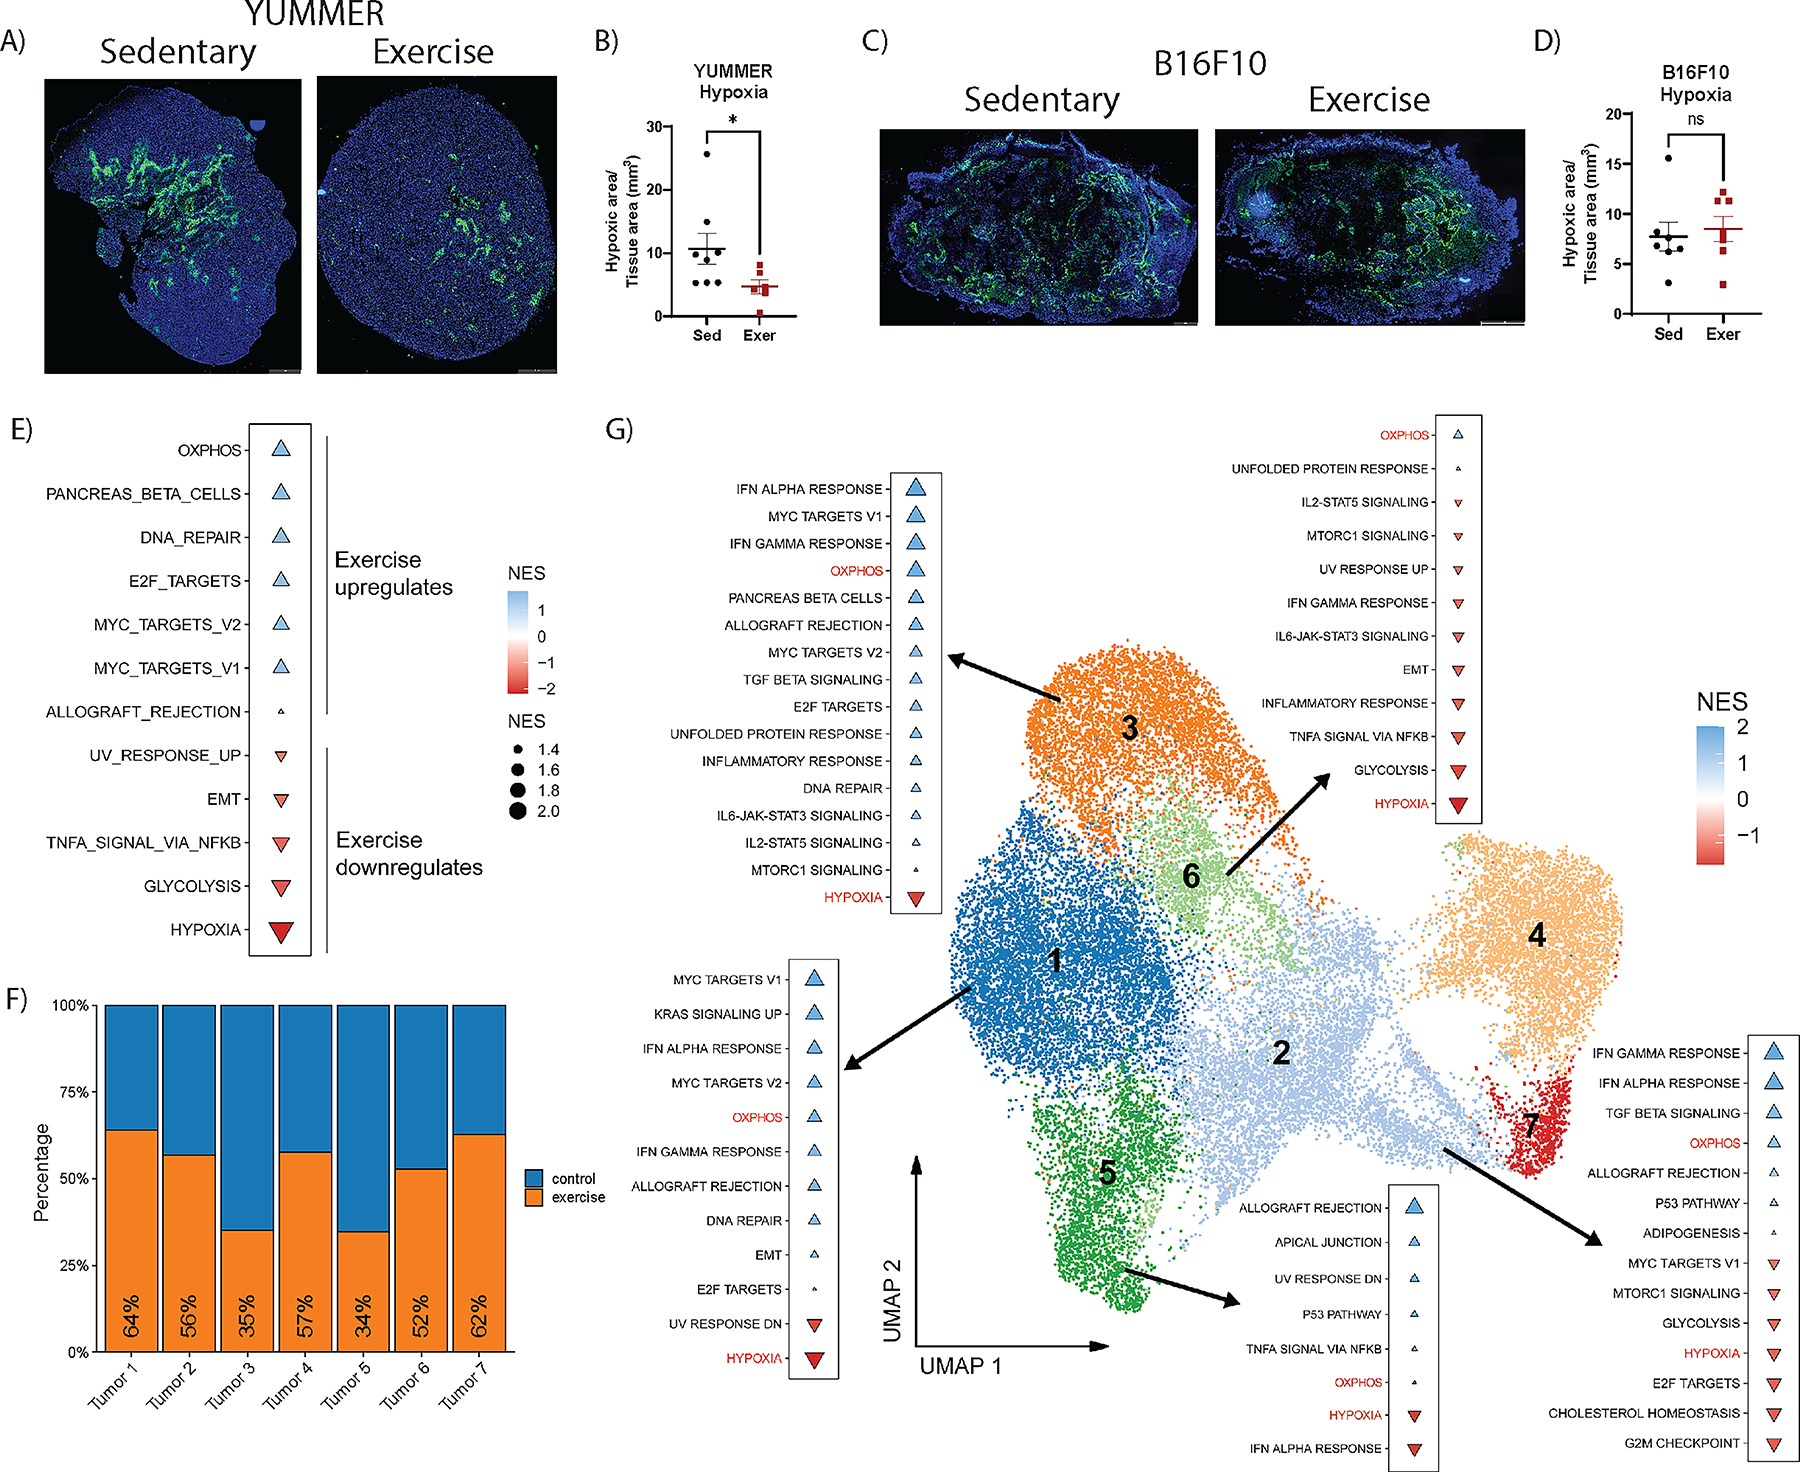
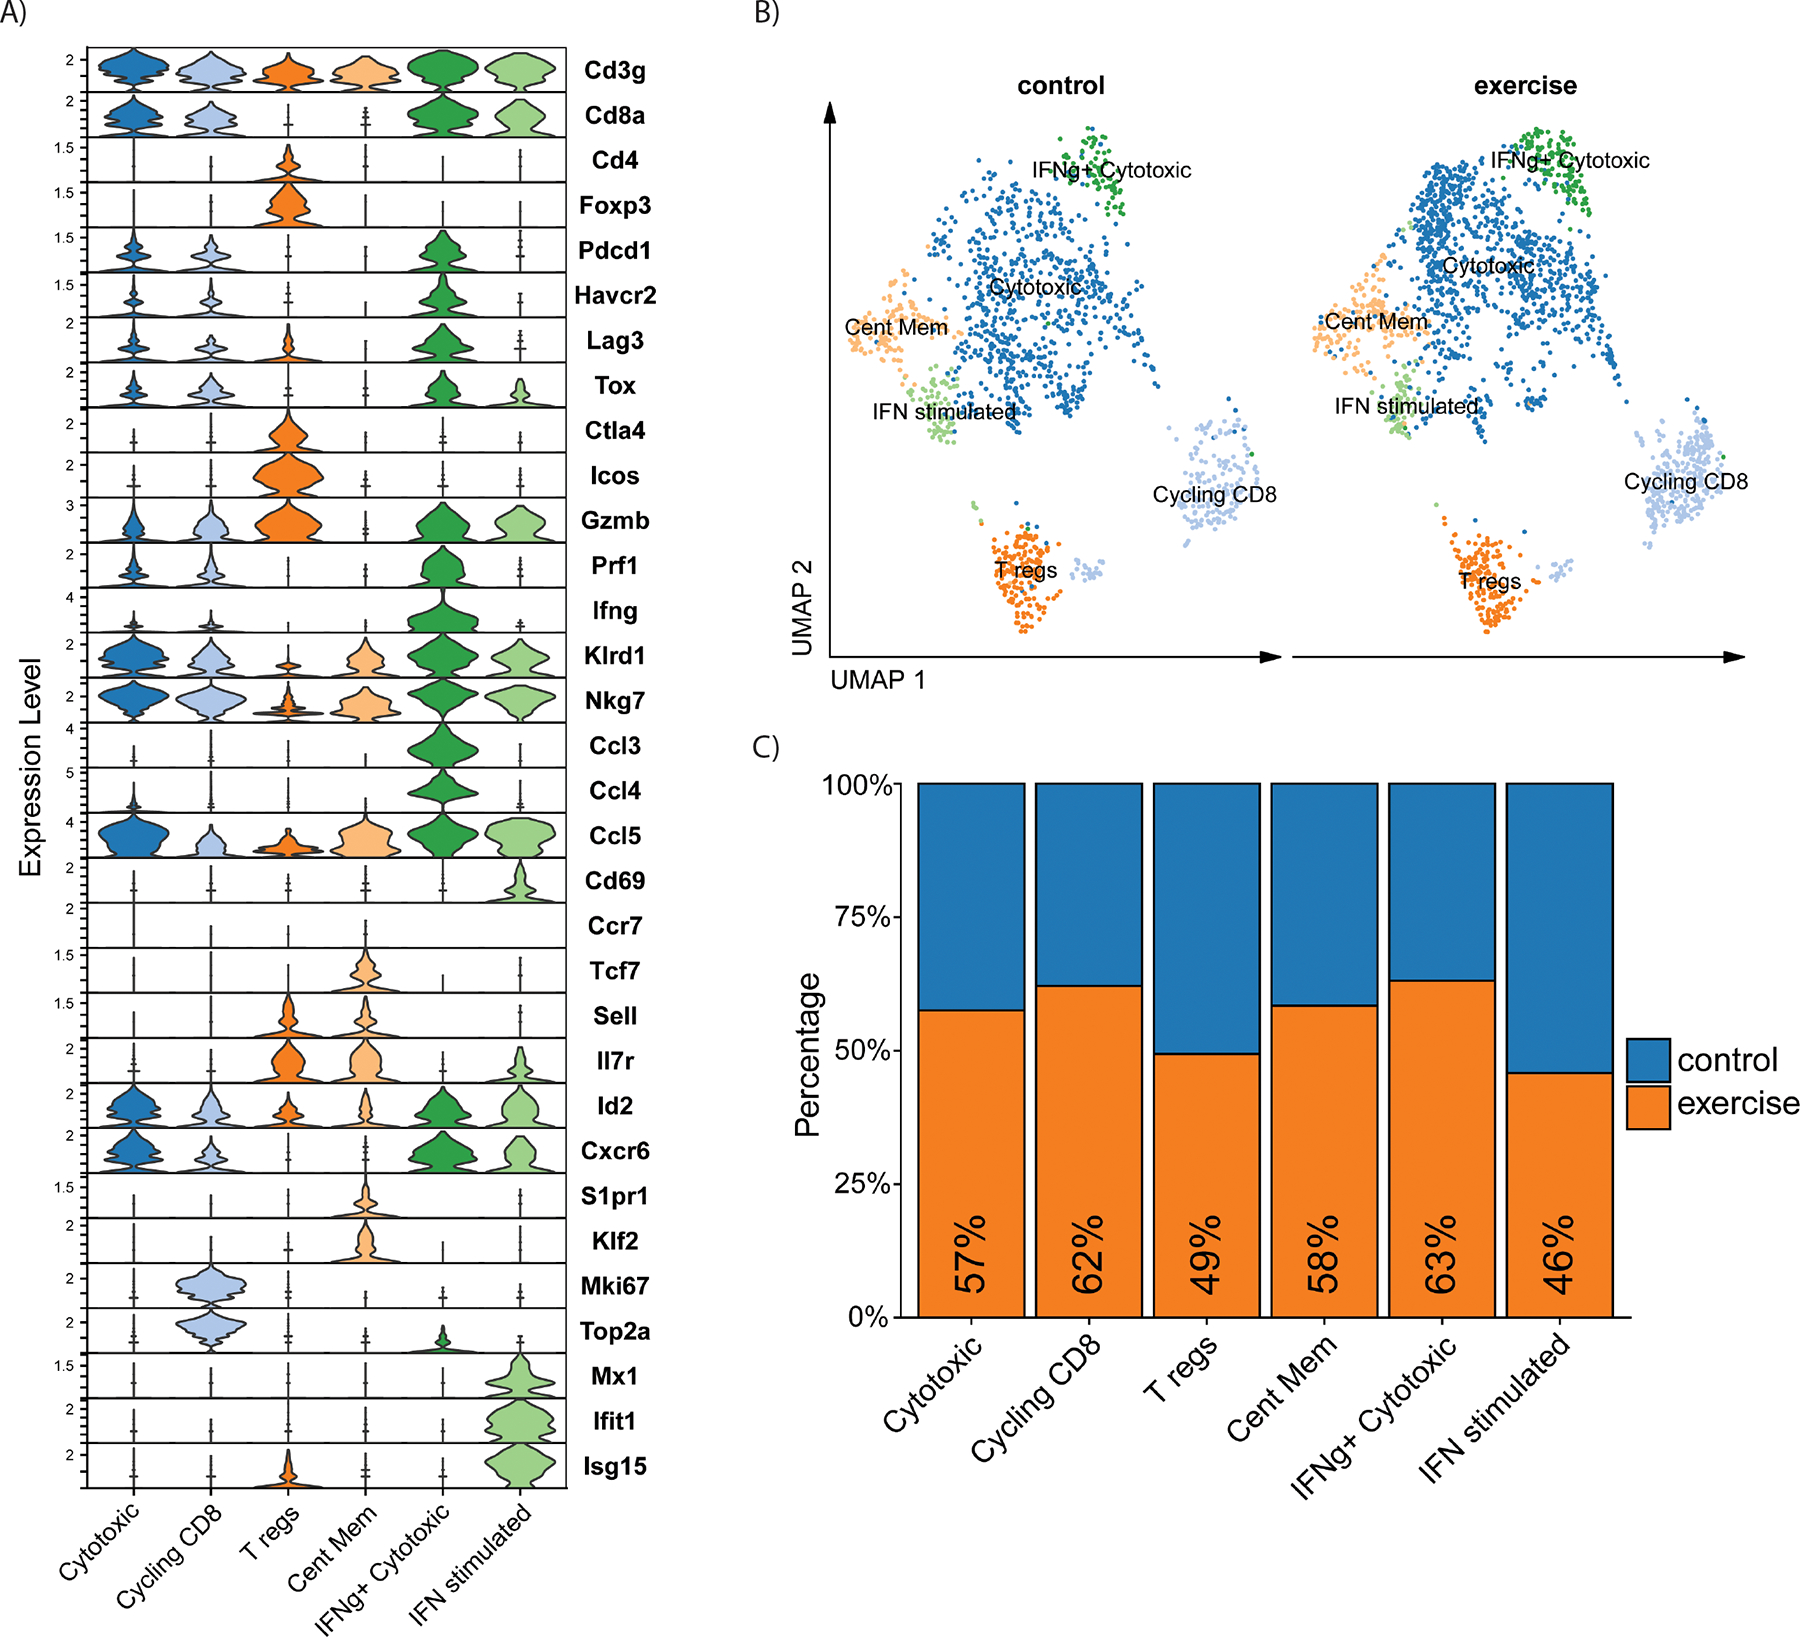
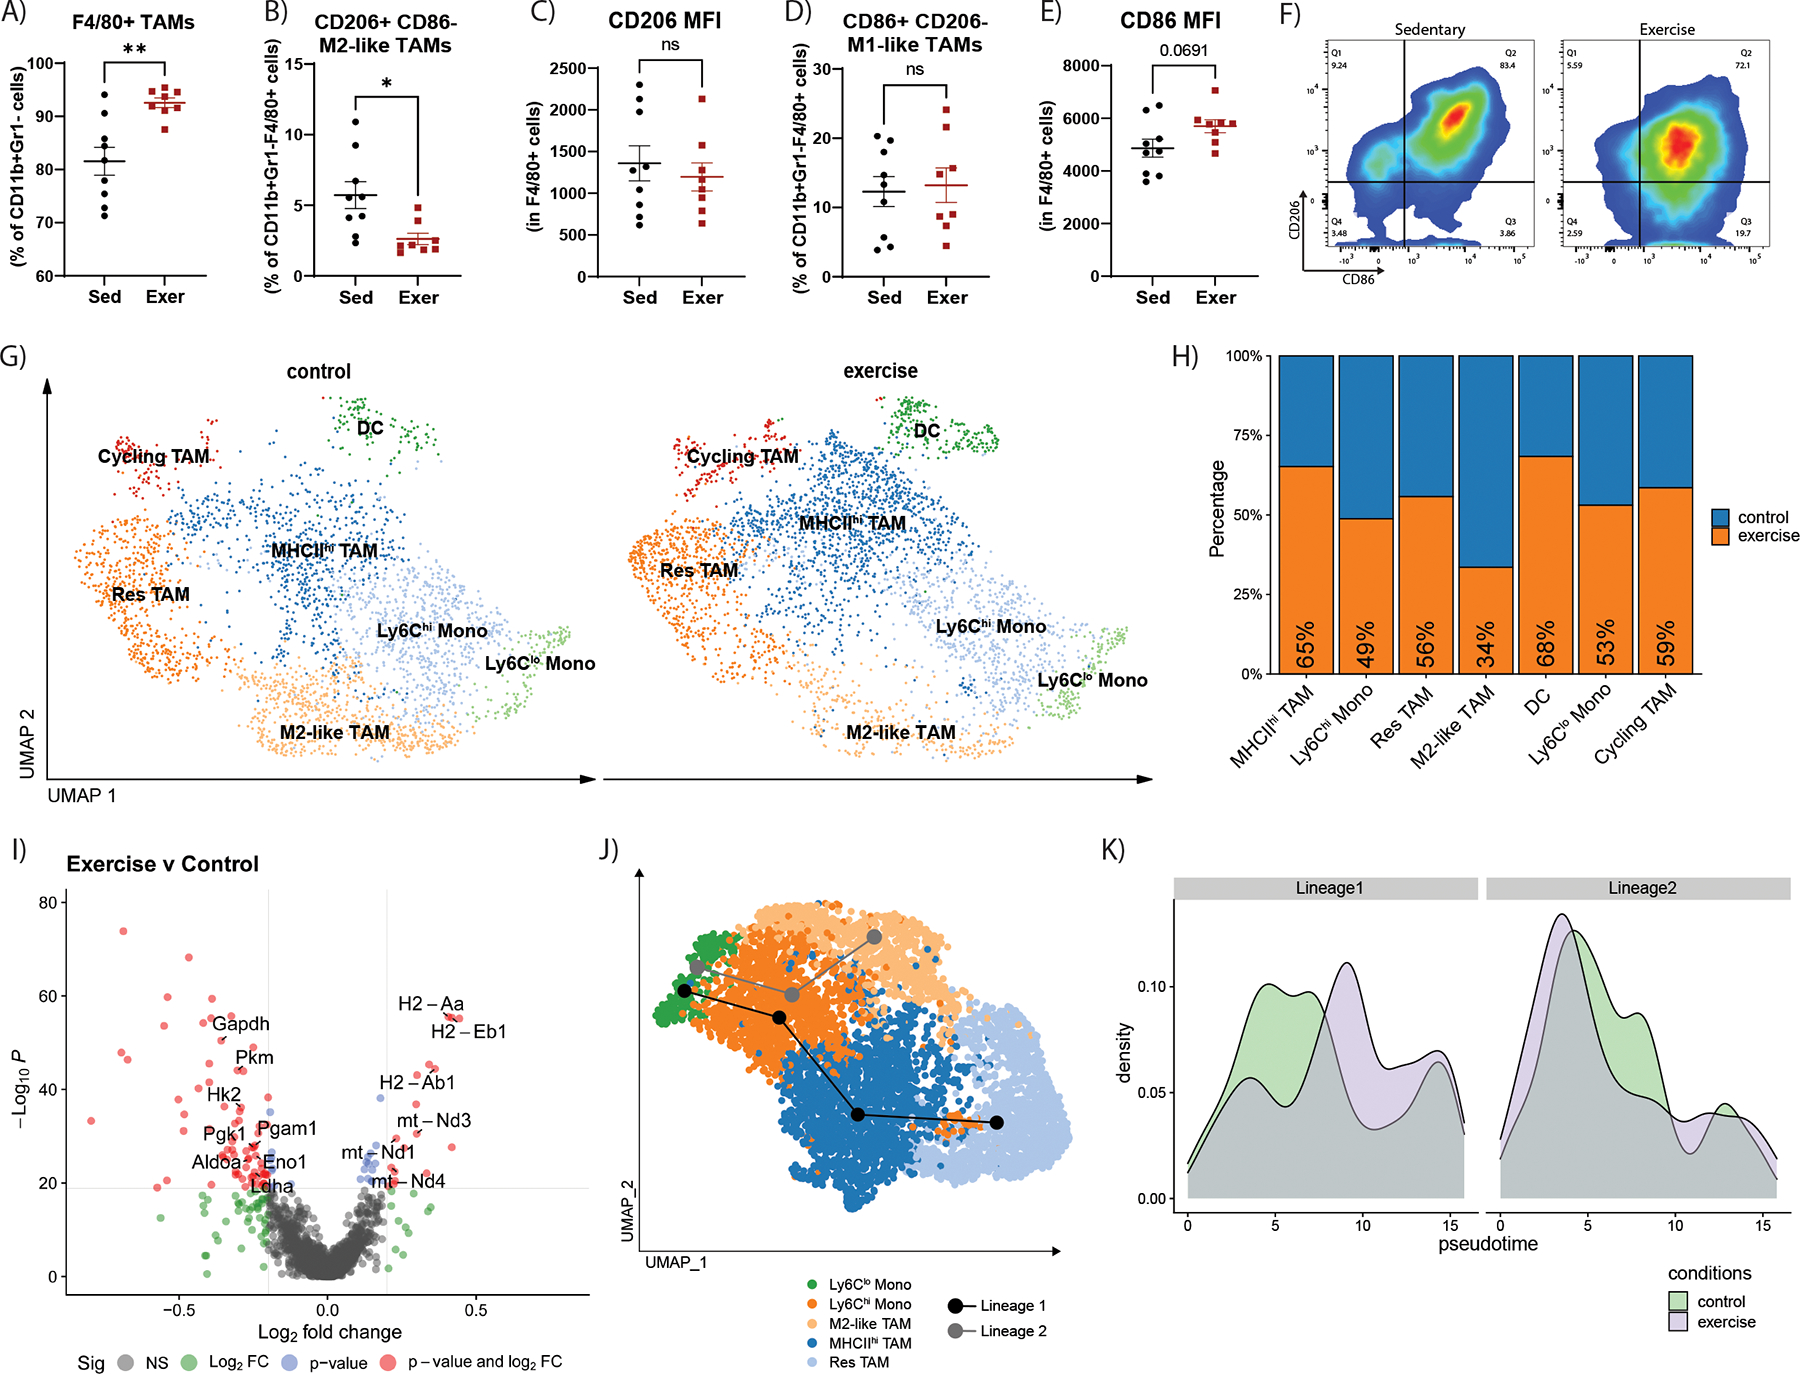
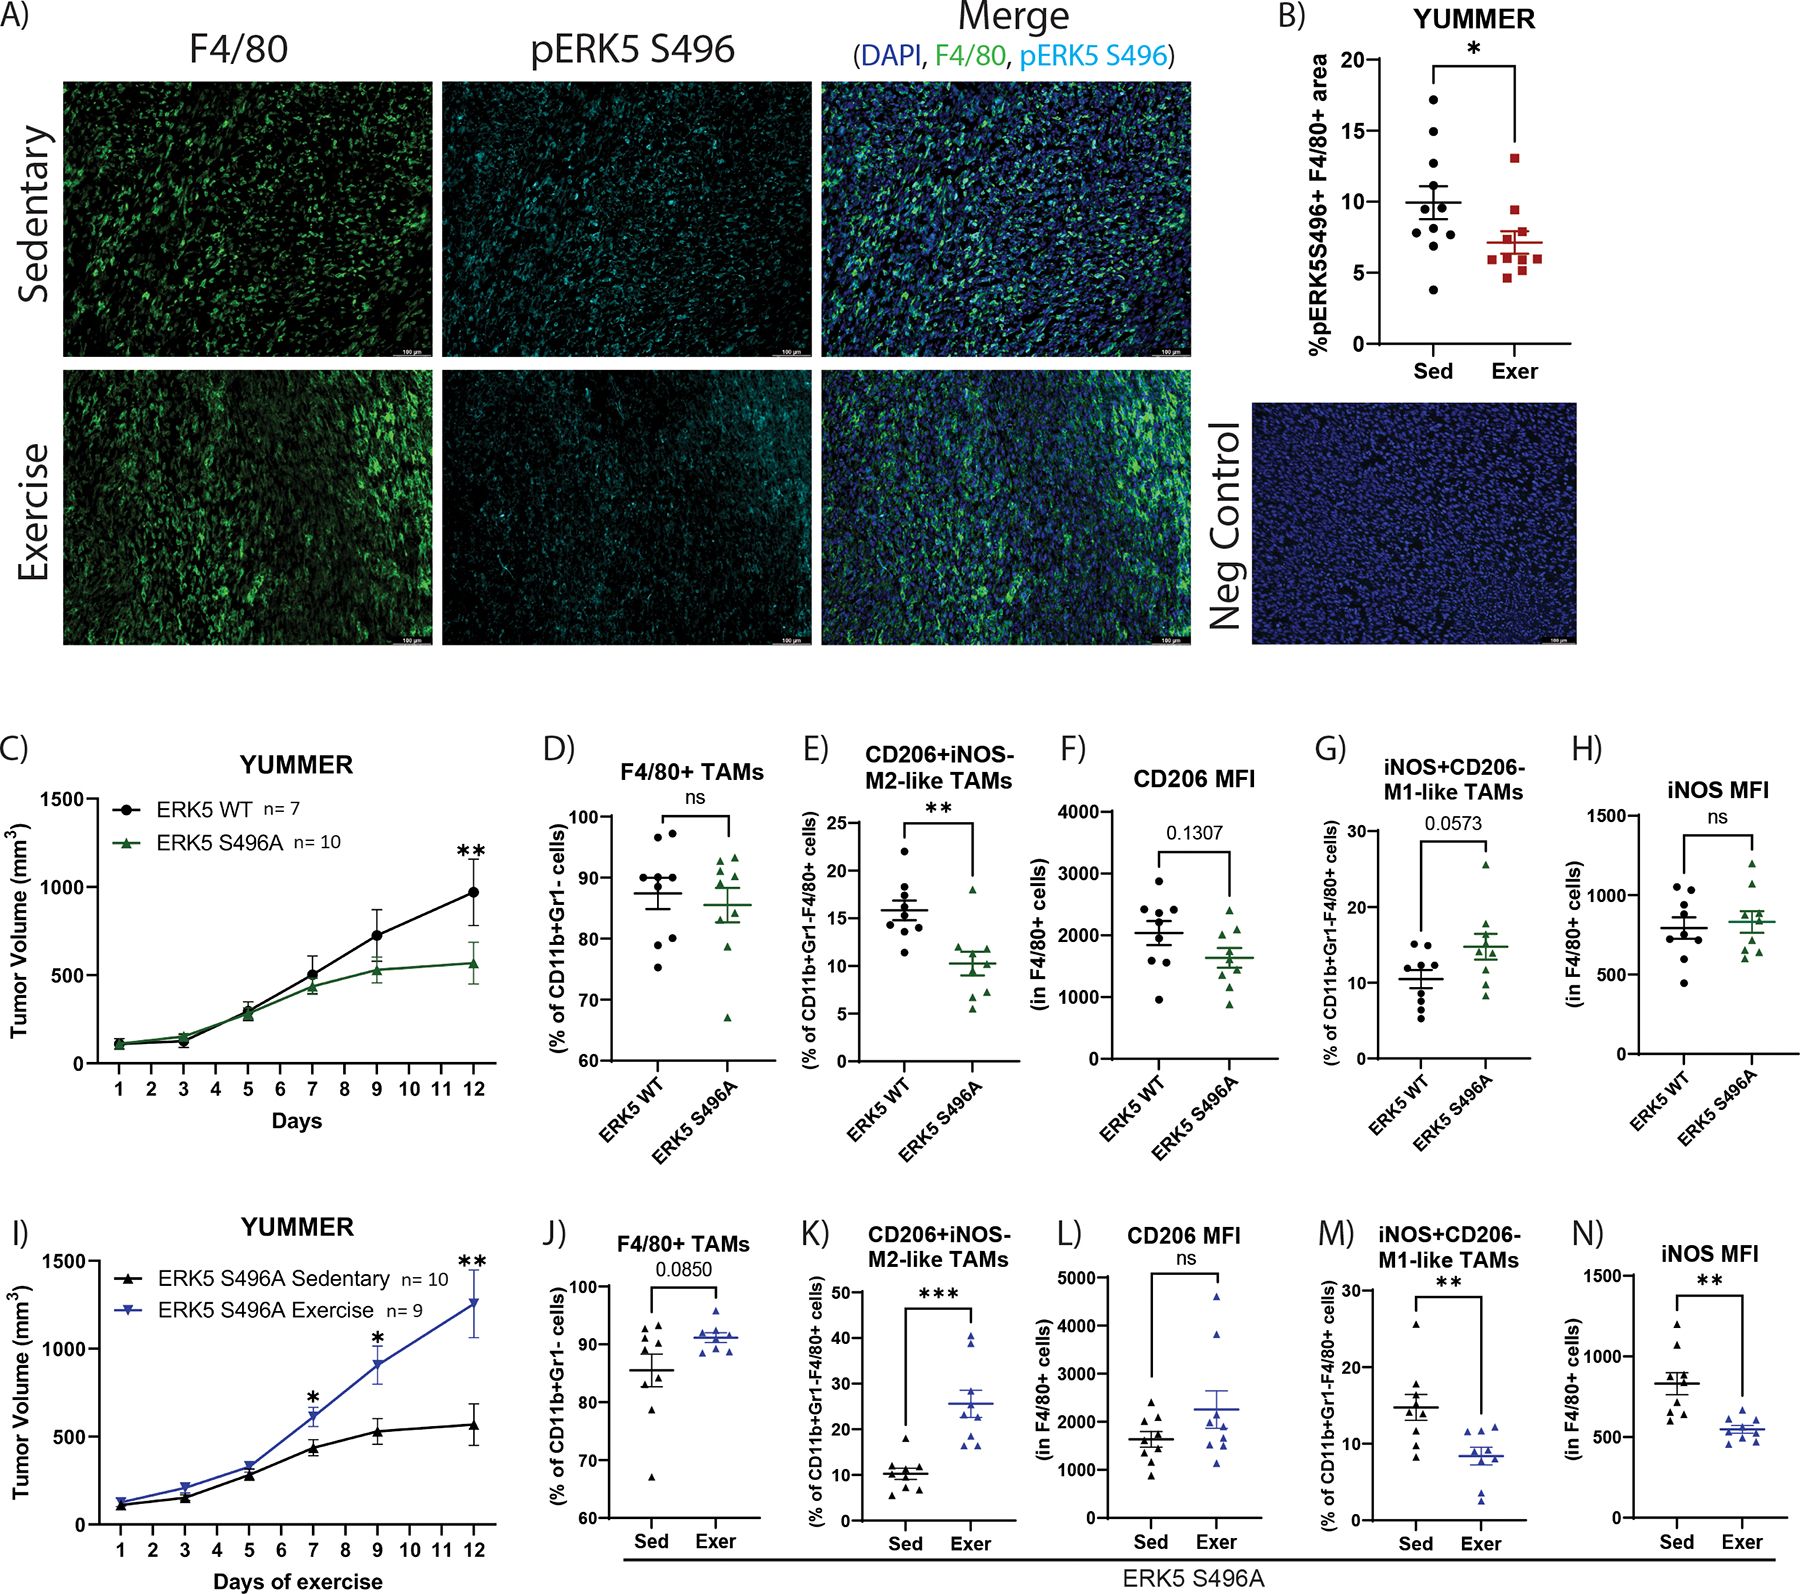
Exercise changes the tumor microenvironment by remodeling blood vessels and increasing infiltration by cytotoxic immune cells. The mechanisms driving these changes remain unclear. Herein, we demonstrate that exercise normalizes tumor vasculature and upregulates endothelial expression of VCAM1 in YUMMER 1.7 and B16F10 murine models of melanoma but differentially regulates tumor growth, hypoxia, and the immune response. We found that exercise suppressed tumor growth and increased CD8+ T-cell infiltration in YUMMER but not in B16F10 tumors. Single-cell RNA sequencing and flow cytometry revealed exercise modulated the number and phenotype of tumor-infiltrating CD8+ T cells and myeloid cells. Specifically, exercise caused a phenotypic shift in the tumor-associated macrophage population and increased the expression of MHC class II transcripts. We further demonstrated that ERK5 S496A knock-in mice, which are phosphorylation deficient at the S496 residue, "mimicked" the exercise effect when unexercised, yet when exercised, these mice displayed a reversal in the effect of exercise on tumor growth and macrophage polarization compared with wild-type mice. Taken together, our results reveal tumor-specific differences in the immune response to exercise and show that ERK5 signaling via the S496 residue plays a crucial role in exercise-induced tumor microenvironment changes. See related Spotlight by Betof Warner, p. 1158.


Figures

Figure 1.
Figure 1.. Aerobic exercise remodels melanoma tumor vasculature.
YUMMER and B16F10 tumor–bearing mice performed two weeks of treadmill exercise (Exer) or were non-exercised sedentary controls (Sed). A) YUMMER and B) B16F10 tumor vessel structure was evaluated using CD31 immunofluorescent staining. C,D) FITC-dextran leak (green) and CD31 (red) immunofluorescence with DAPI staining (blue) in C) YUMMER and D) B16F10 tumors; scale bar: 100μm. FITC-dextran leakage quantified as percent of dextran+ vessels in E) YUMMER and F) B16F10 tumors. Graphs are displayed with lines showing the mean +/− standard error of the mean (SEM); each point represents one tumor value obtained by the average of ≥ 5 10x microscopic fields. T-test results are represented on graphs according to the following: ns= p > 0.05, *p ≤ 0.05, **p ≤ 0.01, ***p ≤ 0.001, ****p ≤ 0.0001. The experiment comparing sedentary and exercise-treated mice was repeated four times in the YUMMER model and three times in B16F10 model, with n ≥ 8 mice in each treatment group for each independent experiment.
Figure 2.
Figure 2.. Exercise increases VCAM1 expression in melanoma tumor vasculature.
Immunofluorescent images of CD31 (green), VCAM1 (red) and DAPI (blue) in A) YUMMER and C) B16F10 tumors scale bar: 100μm. Images are representative of ≥ 5 images per tumor, ≥ 8 tumors per treatment group. Percent of VCAM1+ CD31+ vessel area was quantified in B) YUMMER and D) B16F10 images. Graphs are displayed with lines showing mean +/− standard error of the mean (SEM); each point represents one tumor value obtained by the average of ≥ 5 10x or 20x microscopic fields. T-test results are represented on graphs according to the following: ns= p > 0.05, *p ≤ 0.05, **p ≤ 0.01, ***p ≤ 0.001, ****p ≤ 0.0001)
Figure 3.
Figure 3.. Aerobic exercise suppresses tumor growth and increases CD8+ T-cell infiltration in YUMMER but not B16F10 tumors.
Flow cytometry quantifications of YUMMER tumors to identify the percent of A) CD3+ T cells relative to CD45+ cells, B) CD4+ T cells relative to CD3+ cells, C) FoxP3+ Treg cells relative to CD4+ cells, D) CD8+ T cells relative to CD3+ cells, E) CD69+CD8+ T cells, and F) PD1+CD8+ cells. Flow cytometry quantification on G) YUMMER of PD1 median fluorescence intensity (MFI) in CD8+ T cells. H) YUMMER tumor volumes were monitored with calipers and graphed over time. Tumor growth curve was analyzed using two-way ANOVA (YUMMER two-way ANOVA; Time v Exercise: p=0.0107; Time: p<0.0001; Exercise: p=0.1068) with post-hoc multiple comparisons displayed on graph. Flow cytometry quantifications of B16F10 tumors to identify the percent of I) CD3+ T cells relative to CD45+ cells, J) CD4+ T cells relative to CD3+ cells, K) FoxP3+ Treg cells relative to CD4+ cells, L) CD8+ T cells relative to CD3+ cells, M) CD69+CD8+ T cells, and N) PD1+CD8+ cells. Flow cytometry quantification O) B16F10 tumors of PD1 median fluorescence intensity (MFI) in CD8+ T cells. P) B16F10 tumor volumes were monitored with calipers and graphed over time. Tumor growth curve was analyzed using two-way ANOVA (B16F10 two-way ANOVA; Time v Exercise: p=0.9795; Time: p=0.0002; Exercise: p=0.6706) with post-hoc multiple comparisons displayed on graph. Graphs are displayed with lines showing mean +/− SEM. Each point on a graph represents one tumor analyzed. ns= p > 0.05, *p ≤ 0.05, **p ≤ 0.01, ***p ≤ 0.001, ****p ≤ 0.0001. Mouse experiment comparing sedentary and exercise treatment was repeated four times in the YUMMER model and three times in B16F10 model.
Figure 4.
Figure 4.. Exercise reduces hypoxia in YUMMER tumors.
Quantification of hypoxic regions measured by percent of hypoxyprobe-1+ area: total tumor tissue area in tile scan images of A, B) YUMMER and C, D) B16F10 tumors; scale bar: 1mm. Each point on the graphs represents one tumor. Lines on the graph indicate the mean +/− standard error of the mean (SEM). T-test results are indicated by * p<0.05, or ns = non-significant. E) GSEA analysis with significant altered pathways using the hallmarks of cancer gene sets comparing non-cycling tumor cell clusters from scRNA-seq dataset of YUMMER tumors from exercise and sedentary mice (n=3 per group), in which blue triangles represent exercise upregulated pathways and red triangles represent exercise downregulated pathways. Triangle size is proportional to normalized enrichment score (NES). F) Proportion of tumor cells from each cluster from control (blue) samples and exercised (orange) samples. G) UMAP plot of all tumor cells labeled with cluster number. GSEA using the hallmarks of cancer of exercise compared to sedentary samples for clusters Tumor 1, 2, 3, 5, and 6.
Figure 5.
Figure 5.. scRNAseq characterization of T-cell populations in YUMMER tumors after sedentary or exercise treatment.
Analysis of the scRNA-seq dataset of YUMMER tumors from exercise and sedentary mice (n=3 per group) from figure 4. A) Stacked violin plot of T-cell gene expression across scRNA-seq T-cell clusters. B) UMAP plot of T cells in YUMMER tumors from control (left) and exercise (right) samples. C) Proportions of the T-cell clusters from control (blue) samples versus exercised (orange) samples
Figure 6.
Figure 6.. Exercise reduces M2-like TAMs and alters the transcriptome of myeloid cells.
Flow cytometry quantifications of YUMMER tumors of the percent of A) F4/80+ TAMs relative to CD11b+Gr1 cells, B) CD206+CD86 TAMs relative to CD11b+Gr1F4/80+ cells, C) CD206 MFI in CD11b+Gr1F4/80+ cells, D) CD86+CD206 TAMs relative to CD11b+Gr1F4/80+ cells, and E) CD86 MFI in CD11b+Gr1F4/80+ cells. F) Representative flow cytometry plots of CD206 marker versus CD86 marker in CD11b+Gr1F4/80+ cells. Graphs are displayed with lines showing mean +/− SEM. Each point on the graphs represents one tumor analyzed. T-test results are represented on graphs according to the following: ns= p > 0.05, *p ≤ 0.05, **p ≤ 0.01, ***p ≤ 0.001, ****p ≤ 0.0001. G-J) Analysis of the scRNA-seq dataset of YUMMER tumors from exercise and sedentary mice (n=3 per group) from figure 4 G) UMAP plot of myeloid cell populations in YUMMER tumors from control (left) and exercise (right) samples. H) Proportions of each cluster from control (blue) samples versus exercised (orange) samples. I) Volcano plot showing differentially expressed genes in myeloid cells. Comparison: exercise versus control. J) Results of pseudotime trajectory analysis performed on non-cycling monocyte and TAM clusters revealed two predicted lineages which are represented with lines on the UMAP plot. Lineage 1: Ly6Clo Monos -> Ly6Chi Monos -> MHCIIhi TAM -> Res TAM (black line) and Lineage 2: Ly6Clo Monos -> Ly6Chi Monos -> M2-like TAM (gray line). K) Control (green) and exercise (purple) sample population density across Lineage 1 or Lineage 2 pseudotime.
Figure 7.
Figure 7.. ERK5 S496A KI alters tumor growth and shifts TAM phenotype differently than with exercise
YUMMER tumor–bearing mice performed approximately two weeks of treadmill exercise (Exer) or were non-exercised sedentary controls (Sed). A) Immunofluorescent images of F4/80 (marker for TAMs; green), phospho-ERK5 S496 (cyan), and DAPI (blue) on YUMMER tumors, representative of >5 microscopic fields per tumor and 7 –10 tumors per group; scale bar: 100μm. B) Quantification of percent of phospho-ERK5 S496+F4/80+ area in YUMMER tumors from sedentary or exercised mice. Graphs are displayed with mean +/− standard error of the mean (SEM); each point represents one tumor value obtained by the average of ≥ 5 10x microscopic fields. C) YUMMER tumor volume in ERK5 WT (C57Bl/6) mice and ERK5 S496A KI mice was monitored with calipers. Tumor growth curves were analyzed using two-way ANOVA (Time v ERK5S496A: p=0.0122; Time: p<0.0001; Exercise: p=0.0.2119) with post-hoc multiple comparisons displayed on graphs. ns= p > 0.05, *p ≤ 0.05, **p ≤ 0.01, ***p ≤ 0.001, ****p ≤ 0.0001. Flow cytometry quantification of the percent of D) F4/80+ TAMs relative to CD11b+Gr1 cells, E) CD206+iNOS TAMs relative to CD11b+Gr1F4/80+ cells, F) CD206 MFI in CD11b+Gr1F4/80+ cells, G) iNOS+CD206 TAMs relative to CD11b+Gr1F4/80+ cells, H) iNOS MFI in CD11b+Gr1F4/80+ cells. I) YUMMER tumor volume in sedentary or exercised ERK5 S496A KI mice was monitored with calipers. Tumor growth curves were analyzed using two-way ANOVA (Time v Exercise: p<0.0001; Time: p<0.0001; Exercise: p=0.0061) with post-hoc multiple comparisons displayed on graphs. ns= p > 0.05, *p ≤ 0.05, **p ≤ 0.01, ***p ≤ 0.001, ****p ≤ 0.0001. Flow cytometry quantification of the percent of J) F4/80+ TAMs relative to CD11b+Gr1 cells, K) CD206+iNOS TAMs relative to CD11b+Gr1F4/80+ cells, L) CD206 MFI in CD11b+Gr1F4/80+ cells, M) iNOS+CD206 TAMs relative to CD11b+Gr1F4/80+ cells, N) iNOS MFI in CD11b+Gr1F4/80+ cells. Mouse experiments utilizing ERK5 S496A KI mice were independently repeated two times. Each point on a graph represents one tumor analyzed.

Comment in

References

    1. Moore SC, Lee IM, Weiderpass E, Campbell PT, Sampson JN, Kitahara CM, … Patel A. v. (2016). Association of Leisure-Time Physical Activity With Risk of 26 Types of Cancer in 1.44 Million Adults. JAMA Internal Medicine, 176(6), 816–825. 10.1001/JAMAINTERNMED.2016.1548 - DOI - PMC - PubMed
    1. Mctiernan A, Friedenreich CM, Katzmarzyk PT, Powell KE, Macko R, Buchner D, … Piercy KL (2019). Physical Activity in Cancer Prevention and Survival: A Systematic Review. Medicine and science in sports and exercise, 51(6), 1252–1261. 10.1249/MSS.0000000000001937 - DOI - PMC - PubMed
    1. Gerritsen JKW, & Vincent AJPE (2016). Exercise improves quality of life in patients with cancer: a systematic review and meta-analysis of randomised controlled trials. British Journal of Sports Medicine, 50(13), 796–803. 10.1136/BJSPORTS-2015-094787 - DOI - PubMed
    1. Segal R, Zwaal C, Green E, Tomasone JR, Loblaw A, Petrella T, & Group E for P. with C. G. D. (2017). Exercise for people with cancer: a systematic review. Current Oncology, 24(4), e290. 10.3747/CO.24.3619 - DOI - PMC - PubMed
    1. Betof AS, Lascola CD, Weitzel D, Landon C, Scarbrough PM, Devi GR, … Dewhirst MW (2015). Modulation of Murine Breast Tumor Vascularity, Hypoxia, and Chemotherapeutic Response by Exercise. JNCI: Journal of the National Cancer Institute, 107(5). 10.1093/jnci/djv040 - DOI - PMC - PubMed

Publication types

Substances