

The Interfascicular Matrix of Energy Storing Tendons Houses Heterogenous Cell Populations Disproportionately Affected by Aging
- PMID: 37307816
- PMCID: PMC10796100
- DOI: 10.14336/AD.2023.0425-1
The Interfascicular Matrix of Energy Storing Tendons Houses Heterogenous Cell Populations Disproportionately Affected by Aging
Abstract
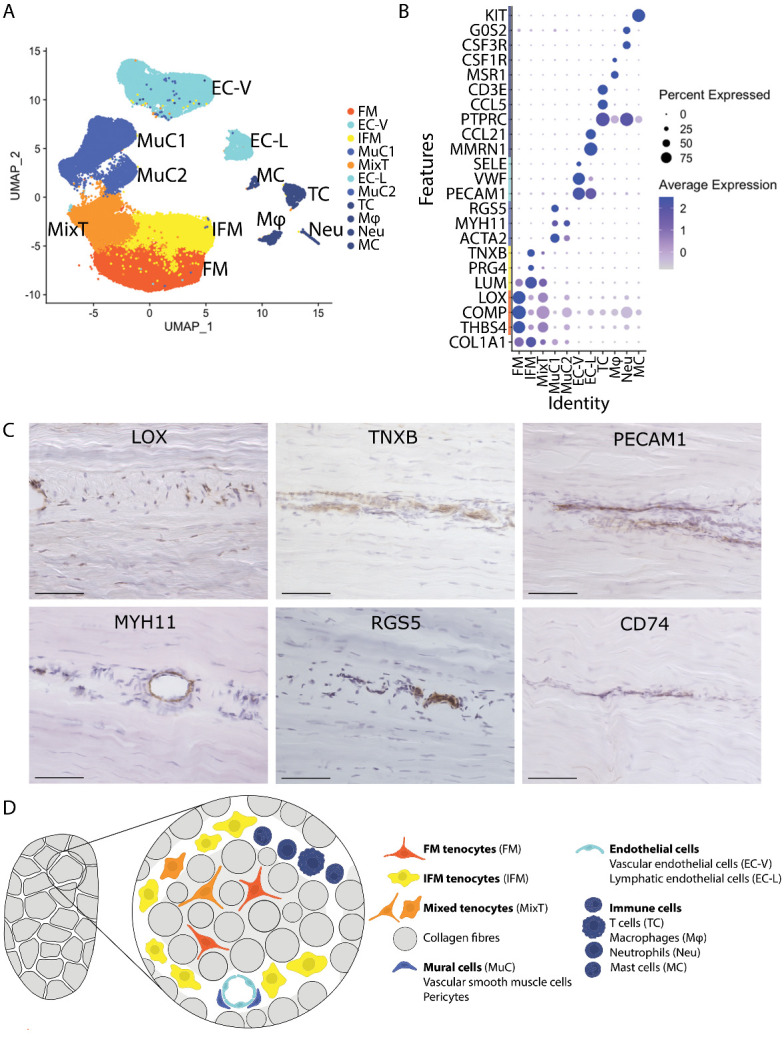
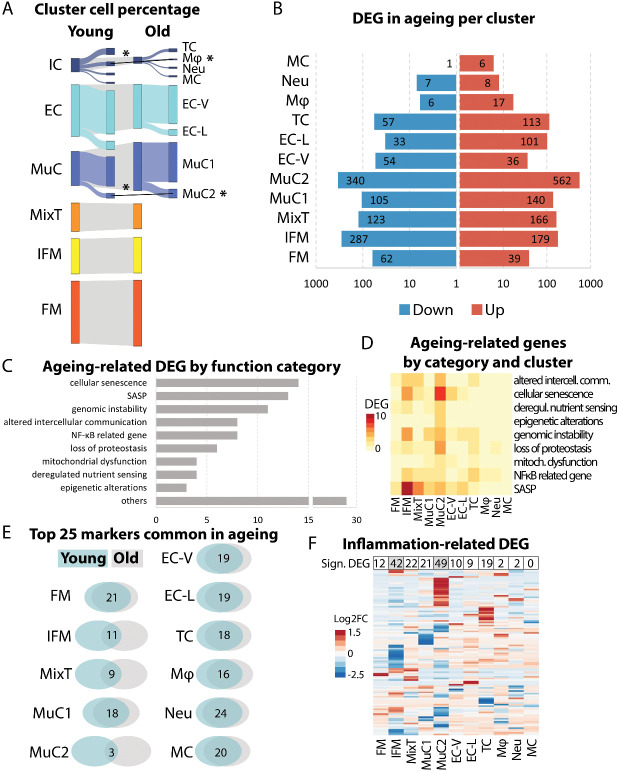
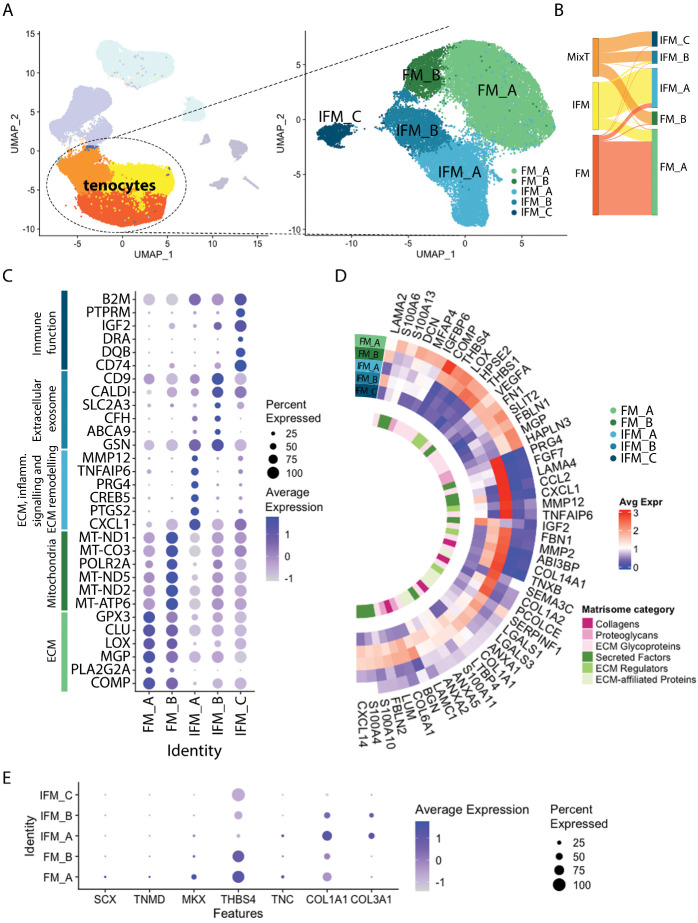
Energy storing tendons such as the human Achilles and equine superficial digital flexor tendon (SDFT) are prone to injury, with incidence increasing with aging, peaking in the 5th decade of life in the human Achilles tendon. The interfascicular matrix (IFM), which binds tendon fascicles, plays a key role in energy storing tendon mechanics, and aging alterations to the IFM negatively impact tendon function. While the mechanical role of the IFM in tendon function is well-established, the biological role of IFM-resident cell populations remains to be elucidated. Therefore, the aim of this study was to identify IFM-resident cell populations and establish how these populations are affected by aging. Cells from young and old SDFTs were subjected to single cell RNA-sequencing, and immunolabelling for markers of each resulting population used to localise cell clusters. Eleven cell clusters were identified, including tenocytes, endothelial cells, mural cells, and immune cells. One tenocyte cluster localised to the fascicular matrix, whereas nine clusters localised to the IFM. Interfascicular tenocytes and mural cells were preferentially affected by aging, with differential expression of genes related to senescence, dysregulated proteostasis and inflammation. This is the first study to establish heterogeneity in IFM cell populations, and to identify age-related alterations specific to IFM-localised cells.
Conflict of interest statement
The authors have no conflicts of interest to declare.
Figures


Similar articles
-
Fascicles and the interfascicular matrix show adaptation for fatigue resistance in energy storing tendons.Acta Biomater. 2016 Sep 15;42:308-315. doi: 10.1016/j.actbio.2016.06.012. Epub 2016 Jun 7. Acta Biomater. 2016. PMID: 27286677 Free PMC article.
-
Structure-function specialisation of the interfascicular matrix in the human achilles tendon.Acta Biomater. 2021 Sep 1;131:381-390. doi: 10.1016/j.actbio.2021.07.019. Epub 2021 Jul 13. Acta Biomater. 2021. PMID: 34271169 Free PMC article.
-
Fascicles and the interfascicular matrix show decreased fatigue life with ageing in energy storing tendons.Acta Biomater. 2017 Jul 1;56:58-64. doi: 10.1016/j.actbio.2017.03.024. Epub 2017 Mar 16. Acta Biomater. 2017. PMID: 28323176 Free PMC article.
-
Structure Function Relationships in the Aging Superficial Digital Flexor Tendon: Implications for Injury.Vet Clin North Am Equine Pract. 2025 Aug;41(2):239-250. doi: 10.1016/j.cveq.2025.04.001. Epub 2025 Jun 14. Vet Clin North Am Equine Pract. 2025. PMID: 40517036 Review.
-
Achilles tendon injuries in elite athletes: lessons in pathophysiology from their equine counterparts.ILAR J. 2014;55(1):86-99. doi: 10.1093/ilar/ilu004. ILAR J. 2014. PMID: 24936032 Review.
Cited by
-
Achilles tendinopathy.Nat Rev Dis Primers. 2025 Mar 27;11(1):20. doi: 10.1038/s41572-025-00602-9. Nat Rev Dis Primers. 2025. PMID: 40148342 Review.
-
Current cutting-edge omics techniques on musculoskeletal tissues and diseases.Bone Res. 2025 Jun 9;13(1):59. doi: 10.1038/s41413-025-00442-z. Bone Res. 2025. PMID: 40484858 Free PMC article. Review.
-
Equine tendon mechanical behaviour: Prospects for repair and regeneration applications.Vet Med Sci. 2023 Sep;9(5):2053-2069. doi: 10.1002/vms3.1205. Epub 2023 Jul 20. Vet Med Sci. 2023. PMID: 37471573 Free PMC article. Review.
-
Role of the tendon circadian clock in tendinopathy and implications for therapeutics.Int J Exp Pathol. 2025 May;106(3):e70001. doi: 10.1111/iep.70001. Int J Exp Pathol. 2025. PMID: 40308034 Free PMC article. Review.
-
A review of the equine suspensory ligament: Injury prone yet understudied.Equine Vet J. 2025 Sep;57(5):1167-1182. doi: 10.1111/evj.14447. Epub 2024 Nov 27. Equine Vet J. 2025. PMID: 39604165 Free PMC article. Review.
References
-
- Clayton RAE, Court-Brown CM (2008). The epidemiology of musculoskeletal tendinous and ligamentous injuries. Injury, 39:1338-1344. - PubMed
-
- Perkins NR, Reid SWJ, Morris RS (2005). Risk factors for injury to the superficial digital flexor tendon and suspensory apparatus in Thoroughbred racehorses in New Zealand. N Z Vet J, 53:184-192. - PubMed
-
- Biewener AA (1998). Muscle-tendon stresses and elastic energy storage during locomotion in the horse. Comparative Biochemistry and Physiology Part B: Biochemistry and Molecular Biology, 120:73-87. - PubMed
-
- Lichtwark GA, Wilson AM (2007). Is Achilles tendon compliance optimised for maximum muscle efficiency during locomotion? J Biomech, 40:1768-1775. - PubMed
-
- Patterson-Kane JC, Rich T (2014). Achilles tendon injuries in elite athletes: lessons in pathophysiology from their equine counterparts. Ilar j, 55:86-99. - PubMed
MeSH terms
Grants and funding
LinkOut - more resources
Full Text Sources