. 2024 Feb 1;15(1):338-356.
doi: 10.14336/AD.2023.0602.

The inhibition of YAP Signaling Prevents Chronic Biliary Fibrosis in the Abcb4-/- Model by Modulation of Hepatic Stellate Cell and Bile Duct Epithelium Cell Pathophysiology

Affiliations

The inhibition of YAP Signaling Prevents Chronic Biliary Fibrosis in the Abcb4-/- Model by Modulation of Hepatic Stellate Cell and Bile Duct Epithelium Cell Pathophysiology

Liangtao Ye et al. Aging Dis. .

Abstract

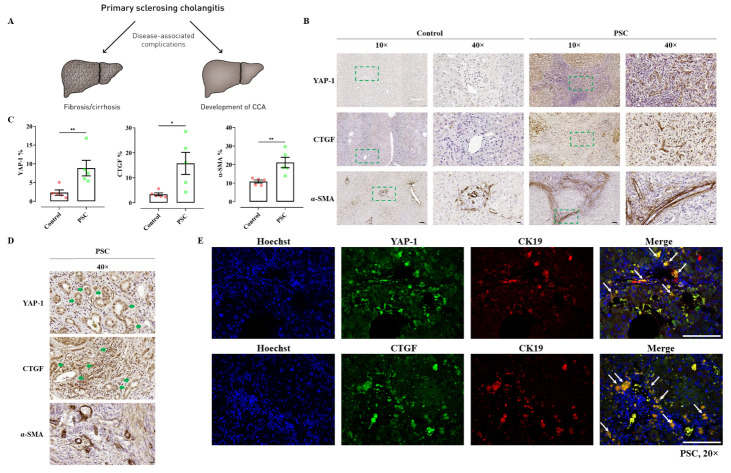
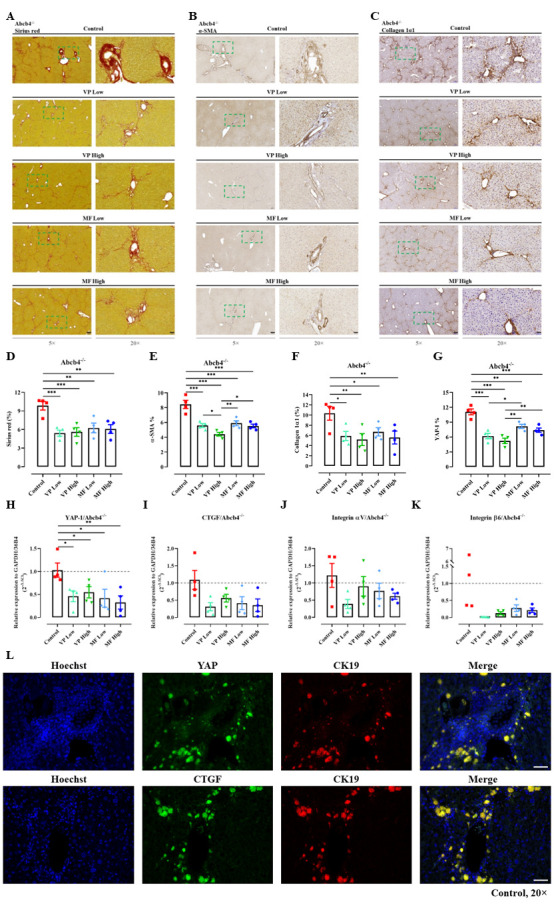
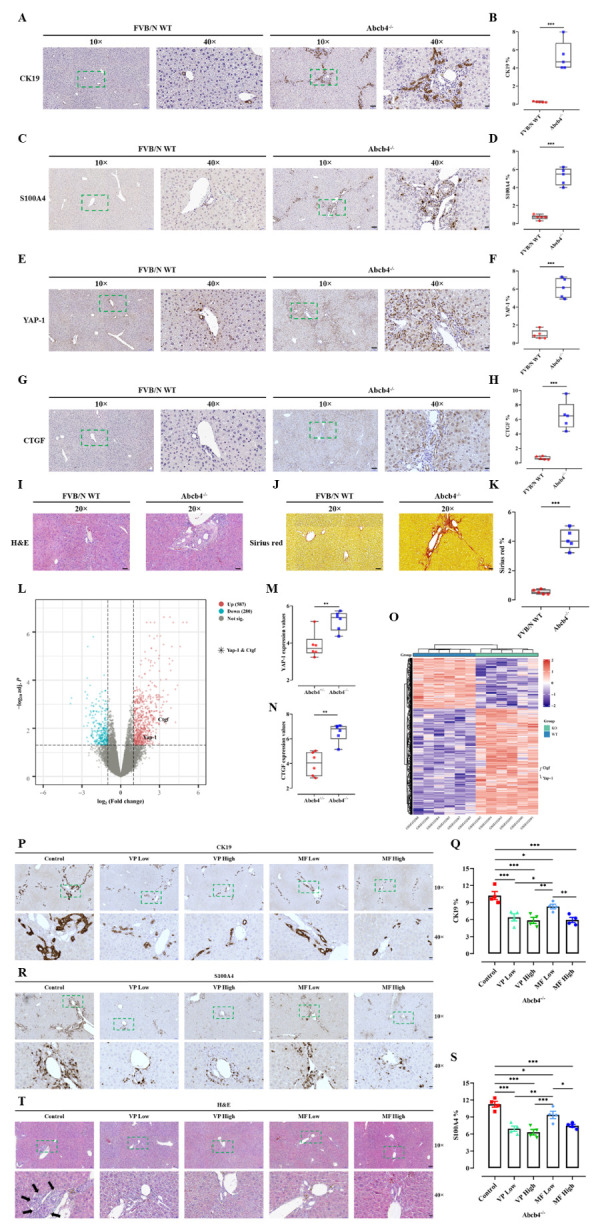
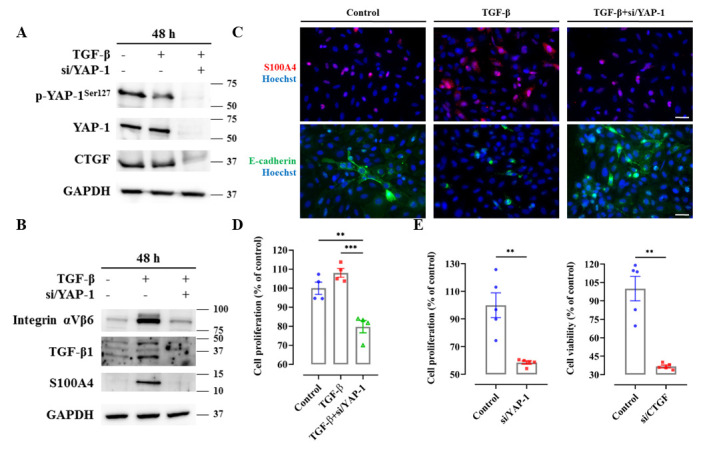
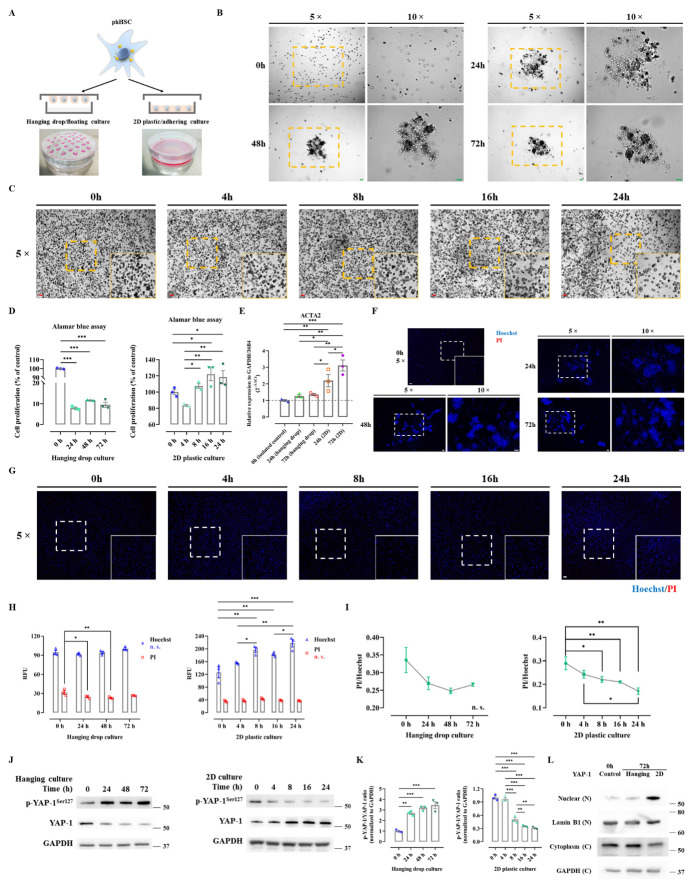
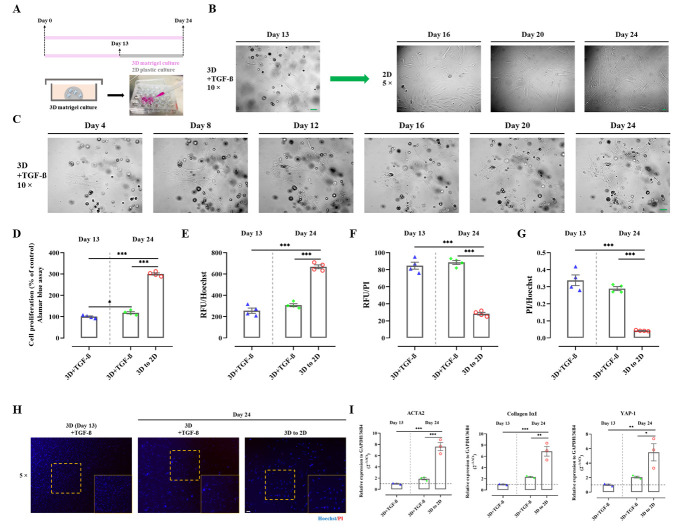
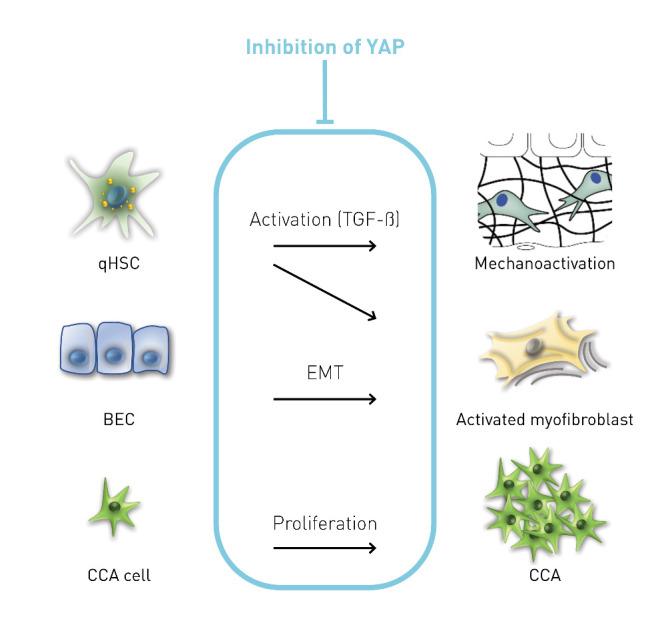
Primary sclerosing cholangitis (PSC) represents a chronic liver disease characterized by poor prognosis and lacking causal treatment options. Yes-associated protein (YAP) functions as a critical mediator of fibrogenesis; however, its therapeutic potential in chronic biliary diseases such as PSC remains unestablished. The objective of this study is to elucidate the possible significance of YAP inhibition in biliary fibrosis by examining the pathophysiology of hepatic stellate cells (HSC) and biliary epithelial cells (BEC). Human liver tissue samples from PSC patients were analyzed to assess the expression of YAP/connective tissue growth factor (CTGF) relative to non-fibrotic control samples. The pathophysiological relevance of YAP/CTGF in HSC and BEC was investigated in primary human HSC (phHSC), LX-2, H69, and TFK-1 cell lines through siRNA or pharmacological inhibition utilizing verteporfin (VP) and metformin (MF). The Abcb4-/- mouse model was employed to evaluate the protective effects of pharmacological YAP inhibition. Hanging droplet and 3D matrigel culture techniques were utilized to investigate YAP expression and activation status of phHSC under various physical conditions. YAP/CTGF upregulation was observed in PSC patients. Silencing YAP/CTGF led to inhibition of phHSC activation and reduced contractility of LX-2 cells, as well as suppression of epithelial-mesenchymal transition (EMT) in H69 cells and proliferation of TFK-1 cells. Pharmacological inhibition of YAP mitigated chronic liver fibrosis in vivo and diminished ductular reaction and EMT. YAP expression in phHSC was effectively modulated by altering extracellular stiffness, highlighting YAP's role as a mechanotransducer. In conclusion, YAP regulates the activation of HSC and EMT in BEC, thereby functioning as a checkpoint of fibrogenesis in chronic cholestasis. Both VP and MF demonstrate effectiveness as YAP inhibitors, capable of inhibiting biliary fibrosis. These findings suggest that VP and MF warrant further investigation as potential therapeutic options for the treatment of PSC.


Conflict of interest statement

Conflict of Interest

FPR has received honoraria for lectures and/or travel support from Falk Foundation, Novartis and Ipsen, Gilead. NBK has received reimbursement of meeting attendance fees and travel expenses from EISAI and lecture honoraria from Falk. GD has received honoraria for lectures, teaching, advisory activities and travel support from AbbVie, Advanz/Intercept, Alexion, Falk Foundation, Gilead, Orphalan, Novartis, and Univar. AG has has received honoraria for lectures, teaching, advisory activities and travel support from AbbVie, Alexion, Bayer, BMS, CSL Behring, Eisai, Gilead, Intercept, Falk, Ipsen, MSD, Merz, Novartis, Pfizer, Roche, Sanofi-Aventis, Sequana and has received research support from Intercept und Falk (NAFLD CSG) and Novartis. EDT has served as a paid consultant for AstraZeneca, Bayer, BMS, EISAI, Eli Lilly & Co, Pfizer, IPSEN, and Roche. He has received reimbursement of meeting attendance fees and travel expenses from Arqule, Astrazeneca, BMS, Bayer, Celsion and Roche, and lecture honoraria from BMS and Falk. He has received third-party funding for scientific research from Arqule, AstraZeneca, BMS, Bayer, Eli Lilly, and Roche. All other authors declare that they have no conflict of interest.

Figures

Figure 1.
Figure 1.
Expression of YAP and CTGF in human liver tissues of PSC patients. (A-B) Immunohistochemical staining of YAP, CTGF and α-SMA in human liver tissues of non-fibrotic control (samples obtained in non-tumoral liver areas) and PSC patients. Magnification, 10× (scale bar=100 µm) and 40× (scale bar=20 µm). Quantitative analysis of stained areas in percentage (%) was quantified by the QuPath software. n=5; *, P<0.05, **, P<0.01, t-test; test of normality by Shapiro-Wilk (P>0.05). The results are shown as mean ± standard error of the mean. The squares in dashed lines indicated the areas shown in 40-folds images. (C) Bile duct cells stained also positive for YAP and CTGF as illustrated by representative images. Magnification, 40× (scale bar=20 µm). (D) Representative immunofluorescence containing YAP (green)/CK19 (red) and CTGF (green)/CK19 (red) in liver tissues of PSC patients. Magnification, 20× (scale bar=100 µm).
Figure 2.
Figure 2.
Verteporfin and metformin prevent the progression of biliary fibrosis in the Abcb4-/- model and downregulate the expression of YAP. (A) The extent of fibrotic areas in sirius red-stained slides was analyzed quantitatively and representative images were shown (D). (B. C) Immunohistochemistry was performed to evaluate the positive area of α-SMA and collagen 1α1 in the liver. Representative images and quantitative analysis were shown (E. F). Magnification, 5× (scale bar=200 µm) and 20× (scale bar=50 µm). The squares in dashed lines indicated the areas shown in 20-folds images. (G) Immunohistochemical staining of YAP was performed in the liver tissues and analyzed quantitatively in percentage (%) by whole slide scanning. (H-K) The mRNA expression as 2-∆∆Ct of YAP, CTGF, Integrin αV, and Integrin β6 under treatment was investigated in the liver. The values shown were normalized based on the mean of GAPDH and 36B4 in indicated control group. (L) Representative immunofluorescence co-staining of YAP/CK19 and CTGF/CK19 in control mice were shown. Magnification, 20× (scale bar=50 µm). VP, verteporfin; MF, metformin. Quantitative analysis of stained areas in percentage (%) was quantified by the QuPath software. n=4. *, P<0.05, **, P<0.01, ***, P<0.001, ANOVA; test of normality by Shapiro-Wilk (P>0.05). The results are shown as mean ± standard error of the mean.
Figure 3.
Figure 3.
YAP/CTGF is dysregulated in the Abcb4-/- model and is associated with markers indicating ductular reaction and epithelial-mesenchymal transition (EMT), which could be ameliorated by verteporfin and metformin. Immunohistochemical staining of CK19 (A), S100A4 (C), YAP (E), and CTGF (G) in liver tissues of Abcb4-/- model and FVB/N wildtype (WT) control mice were performed. Magnification, 10× (scale bar=100 µm) and 40× (scale bar=20 µm). The squares in dashed lines indicated the areas shown in 40-folds images. Quantitative analysis of CK19 (B), S100A4 (D), YAP (F), and CTGF (H) stained areas in percentage (%) by whole slide scanning is shown. n=5. (I-J) H&E and sirius red staining were performed and quantitative analysis of the fibrotic areas was shown in percentage (%) (K). Magnification, 20× (scale bar=50 µm). n=5. (L) Volcano plot of Abcb4-heterozygotes (+/-) vs. Abcb4-KO (-/-) from the GSE4612 database was generated. Each dot represents a single gene. Horizontal axis: fold change (in log2 scale); vertical axis: adjusted P-value (in log10 scale). Upregulated genes are marked in red; downregulated genes are marked in blue. Dotted vertical lines highlight fold changes of -1 and +1, and the dotted horizontal line indicates P-value < 0.05. (M, N) Gene expression values of YAP and CTGF in comparison between Abcb4+/- and Abcb4-/- from GSE4612. n=6. **, P<0.01, ***, P<0.001, t-test; test of normality by Shapiro-Wilk (P>0.05). The results are shown as mean ± standard error of the mean. (O) Cluster analysis of differential gene expression was shown. (P) Immunohistochemistry was performed to stain the biliary epithelial cells (positive for CK19) in the liver. Representative images and quantitative analysis were shown (Q). (R) Immuno-histochemistry was performed to evaluate the number of cells undergoing EMT (positive for S100A4). Representative images and quantitative analysis were shown (S). Quantitative analysis of stained areas in percentage (%) was quantified by the QuPath software. (T) The treatments did not cause significant liver alterations when evaluated by H&E staining of liver (black arrows indicated biliary fibrosis). Magnification, 10× (scale bar=100 µm) and 40× (scale bar=20 µm). VP, verteporfin; MF, metformin. n=4. *, P<0.05, **, P<0.01, ANOVA; test of normality by Shapiro-Wilk (P>0.05). The results are shown as mean ± standard error of the mean. The squares in dashed lines indicated the areas shown in 40-folds images.
Figure 4.
Figure 4.
Targeting YAP signaling in human biliary epithelial cells (H69) and in human bile duct carcinoma cells (TFK-1). (A) Protein expression of p-YAP, YAP, and CTGF was investigated upon TGF-β (5 ng/ml) stimulation for 48 hours after siRNA silencing of YAP in human H69 cells. These experiments were repeated three times independently. (B) siRNA targeting YAP inhibited upregulation of integrin αVβ6/TGF-β1 signaling and TGF-β mediated EMT in human H69 cells. These experiments were repeated three times independently. (C) Immunofluorescence staining of S100A4 and E-cadherin were shown in H69 cells under TGF-β stimulation. These experiments were repeated three times independently. Magnification, 20×, scale bar=50 µm. (D) Cell proliferation was assessed by Sybr green assay in H69 cells under TGF-β stimulation. n=4. The values were normalized to the mean of the control group in percentage (%). (E) Cell proliferation was assessed by Sybr green assay in TFK-1 cells after siRNA targeting YAP or CTGF. n=5. The values were normalized to the mean of the control group in percentage (%). **, P<0.01, t-test; test of normality by Shapiro-Wilk (P>0.05). The results are shown as mean ± standard error of the mean.
Figure 5.
Figure 5.
The expression of YAP in phHSC is regulated by mechanosignaling when assessed by floating 3D hanging drop cultures compared to adhering 2D plastic cell cultures. (A) Illustrating the principle of hanging drop cultures to reduce environmental stiffness in comparison to 2D culture. (B, C) Bright field images of hanging drop culture (B) and adhering 2D cultures (C) of phHSC after 0 h, 24 h, 48 h, and 72 h were illustrated. Magnification, 5× and 10×, scale bar=50 µm. (D) Alamar blue cell proliferation assay of hanging drop and 2D culture was indicated. n=3. The values were normalized to the mean of the control group in percentage (%).(E) Quantitative rt-PCR was performed to assess the expression of ACTA2 (2-∆∆Ct) in phHSC of hanging drop and 2D culture. (F, G) The pictures illustrated Hoechst/PI cell death staining of hanging drop culture (F) and of 2D culture (G) of phHSC. Magnification, 5×, scale bar=50 µm. (H) Relative fluorescence unit (RFU) of Hoechst (excitation 361 nm; emission 486 nm) and PI in hanging drop and 2D culture of phHSC. n=3. (I) PI and Hoechst ratio was calculated. n=3. (J) The protein expression of phospho (p)-YAP and YAP was assessed by western blot in hanging drop and 2D cultures of phHSC. The quantitative densitometry of p-YAP and YAP were normalized to baseline (GAPDH) and the ratio was calculated accordingly (K). (L) Protein expression of YAP in nuclear and cytoplasm was assessed by western blot in hanging drop and 2D cultures of phHSC in 72h. These experiments were repeated three times independently. n. s., not significant. *, P<0.05, **, P<0.01, ***, P<0.001, ANOVA; test of normality by Shapiro-Wilk (P>0.05). The results are shown as mean ± standard error of the mean. The squares in dashed lines indicated the areas shown in 10-folds images.
Figure 6.
Figure 6.
Environmental stiffness mediates proliferation, activation, and YAP expression in phHSC. (A) The figure illustrated the experimental design that intended to study the effects of transferring phHSC from 3D to 2D on day 13 of culture. As control groups used here: i. purely in 3D cultured phHSC; and ii. phHSC that were harvested on day 13 (the day of transferring from 3D to 2D). (B) Freshly isolated phHSC were cultured in 3D matrigel under stimulation with TGF-β (10 ng/ml) till day 13 and were then transferred to 2D plastic cultures and kept until day 24. Magnification, 5× and 10×, scale bar=50 µm. (C) Sequential images of phHSC cultured in 3D matrigel were illustrated. Magnification, 10×, scale bar=50 µm. (D) Alamar blue cell proliferation assays were performed. n=4. The values were normalized to the mean of the control group in percentage (%). Relative fluorescence unit (RFU) of Hoechst (excitation 361 nm; emission 486 nm) (E), PI (F), and PI/Hoechst ratio (G) of phHSC were measured. n=4. (H) The image illustrated representative Hoechst/PI staining of phHSC under different culture conditions. Magnification, 5×, scale bar=50 µm. (I) Quantitative rt-PCR was performed to assess the expression of ACTA2, collagen IαI, and YAP (2-∆∆Ct) in phHSC. n=3. The values shown were normalized based on the mean of GAPDH and 36B4 in indicated control group. *, P<0.05, **, P<0.01, ***, P<0.001, ANOVA; test of normality by Shapiro-Wilk (P>0.05). The results are shown as mean ± standard error of the mean. The squares in dashed lines indicated the areas shown in 10-folds images.
Figure 7.
Figure 7.
YAP as a target for the treatment of PSC and its mechanism of action. BEC, biliary epithelial cells; CCA, cholangiocellular carcinoma; EMT, epithelial-mesenchymal transition; qHSC, quiescent hepatic stellate cells.

References

    1. Bataller R, Brenner DA (2005). Liver fibrosis. J Clin Invest, 115:209-218. - PMC - PubMed
    1. Poynard T, Lebray P, Ingiliz P, Varaut A, Varsat B, Ngo Y, et al.. (2010). Prevalence of liver fibrosis and risk factors in a general population using non-invasive biomarkers (FibroTest). BMC Gastroenterol, 10:40. - PMC - PubMed
    1. Mokdad AA, Lopez AD, Shahraz S, Lozano R, Mokdad AH, Stanaway J, et al.. (2014). Liver cirrhosis mortality in 187 countries between 1980 and 2010: a systematic analysis. BMC Med, 12:145. - PMC - PubMed
    1. Mannaerts I, Leite SB, Verhulst S, Claerhout S, Eysackers N, Thoen LF, et al.. (2015). The Hippo pathway effector YAP controls mouse hepatic stellate cell activation. J Hepatol, 63:679-688. - PubMed
    1. Martin K, Pritchett J, Llewellyn J, Mullan AF, Athwal VS, Dobie R, et al.. (2016). PAK proteins and YAP-1 signalling downstream of integrin beta-1 in myofibroblasts promote liver fibrosis. Nat Commun, 7:12502. - PMC - PubMed

LinkOut - more resources