

Viral emissions into the air and environment after SARS-CoV-2 human challenge: a phase 1, open label, first-in-human study
- PMID: 37307844
- PMCID: PMC10256269
- DOI: 10.1016/S2666-5247(23)00101-5
Viral emissions into the air and environment after SARS-CoV-2 human challenge: a phase 1, open label, first-in-human study
Erratum in
-
Correction to Lancet Microbe 2023; published online June 9. https://doi.org/10.1016/S2666-5247(23)00101-5.Lancet Microbe. 2023 Aug;4(8):e576. doi: 10.1016/S2666-5247(23)00209-4. Epub 2023 Jun 28. Lancet Microbe. 2023. PMID: 37392751 Free PMC article. No abstract available.
Abstract
Background: Effectively implementing strategies to curb SARS-CoV-2 transmission requires understanding who is contagious and when. Although viral load on upper respiratory swabs has commonly been used to infer contagiousness, measuring viral emissions might be more accurate to indicate the chance of onward transmission and identify likely routes. We aimed to correlate viral emissions, viral load in the upper respiratory tract, and symptoms, longitudinally, in participants who were experimentally infected with SARS-CoV-2.
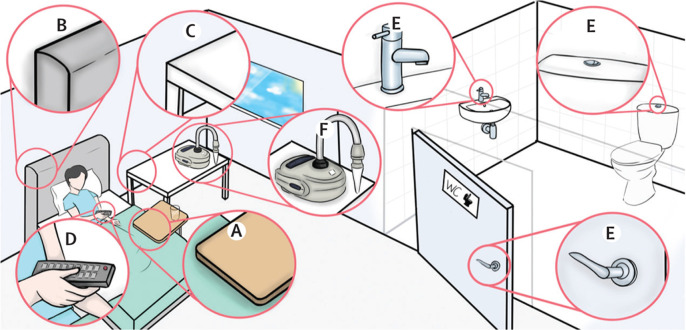
Methods: In this phase 1, open label, first-in-human SARS-CoV-2 experimental infection study at quarantine unit at the Royal Free London NHS Foundation Trust, London, UK, healthy adults aged 18-30 years who were unvaccinated for SARS-CoV-2, not previously known to have been infected with SARS-CoV-2, and seronegative at screening were recruited. Participants were inoculated with 10 50% tissue culture infectious dose of pre-alpha wild-type SARS-CoV-2 (Asp614Gly) by intranasal drops and remained in individual negative pressure rooms for a minimum of 14 days. Nose and throat swabs were collected daily. Emissions were collected daily from the air (using a Coriolis μ air sampler and directly into facemasks) and the surrounding environment (via surface and hand swabs). All samples were collected by researchers, and tested by using PCR, plaque assay, or lateral flow antigen test. Symptom scores were collected using self-reported symptom diaries three times daily. The study is registered with ClinicalTrials.gov, NCT04865237.
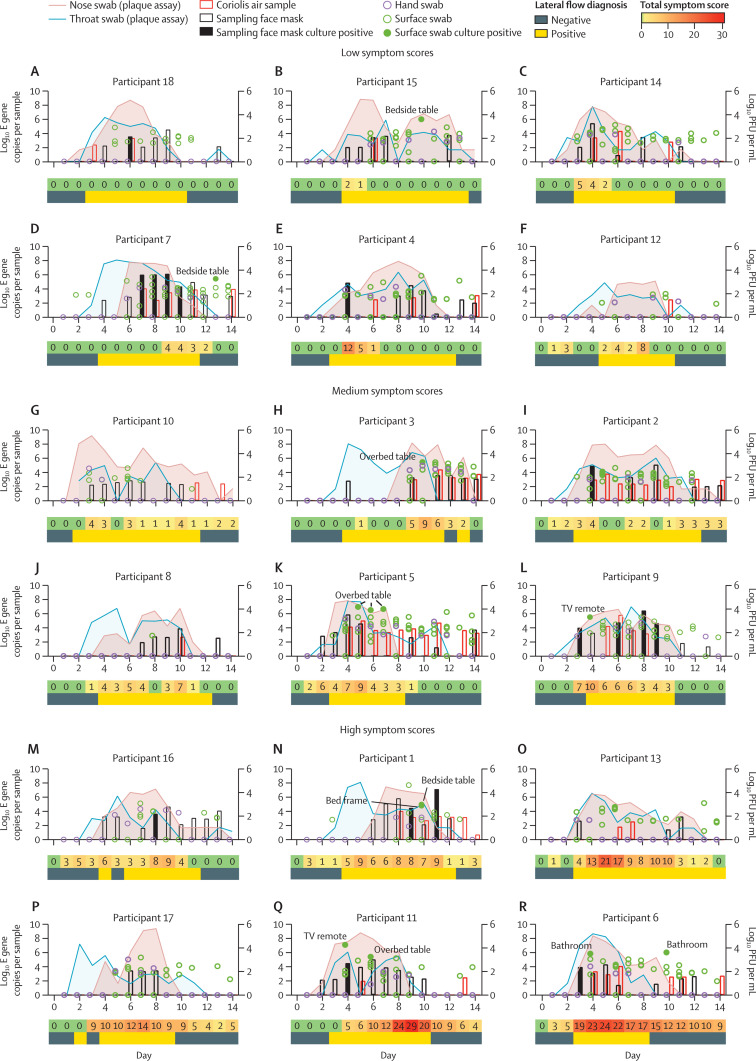
Findings: Between March 6 and July 8, 2021, 36 participants (ten female and 26 male) were recruited and 18 (53%) of 34 participants became infected, resulting in protracted high viral loads in the nose and throat following a short incubation period, with mild-to-moderate symptoms. Two participants were excluded from the per-protocol analysis owing to seroconversion between screening and inoculation, identified post hoc. Viral RNA was detected in 63 (25%) of 252 Coriolis air samples from 16 participants, 109 (43%) of 252 mask samples from 17 participants, 67 (27%) of 252 hand swabs from 16 participants, and 371 (29%) of 1260 surface swabs from 18 participants. Viable SARS-CoV-2 was collected from breath captured in 16 masks and from 13 surfaces, including four small frequently touched surfaces and nine larger surfaces where airborne virus could deposit. Viral emissions correlated more strongly with viral load in nasal swabs than throat swabs. Two individuals emitted 86% of airborne virus, and the majority of airborne virus collected was released on 3 days. Individuals who reported the highest total symptom scores were not those who emitted most virus. Very few emissions occurred before the first reported symptom (7%) and hardly any before the first positive lateral flow antigen test (2%).
Interpretation: After controlled experimental inoculation, the timing, extent, and routes of viral emissions was heterogeneous. We observed that a minority of participants were high airborne virus emitters, giving support to the notion of superspreading individuals or events. Our data implicates the nose as the most important source of emissions. Frequent self-testing coupled with isolation upon awareness of first symptoms could reduce onward transmissions.
Funding: UK Vaccine Taskforce of the Department for Business, Energy and Industrial Strategy of Her Majesty's Government.
Copyright © 2023 The Author(s). Published by Elsevier Ltd. This is an Open Access article under the CC BY-NC-ND 4.0 license. Published by Elsevier Ltd.. All rights reserved.
Conflict of interest statement
Declaration of interests MK, AJM, and APC are employees of hVIVO Services and hold shares in Open Orphan and Poolbeg Pharma. All other authors declare no competing interests.
Figures


Comment in
-
Is it possible to generalise superspreading individuals or events of SARS-CoV-2?Lancet Microbe. 2023 Nov;4(11):e858. doi: 10.1016/S2666-5247(23)00253-7. Epub 2023 Aug 25. Lancet Microbe. 2023. PMID: 37640038 No abstract available.
-
Is it possible to generalise superspreading individuals or events of SARS-CoV-2? - Authors' reply.Lancet Microbe. 2023 Nov;4(11):e859. doi: 10.1016/S2666-5247(23)00254-9. Epub 2023 Aug 25. Lancet Microbe. 2023. PMID: 37640040 No abstract available.
References
-
- Topol EJ, Iwasaki A. Operation nasal vaccine-lightning speed to counter COVID-19. Sci Immunol. 2022;7 - PubMed
-
- Edwards KM, Neuzil KM. Understanding COVID-19 through human challenge models. Nat Med. 2022;28:903–904. - PubMed
-
- Puhach O, Adea K, Hulo N, et al. Infectious viral load in unvaccinated and vaccinated individuals infected with ancestral, delta or omicron SARS-CoV-2. Nat Med. 2022;28:1491–1500. - PubMed
Publication types
MeSH terms
Associated data
Grants and funding
LinkOut - more resources
Full Text Sources
Medical
Research Materials
Miscellaneous
