. 2023 Jul;299(7):104907.
doi: 10.1016/j.jbc.2023.104907. Epub 2023 Jun 10.

Thymine DNA glycosylase mediates chromatin phase separation in a DNA methylation-dependent manner

Affiliations

Thymine DNA glycosylase mediates chromatin phase separation in a DNA methylation-dependent manner

Lauren A McGregor et al. J Biol Chem. 2023 Jul.

Abstract

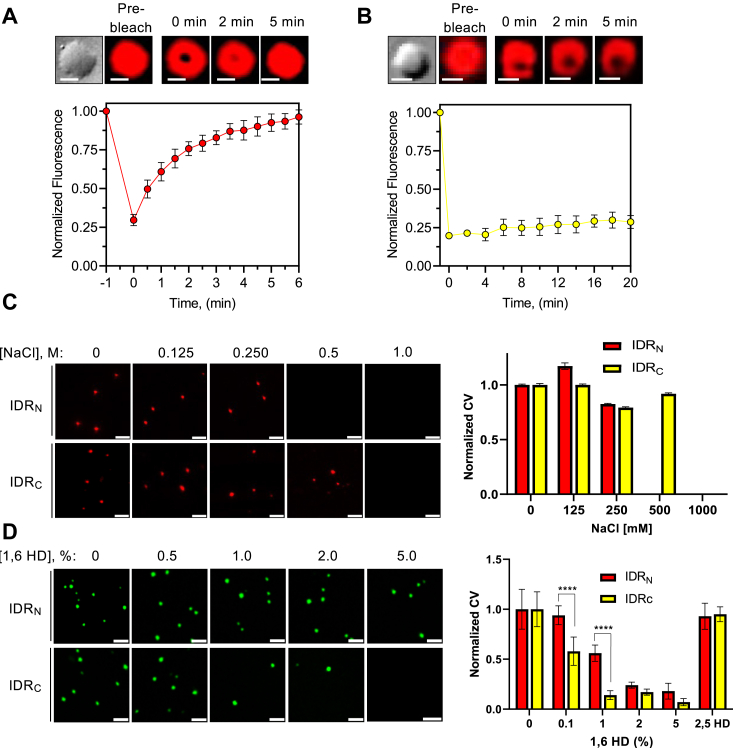
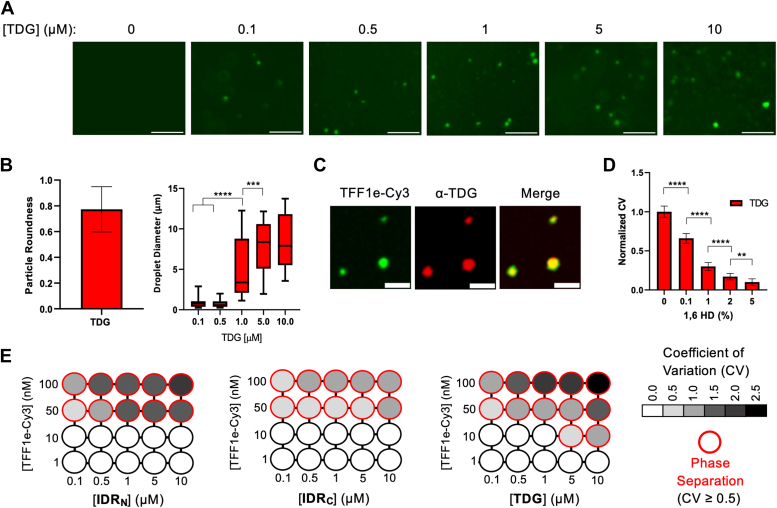
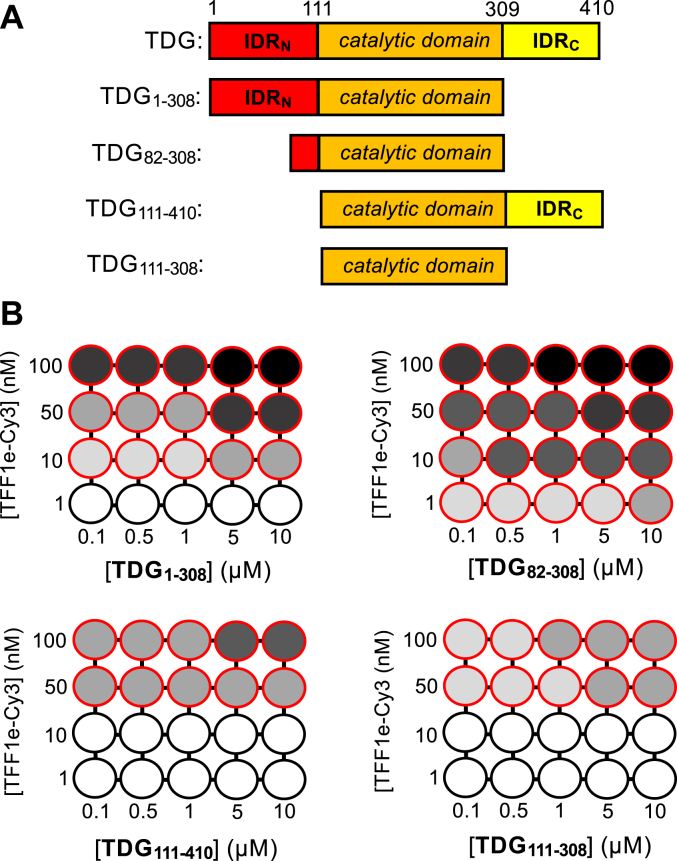
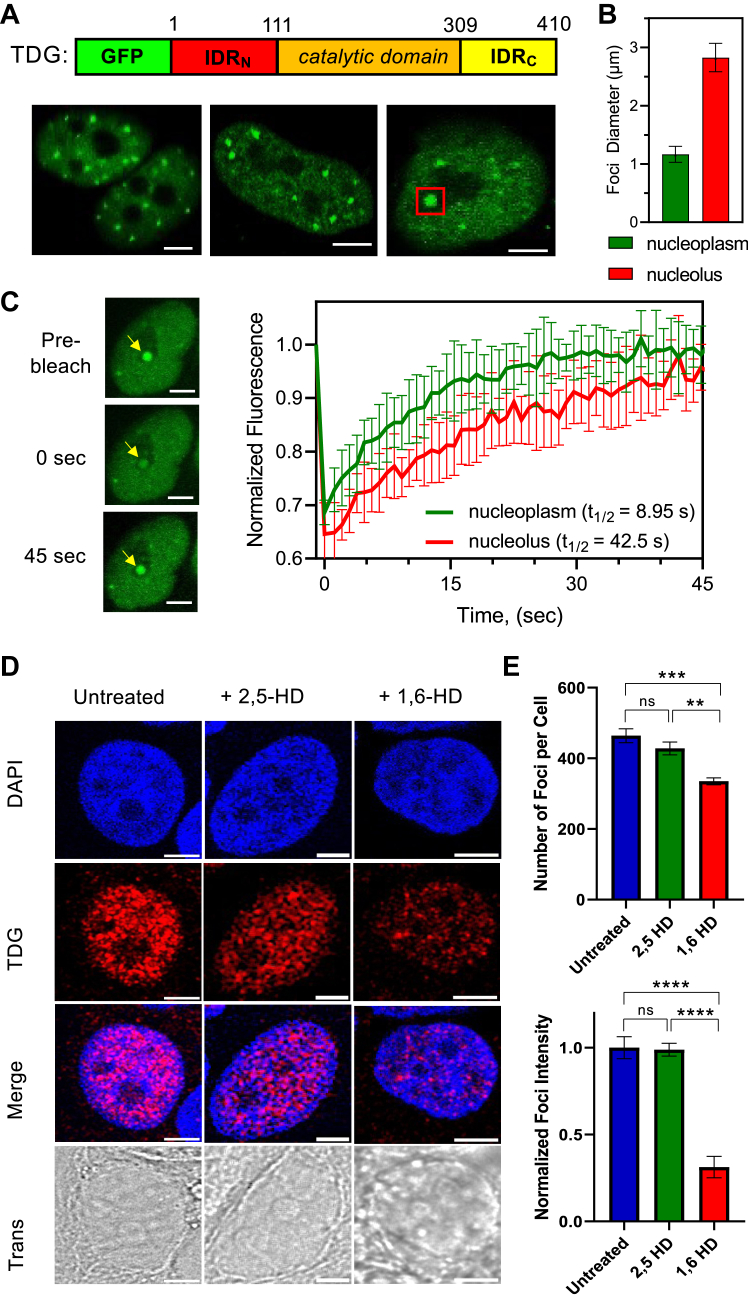
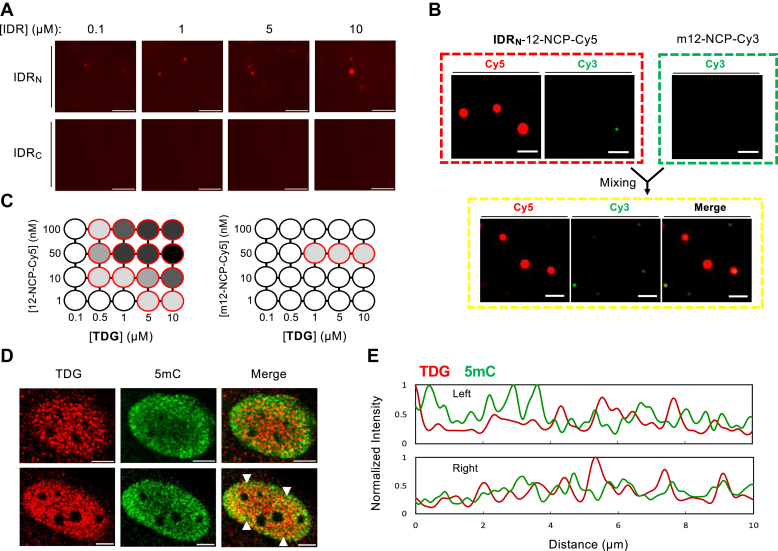
Thymine DNA glycosylase (TDG) is an essential enzyme involved in numerous biological pathways, including DNA repair, DNA demethylation, and transcriptional activation. Despite these important functions, the mechanisms surrounding the actions and regulation of TDG are poorly understood. In this study, we demonstrate that TDG induces phase separation of DNA and nucleosome arrays under physiologically relevant conditions in vitro and show that the resulting chromatin droplets exhibited behaviors typical of phase-separated liquids, supporting a liquid-liquid phase separation model. We also provide evidence that TDG has the capacity to form phase-separated condensates in the cell nucleus. The ability of TDG to induce chromatin phase separation is dependent on its intrinsically disordered N- and C-terminal domains, which in isolation, promote the formation of chromatin-containing droplets having distinct physical properties, consistent with their unique mechanistic roles in the phase separation process. Interestingly, DNA methylation alters the phase behavior of the disordered domains of TDG and compromises formation of chromatin condensates by full-length TDG, indicating that DNA methylation regulates the assembly and coalescence of TDG-mediated condensates. Overall, our results shed new light on the formation and physical nature of TDG-mediated chromatin condensates, which have broad implications for the mechanism and regulation of TDG and its associated genomic processes.

Keywords: DNA demethylation; DNA repair; biological condensate; liquid–liquid phase separation; thymine DNA glycosylase.


Conflict of interest statement

Conflict of interest The authors declare that they have no conflicts of interest with the contents of this article.

Figures

Figure 1
Figure 1
TDG’s IDRs induce phase separation of chromatin.A, diagram of the structural domains of TDG and their predicted disorder probability (PrDOS) (68). B, representative confocal fluorescent microscopy images of 12-NCP-Cy5 chromatin (25 nM) in the presence of the indicated [IDR]. Droplets were formed in the presence of LLPS buffer (10 mM Hepes [pH 7.2], 100 mM KCl, and 1 mM MgCl2) containing 5% PEG. C and D, circularity and diameter of individual chromatin droplets formed by TDG’s IDRs. Data are mean ± SD (n > 600 droplets). ∗∗p < 0.01; ∗∗∗∗p < 0.0001. E, time-lapse images of an IDRN-chromatin droplet fusion event. Droplets were formed by combining 25 nM 12-NCP-Cy5 with 5 μM IDRN. F and G, representative confocal fluorescent microscopy images demonstrating that 12-NCP-Cy3 chromatin (50 nM) penetrates into preformed IDRN-12-NCP-Cy5 (F) and IDRC-12-NCP-Cy5 (G) droplets generated by mixing 5 μM of the IDR with 12.5 nM chromatin. Scale bars for zoom insets in B represents 2 μm. All other scale bars represent 5 μm. IDR, intrinsically disordered region; LLPS, liquid–liquid phase separation; TDG, thymine DNA glycosylase.
Figure 2
Figure 2
Unique phase behavior of TDG’s IDRs.A and B, confocal fluorescent microscopy images and FRAP curve of 12-NCP-Cy3 chromatin condensates formed by IDRN (A) and IDRC (B). Droplets were formed by combining 25 nM 12-NCP-Cy3 with 5 μM IDRN or 10 μM IDRC. Data are mean ± SD (n = 3). Scale bars represent 5 μm. C, confocal fluorescence microscopy images and normalized CV analysis of 12-NCP-Cy5 chromatin (25 nM) condensates formed by TDG’s IDRs (5 μM) following the addition of NaCl. Data are mean ± SD (n = 10 images). D, confocal fluorescence microscopy images and normalized CV analysis of 12-NCP-Cy3 chromatin (25 nM) condensates formed by TDG’s IDRs (5 μM) following the addition of 1,6-HD. Data are mean ± SD (n = 10 images). ∗∗∗∗p < 0.0001. All scale bars represent 5 μm. Buffer conditions are the same as described for Figure 1, except where indicated. 1,6-HD, 1,6-hexanediol; FRAP, fluorescence recovery after photobleaching; IDR, intrinsically disordered region; TDG, thymine DNA glycosylase.
Figure 3
Figure 3
Full-length TDG induces phase separation of TFF1-derived chromatin.A, representative wide-field fluorescent microscopy images of TFF1e-Cy3 chromatin (100 nM) in the presence of the TDG. Scale bars represent 5 μm. B, Circularity and diameter of individual chromatin droplets formed by TDG. Data are mean ± SD (n > 600 droplets). C, representative wide-field fluorescent microscopy images demonstrating that Cy5-labled anti-TDG antibody (α-TDG360–410) penetrates into preformed TFF1e-Cy3-TDG droplets generated by mixing 1 μM TDG with 25 nM chromatin. Scale bars represent 5 μm. D, normalized CV analysis of TFF1e-Cy3 chromatin (25 nM) condensates formed by TDG (5 μM) following the addition of 1,6-HD. Data are mean ± SD (n = 10 images). ∗∗p < 0.01; ∗∗∗∗p < 0.0001. E, phase diagrams of TFF1e-Cy3 chromatin under varying conditions. Red circles indicate phase separation. The grayscale indicates CV calculated from representative images (n = 10; Fig. S8). 1,6-HD, 1,6-hexanediol; TDG, thymine DNA glycosylase.
Figure 4
Figure 4
TDG-mediated chromatin phase separation is regulated by its IDRs.A, TDG domains and truncated variants discussed in this work. B, phase diagrams of TFF1e-Cy5 chromatin and TDG truncations under varying conditions. Red circles indicate phase separation. The grayscale indicates CV as described for Figure 3E (Fig. S9). IDR, intrinsically disordered region; TDG, thymine DNA glycosylase.
Figure 5
Figure 5
TDG forms condensates in cells.A, representative confocal fluorescent microscopy images of HeLa cells transfected with TDG fused to GFP. Red box indicates a larger TDG condensate in the nucleolus. Scale bars represent 5 μm. B, diameter of individual chromatin droplets formed by TDG in live HeLa cells. Data are mean ± SD (nucleoplasm: n = 10 cells, nucleolus: n = 3 cells). C, confocal fluorescent microscopy images and FRAP curve of GFP-TDG in HeLa cells. Data are mean ± SD (nucleoplasm: n = 10 cells, nucleolus: n = 3 cells). Scale bars represent 5 μm. D, representative fluorescent microscopy images of endogenous TDG showing loss of TDG foci upon 1,6-HD treatment. TDG was detected by immunostaining-fixed cells with TDG-specific antibody. Scale bars represent 5 μm. E, quantification of foci number and intensity upon of TDG with either 2,5-HD or 1,6-HD. Foci number are mean ± SD (n = 3 cells) for pre- and post-10 min treatment. Foci intensity is mean ± SD for 464, 428, and 335 individual foci pre-, post-2,5-HD, and post-1,6-HD treatment, respectively. ∗∗p < 0.01; ∗∗∗p < 0.001; and ∗∗∗∗p < 0.0001. 1,6-HD, 1,6-hexanediol; 2,5-HD, 2,5-hexanediol; FRAP, fluorescence recovery after photobleaching; TDG, thymine DNA glycosylase.
Figure 6
Figure 6
DNA methylation regulates TDG-mediated chromatin phase separation.A, representative wide-field fluorescent microscopy images of mDNA207 (250 nM) in the presence of the indicated [IDR]. Scale bars represent 25 μm. B, methylated chromatin m12-NCP-Cy3 (50 nM) is unable to mix with preformed IDRN-12-NCP-Cy5 droplets generated by mixing 5 μM TDG with 12.5 nM chromatin. Similar data for IDRC-12-NCP-Cy5 droplets are presented in Fig. S15. Scale bars represent 5 μm. C, phase diagrams of TDG with unmethylated (12-NCP-Cy3) or methylated (m12-NCP-Cy3) chromatin under varying conditions. Red circles indicate phase separation. The grayscale indicates CV as described for Figure 3E. D, representative fluorescent microscopy images of endogenous TDG and 5mC as detected by immunostaining fixed cells with the corresponding antibody. Scale bars represent 5 μm. Pearson’s coefficient: 0.116 ± 0.04 (n = 15 cells). E, normalized fluorescence signal intensities of TDG (red) and 5mC (green) in the nuclei along the line (from left to right) indicated by white arrowheads in (D). 5mC, 5-methylcytosine; IDR, intrinsically disordered region; TDG, thymine DNA glycosylase.

Similar articles

Cited by

References

    1. Dignon G.L., Best R.B., Mittal J. Biomolecular phase separation: from molecular driving forces to macroscopic properties. Annu. Rev. Phys. Chem. 2020;71:53–75. - PMC - PubMed
    1. Banani S.F., Lee H.O., Hyman A.A., Rosen M.K. Biomolecular condensates: organizers of cellular biochemistry. Nat. Rev. Mol. Cell Biol. 2017;18:285–298. - PMC - PubMed
    1. Shin Y., Brangwynne Clifford P. Liquid phase condensation in cell physiology and disease. Science. 2017;357 - PubMed
    1. Gibson B.A., Doolittle L.K., Schneider M.W.G., Jensen L.E., Gamarra N., Henry L., et al. Organization of chromatin by intrinsic and regulated phase separation. Cell. 2019;179:470–484. - PMC - PubMed
    1. Su X., Ditlev Jonathon A., Hui E., Xing W., Banjade S., Okrut J., et al. Phase separation of signaling molecules promotes T cell receptor signal transduction. Science. 2016;352:595–599. - PMC - PubMed

Publication types

LinkOut - more resources