Local pH at Nonionic and Zwitterionic Lipid/Water Interfaces Revealed by Heterodyne-Detected Electronic Sum-Frequency Generation: A Unified View to Predict Interfacial pH of Biomembranes
- PMID: 37308160
- PMCID: PMC10292198
- DOI: 10.1021/acs.jpcb.3c02002
Local pH at Nonionic and Zwitterionic Lipid/Water Interfaces Revealed by Heterodyne-Detected Electronic Sum-Frequency Generation: A Unified View to Predict Interfacial pH of Biomembranes
Abstract
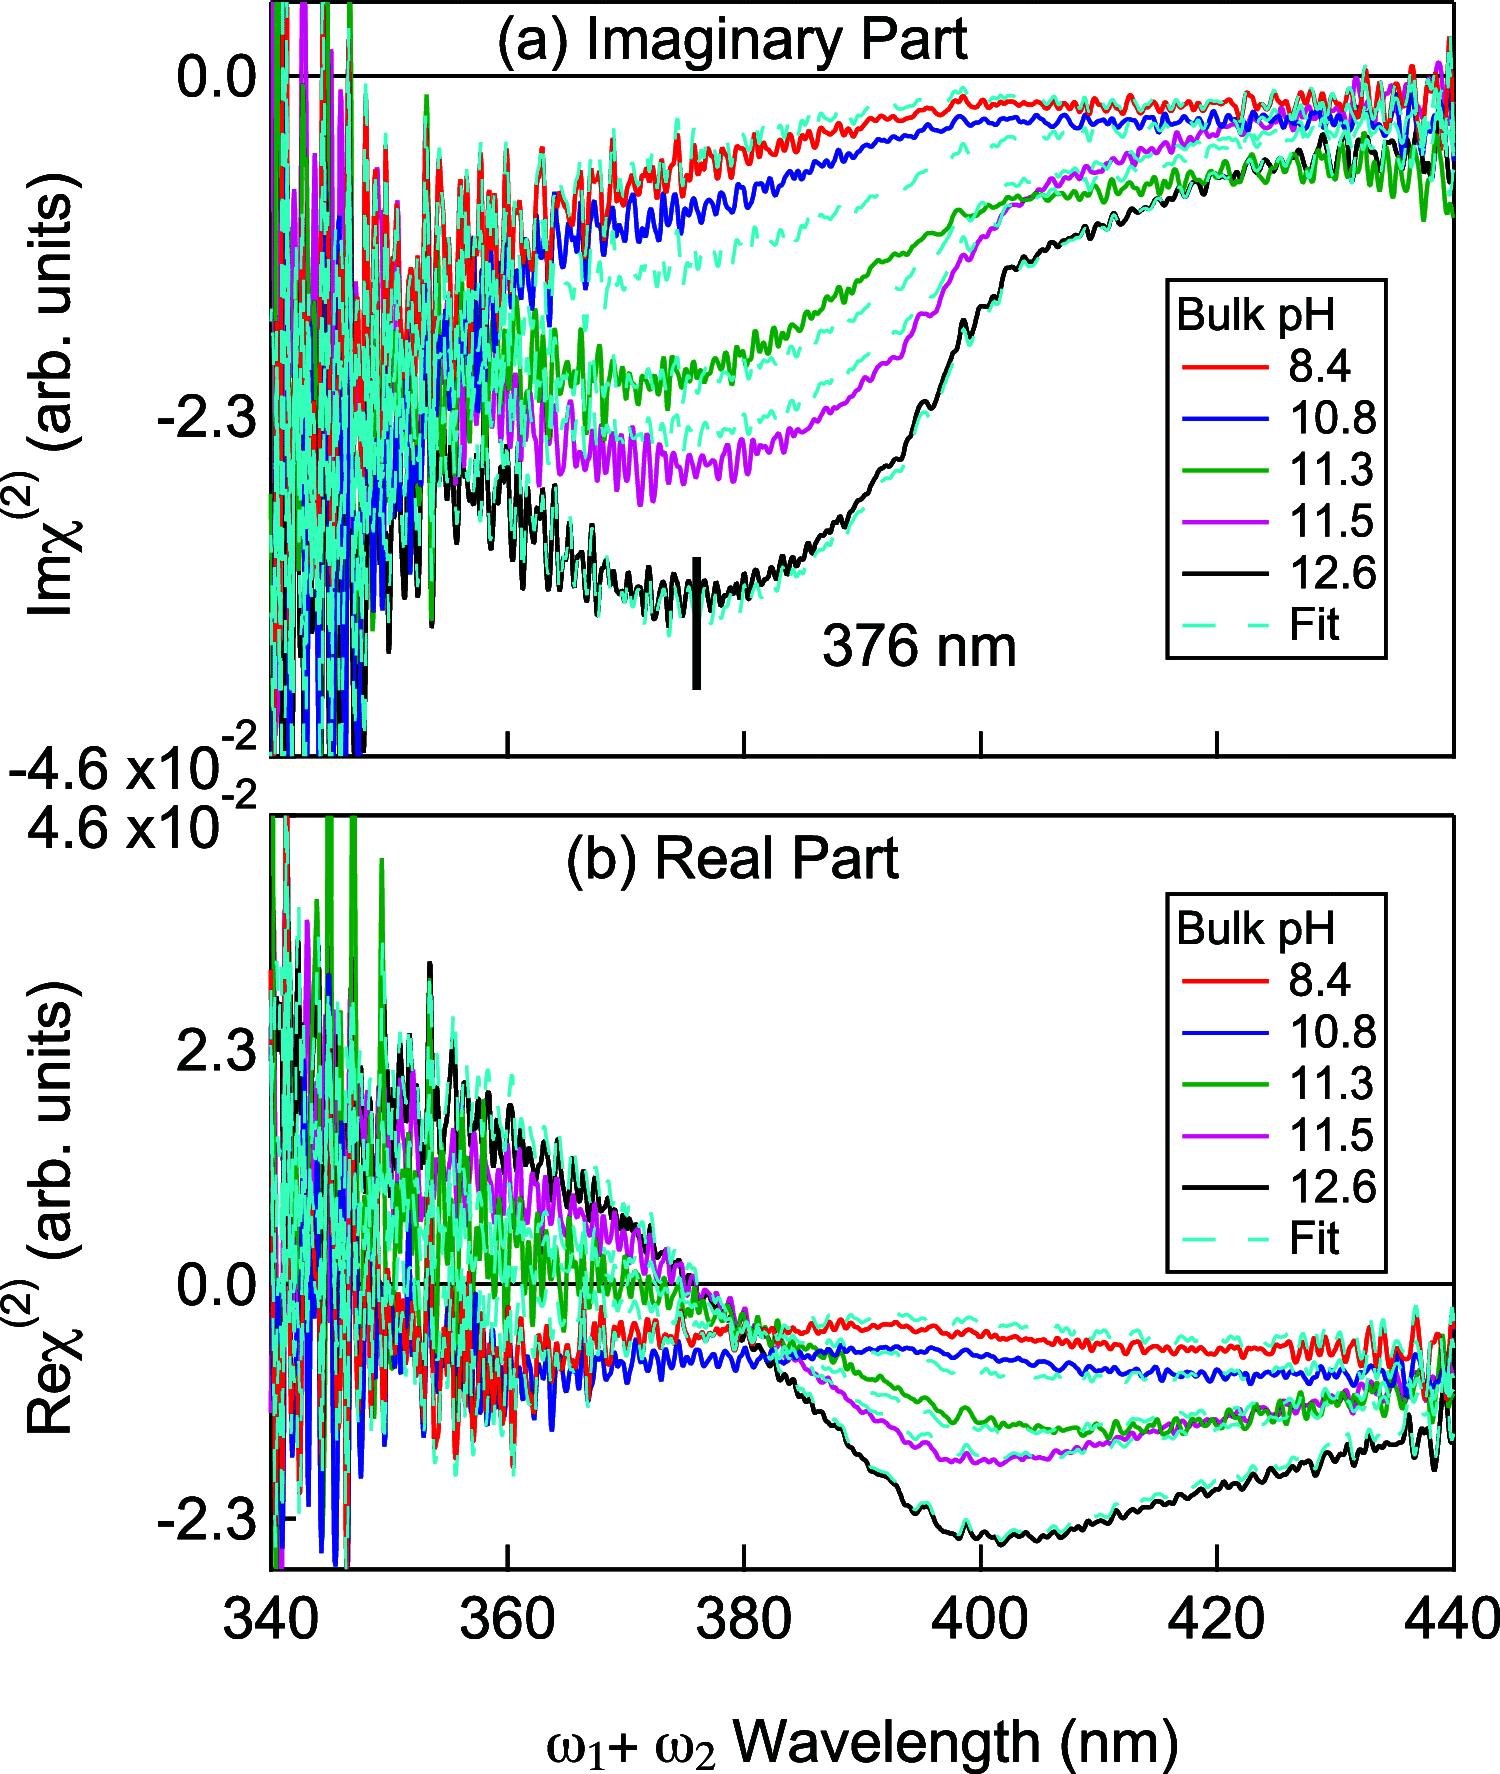
For biomembranes, which are composed of neutral as well as charged lipids, the local pH at lipid/water interfaces is extremely important in their structural formation and functional activity. In our previous study of the charged lipid/water interfaces, we found that the local pH at the interface is governed by the positive or negative sign of the charge of the lipid: i.e., the local pH is dictated by the repulsive or attractive electrostatic interaction between the charged lipid headgroup and the proton. Because of the lack of net charge in the headgroup of the neutral lipid, the factor determining the local pH at neutral lipid/water interfaces is less straightforward, and therefore it is more challenging to predict the local pH. Here we apply heterodyne-detected electronic sum frequency generation (HD-ESFG) spectroscopy to nonionic and zwitterionic lipids to investigate the local pH at the neutral lipid/water interfaces. The obtained results indicate that the local pH at the nonionic lipid/water interface is higher than in bulk water by 0.8 whereas the local pH at the zwitterionic lipid/water interface is lower by 0.6, although the latter is subject to significant uncertainty. The present HD-ESFG study on neutral lipids, combined with the previous study on charged lipids, presents a unified view to consider the local pH at biomembranes based on the balance between the electrostatic interaction and the hydrophobicity provided by the lipid.
Conflict of interest statement
The authors declare no competing financial interest.
Figures


Similar articles
-
Structure and orientation of water at charged lipid monolayer/water interfaces probed by heterodyne-detected vibrational sum frequency generation spectroscopy.J Am Chem Soc. 2010 Aug 11;132(31):10656-7. doi: 10.1021/ja104327t. J Am Chem Soc. 2010. PMID: 20681689
-
Three distinct water structures at a zwitterionic lipid/water interface revealed by heterodyne-detected vibrational sum frequency generation.J Am Chem Soc. 2012 May 9;134(18):7842-50. doi: 10.1021/ja300658h. Epub 2012 Apr 26. J Am Chem Soc. 2012. PMID: 22533664
-
Femtosecond Hydrogen Bond Dynamics of Bulk-like and Bound Water at Positively and Negatively Charged Lipid Interfaces Revealed by 2D HD-VSFG Spectroscopy.Angew Chem Int Ed Engl. 2016 Aug 26;55(36):10621-5. doi: 10.1002/anie.201603676. Epub 2016 Aug 2. Angew Chem Int Ed Engl. 2016. PMID: 27482947 Free PMC article.
-
DNA-Induced Reorganization of Water at Model Membrane Interfaces Investigated by Heterodyne-Detected Vibrational Sum Frequency Generation Spectroscopy.J Phys Chem B. 2022 Feb 3;126(4):840-846. doi: 10.1021/acs.jpcb.1c08581. Epub 2022 Jan 21. J Phys Chem B. 2022. PMID: 35060730
-
Engineering and Characterization of Peptides and Proteins at Surfaces and Interfaces: A Case Study in Surface-Sensitive Vibrational Spectroscopy.Acc Chem Res. 2016 Jun 21;49(6):1149-57. doi: 10.1021/acs.accounts.6b00091. Epub 2016 May 18. Acc Chem Res. 2016. PMID: 27188920 Review.
Cited by
-
Spontaneous Appearance of Triiodide Covering the Topmost Layer of the Iodide Solution Interface Without Photo-Oxidation.Environ Sci Technol. 2024 Feb 27;58(8):3830-3837. doi: 10.1021/acs.est.3c08243. Epub 2024 Feb 14. Environ Sci Technol. 2024. PMID: 38353041 Free PMC article.
References
Publication types
MeSH terms
Substances
LinkOut - more resources
Full Text Sources

