. 2023 Aug 2;43(31):5642-5655.
doi: 10.1523/JNEUROSCI.0626-23.2023. Epub 2023 Jun 12.

Recurrent Circuits Amplify Corticofugal Signals and Drive Feedforward Inhibition in the Inferior Colliculus

Affiliations

Recurrent Circuits Amplify Corticofugal Signals and Drive Feedforward Inhibition in the Inferior Colliculus

Hannah M Oberle et al. J Neurosci. .

Abstract

The inferior colliculus (IC) is a midbrain hub critical for perceiving complex sounds, such as speech. In addition to processing ascending inputs from most auditory brainstem nuclei, the IC receives descending inputs from auditory cortex that control IC neuron feature selectivity, plasticity, and certain forms of perceptual learning. Although corticofugal synapses primarily release the excitatory transmitter glutamate, many physiology studies show that auditory cortical activity has a net inhibitory effect on IC neuron spiking. Perplexingly, anatomy studies imply that corticofugal axons primarily target glutamatergic IC neurons while only sparsely innervating IC GABA neurons. Corticofugal inhibition of the IC may thus occur largely independently of feedforward activation of local GABA neurons. We shed light on this paradox using in vitro electrophysiology in acute IC slices from fluorescent reporter mice of either sex. Using optogenetic stimulation of corticofugal axons, we find that excitation evoked with single light flashes is indeed stronger in presumptive glutamatergic neurons compared with GABAergic neurons. However, many IC GABA neurons fire tonically at rest, such that sparse and weak excitation suffices to significantly increase their spike rates. Furthermore, a subset of glutamatergic IC neurons fire spikes during repetitive corticofugal activity, leading to polysynaptic excitation in IC GABA neurons owing to a dense intracollicular connectivity. Consequently, recurrent excitation amplifies corticofugal activity, drives spikes in IC GABA neurons, and generates substantial local inhibition in the IC. Thus, descending signals engage intracollicular inhibitory circuits despite apparent constraints of monosynaptic connectivity between auditory cortex and IC GABA neurons.SIGNIFICANCE STATEMENT Descending "corticofugal" projections are ubiquitous across mammalian sensory systems, and enable the neocortex to control subcortical activity in a predictive or feedback manner. Although corticofugal neurons are glutamatergic, neocortical activity often inhibits subcortical neuron spiking. How does an excitatory pathway generate inhibition? Here we study the corticofugal pathway from auditory cortex to inferior colliculus (IC), a midbrain hub important for complex sound perception. Surprisingly, cortico-collicular transmission was stronger onto IC glutamatergic compared with GABAergic neurons. However, corticofugal activity triggered spikes in IC glutamate neurons with local axons, thereby generating strong polysynaptic excitation and feedforward spiking of GABAergic neurons. Our results thus reveal a novel mechanism that recruits local inhibition despite limited monosynaptic convergence onto inhibitory networks.

Keywords: auditory; corticofugal; inferior colliculus; inhibition; synapse.


Figures

Figure 1.
Figure 1.
Auditory cortical stimulation generates IPSPs in IC neurons. A, Diagram of experiment. Whole-cell recordings are obtained from superficial IC neurons in urethane-anesthetized mice; a bipolar electrode is placed in auditory cortex to activate corticofugal fibers. B, Single 20 µs shocks to the auditory cortex evoke a brief EPSP followed by a large and long-lasting IPSP. Trace is mean ± SEM from n = 4 neurons under these conditions. C, Summary of EPSP and IPSP peak amplitude from the 4 cells averaged in B. Gray represents individual data points. Black represents mean ± SEM. Lines connect individual experiments. D, Black represents example average membrane potential changes during auditory cortex stimulation trains of different rates. Magenta represents the mean tonic membrane potential, calculated by blanking phasic PSPs via linear interpolation and smoothing the waveform with a 50 ms sliding window. Examples shown are averages from n = 4-6 cells per condition, as not all stimulation rates were tested in each experiment. E, Summary of the peak tonic hyperpolarization during different auditory cortical train stimuli shown in D. Gray lines indicate individual cells. Magenta represents mean ± SEM. F, Chronos is expressed in auditory cortex neurons via AAV injections; 2-4 weeks later, whole-cell recordings are obtained from superficial IC neurons. G, Example average traces showing EPSP-IPSP sequences following single light flashes delivered to the auditory cortex. Trace and shading are mean ± SEM from n = 8 neurons. H, Summary data from recordings as in G. Coloring is the same as in C. I, In a subset of neurons, repetitive optogenetic stimulation (80 flashes at 20 Hz) generates no apparent EPSPs, but rather tonic or phasic hyperpolarizations of the membrane potential (top and middle traces, respectively). Traces are averages of multiple trials from two different neurons. Bottom, Individual phasic IPSPs from the recording in the middle panel are aligned (gray) and averaged (black). J, Summary quantifying membrane potential hyperpolarization throughout the 80 × 20 Hz optogenetic train in n = 4 neurons without apparent corticofugal excitation. Gray traces represent individual experiments. Magenta represents mean ± SEM.
Figure 2.
Figure 2.
Differential strength of corticofugal EPSPs onto dorsal IC VGAT and VGAT+ neurons. A, Diagram of the experiment. The optogenetic activator Chronos is virally transduced into auditory cortex neurons of transgenic VGAT-ires-cre × Ai14 mice. B, Tile scan of the IC in a VGAT-cre × Ai14 mouse. An area of interest is denoted by the dashed line and shown at higher magnification in C. Scale bar, 500 µm. C, Magnification of dashed rectangle in B. The micrograph was contrast-enhanced to highlight tdTomato-positive presumptive GABA neurons and tdTomato-negative, presumptive glutamate neurons visible as dark “shadows.” Scale bar, 100 µm. D, Two to 4 weeks following surgery, optogenetically evoked EPSPs are recorded in visually targeted tdTomato-positive and negative neurons. Right, Example average EPSPs evoked by single light flashes in a VGAT (black) and VGAT+ (magenta) dorsal IC neuron. E, F, Summary data showing cumulative probability distributions for EPSP peak amplitudes (E) and half-width (F) in VGAT and VGAT+ neurons. **p < 0.01.
Figure 3.
Figure 3.
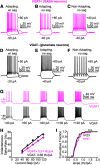
Dorsal IC VGAT and VGAT+ neurons have similar cellular properties. A–C, Examples of distinct types of hyperpolarizing and depolarizing square pulse current steps in VGAT+ neurons encountered in the shell IC. D–F, Same as in A–C, but for VGAT neurons. Of note is the striking similarity in firing patterns and membrane properties of both neuron classes. G, Example spike responses to increasing square pulse current steps in a VGAT+ (magenta) and VGAT (black) neuron. H, Instantaneous spike rate (y axis) is plotted against current step amplitude (x axis) for the two neurons of G. Lines are linear fits to the data, revealing similar slopes for the spike rate increases for the two neurons. I, Summary data showing a similar cumulative probability distribution of FI curve slopes for n = 41 VGAT+ neurons from N = 14 mice and n = 23 VGAT neurons recorded in N = 11 mice (p = 0.5, Kolmogorov–Smirnov test).
Figure 4.
Figure 4.
A subset of GABA neurons fire tonically, thus requiring only small currents to increase baseline firing rates. A, Example traces from tonic firing IC GABA neurons recorded in a VGAT-cre × Ai14 mouse in whole-cell or cell-attached modes (top and bottom, respectively). B, Summary data of tonic firing rates in IC GABA neurons recorded in the two configurations shown in A. C, Top, Example overlaid traces from a tonically firing IC GABA neuron. Middle, An EPSC-like current waveform (20 pA peak amplitude) increases spike probability in the ∼50 ms following current injection, as exemplified in the spike raster (bottom). D, Summary data from n = 8 neurons as in C, showing that small EPSC waveforms (10-20 pA) nearly double the spike probability of tonically firing GABA neurons. **p < 0.01.
Figure 5.
Figure 5.
Differential convergence of excitatory synapses onto dorsal IC VGAT and VGAT+ neurons. A, Examples of spontaneous synaptic activity in single VGAT (black) or VGAT+ (magenta) dorsal IC neurons. Scale bars apply to both panels. B, Summary of instantaneous PSP rates for the two neuron classes. C, Example mEPSCs recorded in VGAT and VGAT+ neurons. Color scheme is the same as in A. D, Summary of mEPSC rates across the two neuron classes. Similar to results with spontaneous PSPs, the instantaneous mEPSC rate was significantly higher in VGAT+ compared with VGAT neurons. *p < 0.05. ***p < 0.001.
Figure 6.
Figure 6.
Dorsal IC VGAT+ neurons receive powerful intracollicular excitation. A, Diagram of the experiment. Whole-cell voltage-clamp recordings are obtained from tdTomato-positive VGAT+ neurons in the dorsomedial shell of the IC. NMDA (200 μm) was puff-applied in the vicinity of the neuron. B, Example responses in control conditions (black) and following bath application of TTX (1 μm; magenta). Arrow indicates time of NMDA puff. Of note is the drastic increase in sEPSC rate in control that is blocked by TTX, indicating spike-driven release. Bottom, Vehicle-only (ACSF) control shows no increase in sEPSC rate. C, Summary data of NMDA-evoked event count increases in control and TTX. Bin width is 500 ms. Data are normalized to the event counts in a 2 s baseline before NMDA puff and plotted on a log-scale. Vehicle puff summary data are plotted in background (gray line). Of note are the similar event rates in vehicle and TTX recordings. Error bars and shaded region are ± SEM. D, Summary data of the mean normalized event count in a 500 ms bin for the 2 s following the NMDA puff. Black and gray points represent individual experiments and mean ± SEM, respectively. **p < 0.01.
Figure 7.
Figure 7.
Repetitive corticofugal activity drives spikes in VGAT and VGAT+ neurons. A, Top, Average spike rate histogram for n = 12 VGAT neurons during corticofugal train stimulation (n = 7 whole-cell recordings from N = 6 mice; n = 5 cell-attached attached recordings from N = 3 mice). Bottom, Three overlaid trials from an example experiment. B, EPSPs following the first two light flashes are shown at a faster time base. C, Same as in A, but for VGAT+ neurons (n = 21 whole-cell recordings from N = 15 mice). D, Same as in B, but for the example VGAT+ recording. Of note, the jittered onset and barrage-like nature of the synaptic events following the light flashes.
Figure 8.
Figure 8.
Repetitive corticofugal activity triggers polysynaptic EPSPs in a subset of VGAT+ IC neurons. A, Example EPSPs in a VGAT neuron during train stimulation of corticofugal axons. Gray traces represent individual trials. Black represents average of multiple trials. B, The first through third stimuli from A are shown at faster time base. Blue lines indicate light flashes. Of note is the short latency and low onset jitter. C, D, Same layout as in A, B, but for a VGAT+ neuron showing polysynaptic activity during corticofugal stimulation. Of note is the long latency and jittered onset of the large EPSPs, a hallmark of polysynaptic origin (asterisks). E, F, In another VGAT+ neuron, repetitive corticofugal activity generates primarily monosynaptic EPSPs similar to VGAT neurons. Layout is the same as in A–D. G, The membrane voltage following each stimulus in the 50 Hz trains is averaged and peak normalized. Black, magenta, and green traces represent data from the example VGAT and VGAT+ neurons shown above, respectively. Of note is the dual component EPSP in the VGAT+ neuron with long-latency EPSPs, suggesting a monosynaptic corticofugal input followed by a much larger recurrent EPSP from the local circuit. H, Summary of normalized EPSP latency distributions for n = 28 VGAT neurons from N = 14 mice (black), n = 25 VGAT+ neurons from N = 15 mice with polysynaptic EPSPs (magenta), and n = 21 VGAT+ neurons from N = 14 mice without polysynaptic EPSPs (green). Shading represents ± SEM. *p < 0.05.
Figure 9.
Figure 9.
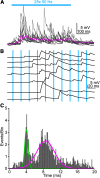
Additional examples of polysynaptic EPSPs in a VGAT+ neuron. A, Example single trials (gray) and average (magenta) of synaptic barrages during 50 Hz corticofugal stimulation in a VGAT+ neuron. Blue bar represents optogenetic stimulation. B, A subset of the single trials from A are expanded to highlight EPSPs evoked during the first 10 light pulses. Blue lines indicate onset of individual light flashes. C, Latency histogram for EPSPs occurring following each light flash in the train. x axis is limited to 0-20 ms, reflecting the duty cycle of a 50 Hz stimulus train. Of note, the latency histogram shows two distinct peaks, suggesting that EPSPs arise from both monosynaptic and polysynaptic inputs. Green and magenta curves indicate fits from a two-term Gaussian model.
Figure 10.
Figure 10.
Differential block of “corticofugal” excitation in VGAT and VGAT+ neurons by 50 nm NBQX. A, B, Example average train EPSPs from a shell IC VGAT (A) or VGAT+ (B) neuron before (black and magenta) and after (gray) bath application of 50 nm NBQX. Bottom traces, Cumulative integral of the EPSP waveform. C, Summary data showing the fraction remaining in 50 nm NBQX for the cumulative integral of the EPSP waveform. Black and gray symbols represent individual experiments and mean ± SEM, respectively. ***p < 0.0001.
Figure 11.
Figure 11.
Corticofugal activity generates polysynaptic inhibition in the dorsal IC. A, Left, A dorsomedial IC neuron voltage-clamped at 8 mV in control conditions. Of note are the spontaneous IPSCs often occurring in bursts, suggesting that they are mediated by action potentials in local GABA neurons. Arrow indicates one such IPSC burst shown at a faster time base in the inset. Right, Bath application of the GABAA receptor antagonist SR95531 (10 μm) blocks the majority of spontaneous IPSCs. Although quite rare, a few events nevertheless remained in the presence of SR95531 (arrow and inset; median IPSC rate in SR95531: one event per 17.95 s). B, Summary data for n = 7 neurons showing that SR95531 profoundly reduces spontaneous IPSC rates. Thus, inhibitory transmission in dorsal IC neurons is mostly GABAergic. C, Example recording from a dorsal IC neuron before and after bath application of glutamate receptor blockers. Gray traces represent overlays of individual trials. Black represents average. Of note is that the powerful increase in IPSC rate during corticofugal stimulation (blue bar) is abolished by blocking glutamate receptors. D, Normalized IPSC rate is binned every 100 ms for statistical comparisons. Asterisks indicate significance in Sidak's post hoc tests comparing event rates across control and drug bins. Of note is that significance is limited to time points during optical stimulation of corticofugal axons. E, Average traces showing temporal integration of corticofugal EPSPs in current-clamp before (black) and after (magenta) bath application of the GABAA receptor antagonist SR95531. Shading represents ± SEM. F, Summary data. Values are the ratio of voltage integrals in drug and control conditions. *p < 0.05. ***p < 0.001.

Similar articles

Cited by

References

    1. Acsády L, Kamondi A, Sík A, Freund T, Buzsáki G (1998) GABAergic cells are the major postsynaptic targets of mossy fibers in the rat hippocampus. J Neurosci 18:3386–3403. 10.1523/JNEUROSCI.18-09-03386.1998 - DOI - PMC - PubMed
    1. Ankri N, Legendre P, Faber DS, Korn H (1994) Automatic detection of spontaneous synaptic responses in central neurons. J Neurosci Methods 52:87–100. 10.1016/0165-0270(94)90060-4 - DOI - PubMed
    1. Asilador A, Llano DA (2020) Top-down inference in the auditory system: potential roles for corticofugal projections. Front Neural Circuits 14:615259. 10.3389/fncir.2020.615259 - DOI - PMC - PubMed
    1. Barzelay O, David S, Delgutte B (2023) Effect of reverberation on neural responses to natural speech in rabbit auditory midbrain: no evidence for a neural dereverberation mechanism. eNeuro 10:ENEURO.0447-22.2023. 10.1523/ENEURO.0447-22.2023 - DOI - PMC - PubMed
    1. Beebe NL, Young JW, Mellott JG, Schofield BR (2016) Extracellular molecular markers and soma size of inhibitory neurons: evidence for four subtypes of GABAergic cells in the inferior colliculus. J Neurosci 36:3988–3999. 10.1523/JNEUROSCI.0217-16.2016 - DOI - PMC - PubMed

Publication types

LinkOut - more resources