. 2023 Jul 5;43(27):5092-5113.
doi: 10.1523/JNEUROSCI.2277-22.2023. Epub 2023 Jun 12.

Deletion of Transferrin Receptor 1 in Parvalbumin Interneurons Induces a Hereditary Spastic Paraplegia-Like Phenotype

Affiliations

Deletion of Transferrin Receptor 1 in Parvalbumin Interneurons Induces a Hereditary Spastic Paraplegia-Like Phenotype

Wenchao Xiong et al. J Neurosci. .

Abstract

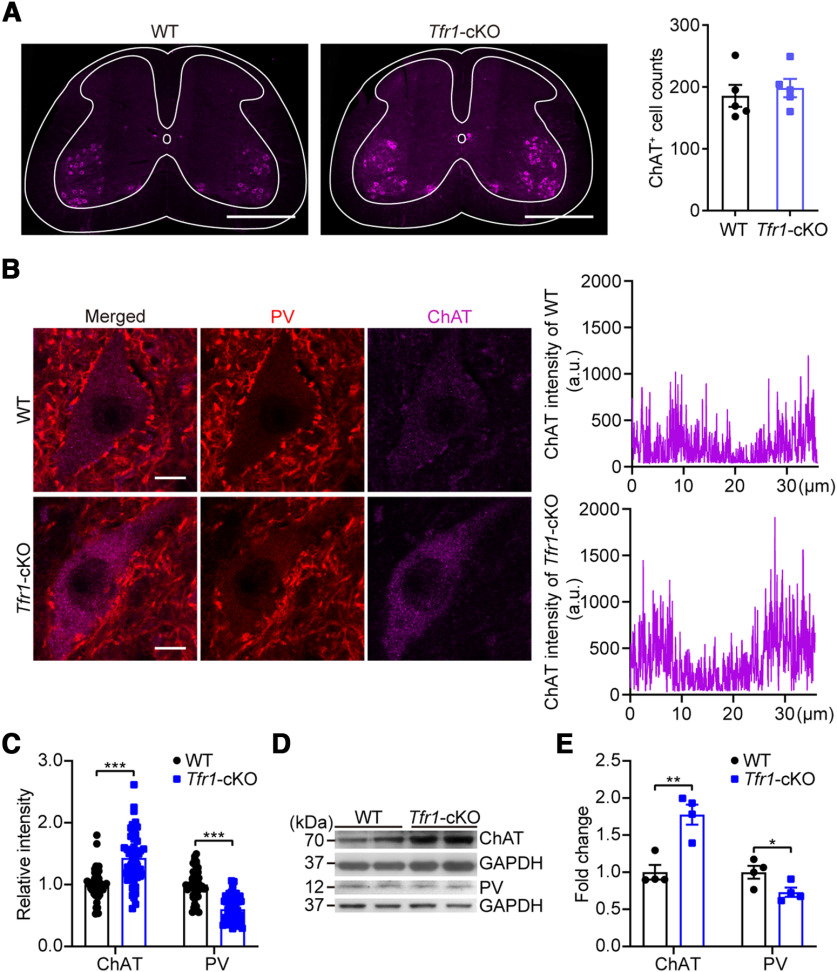
Hereditary spastic paraplegia (HSP) is a severe neurodegenerative movement disorder, the underlying pathophysiology of which remains poorly understood. Mounting evidence has suggested that iron homeostasis dysregulation can lead to motor function impairment. However, whether deficits in iron homeostasis are involved in the pathophysiology of HSP remains unknown. To address this knowledge gap, we focused on parvalbumin-positive (PV+) interneurons, a large category of inhibitory neurons in the central nervous system, which play a critical role in motor regulation. The PV+ interneuron-specific deletion of the gene encoding transferrin receptor 1 (TFR1), a key component of the neuronal iron uptake machinery, induced severe progressive motor deficits in both male and female mice. In addition, we observed skeletal muscle atrophy, axon degeneration in the spinal cord dorsal column, and alterations in the expression of HSP-related proteins in male mice with Tfr1 deletion in the PV+ interneurons. These phenotypes were highly consistent with the core clinical features of HSP cases. Furthermore, the effects on motor function induced by Tfr1 ablation in PV+ interneurons were mostly concentrated in the dorsal spinal cord; however, iron repletion partly rescued the motor defects and axon loss seen in both sexes of conditional Tfr1 mutant mice. Our study describes a new mouse model for mechanistic and therapeutic studies relating to HSP and provides novel insights into iron metabolism in spinal cord PV+ interneurons and its role in the regulation of motor functions.SIGNIFICANCE STATEMENT Iron is crucial for neuronal functioning. Mounting evidence suggests that iron homeostasis dysregulation can induce motor function deficits. Transferrin receptor 1 (TFR1) is thought to be the key component in neuronal iron uptake. We found that deletion of Tfr1 in parvalbumin-positive (PV+) interneurons in mice induced severe progressive motor deficits, skeletal muscle atrophy, axon degeneration in the spinal cord dorsal column, and alterations in the expression of hereditary spastic paraplegia (HSP)-related proteins. These phenotypes were highly consistent with the core clinical features of HSP cases and partly rescued by iron repletion. This study describes a new mouse model for the study of HSP and provides novel insights into iron metabolism in spinal cord PV+ interneurons.

Keywords: axon degeneration; hereditary spastic paraplegia; motor; parvalbumin; spinal cord; transferrin receptor 1.


Figures

Figure 1.
Figure 1.
tdTomato-positive cells of PV-tdTomato mice reacted to PV antibody. A, Immunostaining for PV (green) in the cortex, spinal cord, and quadriceps femoris muscles (Quad) of PV-tdTomato mice. B, Quantification of tdTomato and PV expression. n = 4 mice per group. Scale bar: 50 μm. Data are expressed as means ± SEM.
Figure 2.
Figure 2.
Generation of Tfr1-cKO mice. A, Breeding strategy for Tfr1-cKO mice. B, Western blot analysis of TFR1 in gastrocnemius muscle of Tfr1-cKO and WT male mice. n = 6–7 mice per group. C, PV (red) and TFR1 (green) immunofluorescence staining in the cortex of Tfr1-cKO and WT male mice. n = 100 PV+ neurons from four mice per group. D, Immunostaining for PV (red) and TFR1 (green) in the spinal cord. n = 100 PV+ neurons from four mice per group. Scale bar: 50 μm. Data are expressed as means ± SEM; ***p < 0.001.
Figure 3.
Figure 3.
Tfr1-cKO mice showed severe, progressive motor abnormalities. A, Representative image of WT and Tfr1-cKO male mice at P80. B, The body weight of male and female mice. n = 8–12 mice per group. C, Representative, single movie frame of a WT female mouse descending the pole in the pole test. D, Age-dependent measurement of latency to descend in the pole test for Tfr1-cKO mice, heterozygous (Het) mice, and WT control littermates. n = 11–15 mice per group. E, Representative single movie frames of 80-d-old WT and Tfr1-cKO male mice walking on a beam following the removal of the toe of the hindlimb. The FBA is indicated by yellow lines. F, The FBA decreased over time in Tfr1-cKO mice compared with that in their WT littermates. n = 11–12 mice per group. G, The latency to fall off an accelerating rotarod decreased over time in Tfr1-cKO mice when compared with that in WT mice. n = 11–12 mice per group. H, Gait score in Tfr1-cKO versus WT mice from P40 to P80. n = 12–15 mice per group. I, Sixty-day-old mice lifted by the tail showed normal spreading of the lower limbs (WT mice) or limb-spasm behavior (Tfr1-cKO mice). J, Limb clasping in Tfr1-cKO versus WT mice from P40 to P80. n = 12–16 mice per group. K, Percentage of correct alternation for Tfr1-cKO and WT mice at P40 in the Y-maze test. n = 12 mice per group. L, Acoustic startle response of 40-d-old mice subjected to increased noise levels in decibels (dB). n = 8–15 mice per group. ♂: males, ♀: females. Data are expressed as means ± SEM; **p < 0.01, ***p < 0.001, male Tfr1-cKO mice versus WT mice; ##p < 0.01, ###p < 0.001, female Tfr1-cKO mice versus WT mice.
Figure 4.
Figure 4.
Skeletal muscle atrophy was observed in Tfr1-cKO mice. A, Comparison of the morphology and wet weight of skeletal muscle between WT and Tfr1-cKO male mice at P40 and P80. Gas: gastrocnemius muscle; Sol: soleus muscle; TA: tibialis anterior muscle; EDL: extensor digitorum longus muscle; Quad: quadriceps femoris muscle. P40: n = 4 mice per group; P80: n = 8 mice per group. B, H&E staining of transectioned quadriceps muscle fibers showed that the fiber area and the diameter of the cells in the quadricep muscles were smaller in Tfr1-cKO male mice than in their WT littermates at P80. n = 4 mice per group. C, Top, Serially sectioned soleus muscles were immunostained with Syn/NF (green) to identify muscle spindles. S-191/201/211/221: section 191/201/211/221. Bottom, Total number and density of muscle spindles in Tfr1-cKO male mice and their WT littermates at P80. n = 4 mice per group. D, An intact neuromuscular junction in the gastrocnemius muscle stained with α-BTX (magenta) and Syn/NF (green). Scale bar: 50 μm (B); 200 μm (C, top left); 20 μm (C, top right, D). Data are expressed as means ± SEM; *p < 0.05, **p < 0.01, ***p < 0.001.
Figure 5.
Figure 5.
No structural deformity was observed in the spine or hindlimbs of Tfr1-cKO mice. A, Bone morphology of the spine in a male Tfr1-cKO mouse and a control littermate at P80. B, Radiologic images showing the bone structure of the hindlimb of a male Tfr1-cKO mouse and a control littermate at P80. Scale bar: 5 mm.
Figure 6.
Figure 6.
Skeletal muscle Tfr1 knock-down had no effect on motor behaviors. A, Schematic representation of the viral injection into PV-Cre male mice. B, Schematic representation of the experimental design. C, D, Western blot analysis of TFR1 in skeletal muscle. n = 5 mice per group. E, No significant difference in time to descend the pole. n = 9 mice per group. F, Spontaneous locomotor activity of PV-Cre male mice with skeletal muscle infusions of Tfr1-shRNA or NC-shRNA. n = 9 mice per group. Data are expressed as means ± SEM; *p < 0.05.
Figure 7.
Figure 7.
Tfr1 deficiency in PV+ neurons had no effect on brain and spinal cord architecture. A, Gross appearances of the brain and spinal cord from WT and Tfr1-cKO male mice at P80. B, Wet weight of the brain and spinal cord of WT and Tfr1-cKO male mice at P80. n = 8 mice per group. C, Representative images of coronal brain sections stained with H&E. Right, Thickness of the corpus callosum in comparable brain sections. D, Thickness of the corpus callosum in the brain of WT and Tfr1-cKO male mice at P80. n = 4 mice per group. E, F, H&E staining showed no obvious gross anatomic changes in the brain and spinal cord of WT and Tfr1-cKO male mice at P80. Scale bar: 2 mm (C, E); 500 μm (F). Data are expressed as means ± SEM.
Figure 8.
Figure 8.
Changes in PV+ interneurons in several brain regions of Tfr1-cKO mice. A, Representative images for anti-PV immunostaining and quantification of the number of PV+ neurons in different layers of the MC from WT and Tfr1-cKO male mice at P80. n = 6 mice per group. B, Decreased number of PV+ neurons in the RT of Tfr1-cKO male mice compared with WT at P80. n = 6 mice per group. C, The number of PV+ neurons in PV-enriched and motor-related brain areas. SC: somatosensory cortex. AuC: auditory cortex. VC: visual cortex. Stri: striatum. GP: globus pallidus. SN: substantia nigra. dHip: dorsal hippocampus. vHip: ventral hippocampus. n = 6 mice per group. D, The density of PV+ neurons in the cerebellum lobule of Tfr1-cKO and WT male mice. n = 4 mice per group. Scale bar: 100 μm. Data are expressed as means ± SEM; *p < 0.05, **p < 0.01.
Figure 9.
Figure 9.
The number of TH+ neurons in the SN of Tfr1-cKO and WT male mice at P80. Scale bar: 100 μm. n = 3 mice per group. Data are expressed as means ± SEM.
Figure 10.
Figure 10.
Tfr1 knock-down in brain regions had little effect on motor behaviors. A, Top, Injection sites in the bilateral MC, RT, and SN. Bottom, Confocal images of the brain of adult PV-Cre male mice after viral injection. B, No significant differences were observed in the pole test. n = 5–9 mice per group. C, Spontaneous locomotor activity of PV-Cre male mice with brain infusions of Tfr1-shRNA or NC-shRNA. n = 5–9 mice per group. Scale bar: 100 μm. Data are expressed as means ± SEM.
Figure 11.
Figure 11.
Tfr1 deletion in PV+ interneurons resulted in axon degeneration. A, Cross-sections of the lumbar spinal cord derived from adult PV-tdTomato male mice were stained with an anti-PV antibody (green). B, The number of PV+ spinal cord neurons from 80-d-old WT and Tfr1-cKO male mice. n = 5 mice per group. C, PV immunostaining in spinal cord sections from WT and Tfr1-cKO male mice at P40. D, Representative coronal section immunolabeled with antibodies against SMI-312 (red) and PV (green) in the spinal cord dorsal column of a male WT mouse at P40. E, Curves showing the fluorescence intensity of SMI-312 and PV marked by a white line with an arrow in D. F, Dystrophic axons in the spinal cord of Tfr1-cKO male mice at P40, as shown by SMI-312 (red) and PV (green) staining. G, Quantification of the relative fluorescence intensity of SMI-312 in the dorsal column. n = 22–30 slices from three mice per group. H, Quantification of the PV fluorescence intensity in the dorsal column. n = 22–30 slices from three mice per group. I, Significantly decreased number of axons labeled with SMI-312 in the dorsal column of Tfr1-cKO female mice compared with WT. n = 28–36 slices from three mice per group. J, Representative image showing irregular axons (marked by a white arrow) in the dorsal column of Tfr1-cKO female mice. Red: SMI-312. K, Percentage of irregular axons labeled with SMI-312 in the dorsal column of Tfr1-cKO female mice compared with WT. n = 28–36 slices from three mice per group. L, Example of an entire PV+Tuj1+ neuron derived from cultured DRG neurons reconstructed using Imaris software. M, N, Sholl analysis of Tfr1-cKO female mice versus their littermate controls in basal dendrites of cultured DRG PV+ neurons. n = 26–27 neurons from three mice per group. Scale bar: 100 μm (A, L); 500 μm (C); 50 μm (D, F, J). Data are expressed as means ± SEM; ***p < 0.001.
Figure 12.
Figure 12.
The expression of ChAT and PV in the ventral spinal cord of Tfr1-cKO mice and WT mice. A, ChAT+ neuron counts in the ventral spinal cord of Tfr1-cKO male mice compared with WT at P40. n = 5 mice per group. B, Increased intensity of ChAT (magenta) surrounded by PV (red) terminals in the ventral spinal cord of Tfr1-cKO male mice compared with WT at P40. C, Quantification of ChAT intensities and PV intensities around ChAT+ neurons in the ventral spinal cord of Tfr1-cKO and WT male mice at P40. n = 50 neurons from five mice per group. D, E, Western blot analysis showed increased protein levels of ChAT and decreased protein levels of PV in the ventral spinal cord of Tfr1-cKO male mice compared with WT at P40. n = 4 mice per group. Scale bar: 500 μm (A); 10 μm (B). Data are expressed as means ± SEM; **p < 0.01, ***p < 0.001.
Figure 13.
Figure 13.
Tfr1 knock-down in the PV+ interneurons of ventral spinal cord had little effect on motor function. A, Schematic representation of the injection site in the ventral spinal cord stained with Evans blue. B, Injection sites in the ventral spinal cord of PV-tdTomato male mice with an image of EGFP expression one month after viral injection. C, Time to descend the pole in the pole test one month after viral injection. n = 6 mice per group. Scale bar: 100 μm. Data are expressed as means ± SEM.
Figure 14.
Figure 14.
Tfr1 knock-down in the PV+ interneurons of dorsal spinal cord-induced motor deficits. A, Experimental paradigm of the behavioral tests performed after the bilateral injection of Tfr1-shRNA into the dorsal spinal cord. B, Schematic representation of the injection site in the dorsal spinal cord stained with Evans blue. C, Validation of AAV-DIO-EGFP-Tfr1-shRNA (Tfr1-shRNA) expression in the lumbar dorsal horn. D, In the pole test, the latency to descend increased with time after Tfr1-shRNA injection. n = 7–10 mice per group. E, The FBA was lower in mice injected with Tfr1-shRNA than in mice injected with NC-shRNA. n = 14–17 mice per group. F, The latency to fall in the rotarod test. n = 14–17 mice per group. Scale bar: 100 μm. Data are expressed as means ± SEM; *p < 0.05, **p < 0.01, ***p < 0.001.
Figure 15.
Figure 15.
The expression of HSP-related proteins was altered in the dorsal spinal cord of Tfr1-cKO mice. A, Heatmap of the differentially expressed proteins between Tfr1-cKO male mice and their control littermates. Proteins shown in red are related to motor disorders. B, Volcano plot depicting the differentially expressed proteins in Tfr1-cKO mice. Red dots represent significantly upregulated proteins in Tfr1-cKO mice and blue dots represent significantly downregulated proteins. C, PRM results for HSP-related proteins in the spinal cord of Tfr1-cKO male mice compared with their WT littermates. WT, red dashed line. n = 3 mice per group. Data are expressed as means ± SEM; *p < 0.05, **p < 0.01, ***p < 0.001.
Figure 16.
Figure 16.
Fe(NH4)2(SO4)2 application induced axon degeneration in PV+ neurons. A, Representative images of tdTomato+ and tdTomato neurons co-stained with Tuj1 (green) 24 h after Fe(NH4)2(SO4)2 (75 mm) treatment and traces of dendritic arbors generated using Imaris software. B, Western blotting showing that the expression of TFR1 was lower in primary cultured DRG neurons treated with Fe(NH4)2(SO4)2 than in those treated with vehicle. C, D, Sholl analysis of PV-tdTomato+ neurons treated with Fe(NH4)2(SO4)2 or vehicle. n = 24–28 neurons per group. E, F, Sholl analysis of PV-tdTomato neurons treated or not with Fe(NH4)2(SO4)2 or vehicle. n = 20 neurons per group. G, Changes in the expression levels of HSP-related proteins following Fe(NH4)2(SO4)2 treatment as determined by PRM. Vehicle, red dashed line. n = 3 mice per group. The gray shaded area in G indicates proteins with the same change in expression as that shown in Figure 15C. Scale bar: 100 μm. Data are expressed as means ± SEM; *p < 0.05, **p < 0.01, ***p < 0.001.
Figure 17.
Figure 17.
Disruption of iron homeostasis in the dorsal spinal cord of Tfr1-cKO mice. A, Serum iron. n = 10 mice per group. B, Iron concentrations in the dorsal spinal cord of Tfr1-cKO and WT male mice at P40. n = 8–12 mice per group. C, Relative mRNA levels of proteins involved in cellular iron metabolism in the dorsal spinal cord of Tfr1-cKO and WT male mice at P40. n = 5–6 mice per group. Data are expressed as means ± SEM; *p < 0.05, **p < 0.01.
Figure 18.
Figure 18.
Infusion of DFP induced motor deficits in adult C57BL/6J male mice. A, Top, Experimental paradigm for the behavioral tests performed after DFP infusion. Bottom, A representative image showing osmotic pump implantation into the right lateral ventricle. B, The latency to descend in the pole test increased with time post-DFP infusion compared with control animals. n = 7–9 mice per group. C, The FBA was lower in DFP-treated mice than in ACSF-treated mice. n = 7–9 mice per group. D, The latency to fall in the rotarod test decreased after DFP infusion. n = 14–15 mice per group. E, F, Comparison of the morphology and wet weight of skeletal muscle between DFP-infused and ACSF-infused mice. n = 6–7 mice per group. GI, H&E staining of transectioned quadriceps muscle fibers showed no difference in fiber area or cell diameter between the two groups. n = 4 mice per group. J, Axons in the spinal cords of DFP-infused mice and control mice immunostained for SMI-312 (red) and PV (green). K, Quantification of SMI-312 fluorescence intensity in the dorsal column. n = 54–58 slices from four mice per group. L, Quantification of PV fluorescence intensity in the dorsal column. n = 54–58 slices from four mice per group. Scale bar: 1 mm (A); 50 μm (G, J). Data are expressed as means ± SEM; *p < 0.05, **p < 0.01, ***p < 0.001.
Figure 19.
Figure 19.
Iron dextran partly rescued motor deficits and axon loss in Tfr1-cKO mice. A, Experimental paradigm for the behavioral tests performed after iron dextran treatment. B, Latency to descend in the pole test after iron dextran treatment in male and female Tfr1-cKO mice. n = 8–19 mice per group; male: 5–10 mice per group; female: 3–9 mice per group. C, The FBA in the beam test after iron dextran treatment. n = 8–19 mice per group; male: 5–10 mice per group; female: 3–9 mice per group. D, Latency to fall in the rotarod test after iron dextran treatment. n = 8–19 mice per group; male: 5–10 mice per group; female: 3–9 mice per group. E, Representative images of SMI-312 (red) and PV (green)-stained axons in the dorsal column of the spinal cord. F, Quantification of SMI-312 fluorescence intensity in the dorsal column. n = 41–49 slices from four male mice per group. G, Quantification of PV fluorescence intensity in the dorsal column. n = 41–49 slices from four male mice per group. Scale bar: 50 μm. Data are expressed as means ± SEM; *p < 0.05, **p < 0.01, ***p < 0.001.

Similar articles

Cited by

References

    1. Antal M, Freund TF, Polgár E (1990) Calcium-binding proteins, parvalbumin- and calbindin-D 28k-immunoreactive neurons in the rat spinal cord and dorsal root ganglia: a light and electron microscopic study. J Comp Neurol 295:467–484. 10.1002/cne.902950310 - DOI - PubMed
    1. Barrientos T, Laothamatas I, Koves TR, Soderblom EJ, Bryan M, Moseley MA, Muoio DM, Andrews NC (2015) Metabolic catastrophe in mice lacking transferrin receptor in muscle. EBioMedicine 2:1705–1717. 10.1016/j.ebiom.2015.09.041 - DOI - PMC - PubMed
    1. Bastian TW, Prohaska JR, Georgieff MK, Anderson GW (2014) Fetal and neonatal iron deficiency exacerbates mild thyroid hormone insufficiency effects on male thyroid hormone levels and brain thyroid hormone-responsive gene expression. Endocrinology 155:1157–1167. 10.1210/en.2013-1571 - DOI - PMC - PubMed
    1. Betley JN, Wright CVE, Kawaguchi Y, Erdélyi F, Szabó G, Jessell TM, Kaltschmidt JA (2009) Stringent specificity in the construction of a GABAergic presynaptic inhibitory circuit. Cell 139:161–174. 10.1016/j.cell.2009.08.027 - DOI - PMC - PubMed
    1. Blackstone C (2012) Cellular pathways of hereditary spastic paraplegia. Annu Rev Neurosci 35:25–47. 10.1146/annurev-neuro-062111-150400 - DOI - PMC - PubMed

Publication types

LinkOut - more resources