. 2023 Oct;36(10):e4984.
doi: 10.1002/nbm.4984. Epub 2023 Jun 12.

Concurrent measurement of perfusion parameters related to small blood vessels and cerebrospinal fluid circulation in the human brain using dynamic dual-spin-echo perfusion MRI

Affiliations

Concurrent measurement of perfusion parameters related to small blood vessels and cerebrospinal fluid circulation in the human brain using dynamic dual-spin-echo perfusion MRI

Di Cao et al. NMR Biomed. 2023 Oct.

Abstract

Accumulating evidence from recent studies has indicated the importance of studying the interaction between the microvascular and lymphatic systems in the brain. To date, most imaging methods can only measure blood or lymphatic vessels separately, such as dynamic susceptibility contrast (DSC) MRI for blood vessels and DSC MRI-in-the-cerebrospinal fluid (CSF) (cDSC MRI) for lymphatic vessels. An approach that can measure both blood and lymphatic vessels in a single scan offers advantages such as a halved scan time and contrast dosage. This study attempts to develop one such approach by optimizing a dual-echo turbo-spin-echo sequence, termed "dynamic dual-spin-echo perfusion (DDSEP) MRI". Bloch simulations were performed to optimize the dual-echo sequence for the measurement of gadolinium (Gd)-induced blood and CSF signal changes using a short and a long echo time, respectively. The proposed method furnishes a T1-dominant contrast in CSF and a T2-dominant contrast in blood. MRI experiments were performed in healthy subjects to evaluate the dual-echo approach by comparing it with existing separate methods. Based on simulations, the short and long echo time were chosen around the time when blood signals show maximum difference between post- and pre-Gd scans, and the time when blood signals are completely suppressed, respectively. The proposed method showed consistent results in human brains as previous studies using separate methods. Signal changes from small blood vessels occurred faster than from lymphatic vessels after intravenous Gd injection. In conclusion, Gd-induced signal changes in blood and CSF can be detected simultaneously in healthy subjects with the proposed sequence. The temporal difference in Gd-induced signal changes from small blood and lymphatic vessels after intravenous Gd injection was confirmed using the proposed approach in the same human subjects. Results from this proof-of-concept study will be used to further optimize DDSEP MRI in subsequent studies.

Keywords: DCE; DSC; ISF; contrast; gadolinium; lymphatic.


Figures

Figure 1.
Figure 1.
Pulse sequences and simulation results for the proposed dual-echo TSE sequence (a, b), and the long-TE TSE sequence developed in the previous cDSC MRI study (c,d). MR signals in blood and CSF with and without Gd are simulated in (a, c) and the contrast between pre- and post-Gd signals in blood and CSF are shown in (b, d). The fractional MR signals (Mz/M0) and the fractional MR signal changes before and after Gd injection (ΔMz/M0=(Mz_post_Gd-Mz_pre_Gd)/M0) are displayed as functions of TE. The vertical dashed lines indicate the TEs in respective sequences. Simulations of the signal contrast with and without Gd (ΔMz/M0=(Mz_post_Gd-Mz_pre_Gd)/M0) in (e) blood and (f) CSF as a function of Gd Concentration ([Gd]) are demonstrated. The imaging parameters adopted in the human experiments are used for this simulation (see Methods). In the proposed dual-echo TSE sequence, signal contrasts at the two acquired TEs (TE1 = 80 ms, TE2 = 560 ms) and the theoretical TE = 0 (which can be numerically fit from TE1 and TE2) are calculated. Signal contrasts in the long-TE TSE in cDSC MRI (TE = 1350 ms) are also simulated. A more detailed pulse sequence diagram for the proposed dual-echo TSE sequence is provided in the Supporting Information.
Figure 2.
Figure 2.
Representative results for the measurement of blood perfusion from human scans using the short-TE DDSEP images (a-d) and the standard GRE EPI DSC MRI sequence (e-h) on 3T are shown. The raw MR images from the short TE (TE1 = 80 ms) in the proposed dual-echo TSE sequence and from the standard GRE EPI DSC sequence are displayed in (a) and (e), respectively. The derived maps of CBV, CBF, and MTT from each sequence are demonstrated subsequently. Note that the DSC CBV and CBF values are not absolute measures and thus are in arbitrary unit (a.u.). The color bars indicate the corresponding scales of each parameter. Notice that the images for DDSEP and DCS MRI were from two different subjects, and the spatial resolution in the dual-echo TSE sequence (1x1x2 mm3) was higher (about 1/20 in voxel size) than the standard GRE EPI DSC sequence (2.8x2.8x5 mm3). The approximately same slice location is shown in the figure.
Figure 3.
Figure 3.
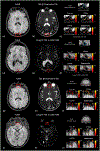
Representative results for the measurement of dynamic signal changes in the CSF from human scans on 3T are shown. (a-f) The region-of-interest (ROI, red boxes) around the dural sinuses (DS) (especially the superior sagittal sinus) that contains the meningeal lymphatic vessels is manually drawn. (a) The FLAIR image is shown to confirm the location of the meningeal lymphatic vessels. The relative signal changes (ΔS/S) detected with the FLAIR sequence in the ROI are overlaid on the image. (b) The raw image acquired at the long TE (TE2 = 560 ms) in the proposed dual-echo TSE sequence is shown with ΔS/S overlaid on the image. Only voxels with a contrast-to-noise ratio (CNR) > 1 were highlighted in the image (see Data analysis). (c) A magnified view (axial) of the FLAIR image in the ROI, and maps of the following parameters extracted from the dynamic time courses detected in the dual-echo TSE sequence overlaid on the FLAIR image are shown: Tonset = time of onset, TTP = time to peak, absolute value of relative signal change ∣ΔS/S∣ between pre- and post-Gd, [Gd] = peak Gd concentration. The blue contour on the magnified FLAIR image outlines approximately the location of the superior sagittal sinus, around which the meningeal lymphatic vessels are located in previous studies. The color bars indicate the corresponding scales of each parameter. For comparison, results from the previous cDSC MRI sequence: the FLAIR image, raw cDSC image, and the corresponding parametric maps are shown in (d), (e), and (f), respectively. The slice location was chosen to cover the same ROI (red boxes) around the dural sinuses (DS) (especially the superior sagittal sinus) that contains the meningeal lymphatic vessels. (g-l) Similar results were shown for the ROI (red boxes) around the cribriform plate (CP) that contains the olfactory lymphatic vessels. A coronal view of the FLAIR image is shown in (i) to indicate the location of the axial slice. For comparison, results from the previous cDSC MRI sequence: FLAIR image, raw cDSC image, and the corresponding parametric maps are shown in (j), (k), and (l), respectively. The slice location was chosen to cover the same ROI (red boxes) around the cribriform plate (CP) that contains the olfactory lymphatic vessels. Note that the images in (a-c), (d-f), (g-i), and (j-l) are from four different subjects.
Figure 4.
Figure 4.
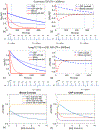
Time courses detected in blood and CSF before and after Gd injection averaged over all subjects (n = 8) are shown. The relative signal changes (ΔS/S) between pre- and post-Gd images are shown as a function of time. The error bars indicate standard deviations. The vertical dotted lines indicate the time when Gd is injected, from which all the time courses were aligned. (a) The average time courses from the blood vessels in grey matter tissue detected using the proposed sequence at short TE (TE1 = 80 ms) and the standard GRE EPI DSC MRI sequence are shown. Time courses from each subject were examined, and as the inter-subject variances in Tonset and TTP (Table 1) were smaller than the temporal resolution in our measurement, no further temporal alignment was performed before group averaging. (b) The same time courses as in (a) normalized by their corresponding peaks (the largest signal change) are shown in order to compare their temporal difference. (c) The average time courses in the meningeal lymphatic vessels around the dural sinuses region detected using the proposed sequence at long TE (TE2 = 560 ms) and the previous cDSC MRI sequence are shown. (d) Normalized time courses from (c). (e) The average time courses in the olfactory lymphatic vessels around the cribriform plate detected using the proposed sequence at long TE (TE2 = 560 ms) and the previous cDSC MRI sequence are shown. (f) Normalized time courses from (e). (g) To compare the time courses in the blood and meningeal and olfactory lymphatic vessels detected using the proposed approach, the same time courses as in (a, c, e) are displayed together. The time courses from blood and CSF are displayed in separate panels for better visualization. (h) Normalized time courses from (g). Note that in (c-g, and h), the relative signal changes (ΔS/S) between pre- and post-Gd images from DSC MRI and cDSC MRI were flipped for better visualization and comparison since ΔS/S from these sequences are expected to be negative. (i) To compare the time courses from the CSF measured at both TEs using the proposed approach, the average time courses in the meningeal lymphatic vessels around the dural sinuses region detected using the proposed sequence at short and long TEs, respectively, are shown. Note that the time course at the long TE here is the same as (c) and (g), but the time course at the short TE here was averaged from the CSF signal, which is different from the short-TE time courses averaged from the blood signal shown in (a) and (g). (j) Normalized time courses from (i). (k) The average time courses in the olfactory lymphatic vessels around the cribriform plate detected using the proposed sequence at short and long TEs, respectively, are shown. Note that the time course at the long TE here is the same as (e) and (g), but the time course at the short TE here was averaged from the CSF signal, which is different from the short-TE time courses averaged from the blood signal shown in (a) and (g). (l) Normalized time courses from (k).

Similar articles

Cited by

References

    1. McKnight CD, Rouleau RM, Donahue MJ, Claassen DO. The Regulation of Cerebral Spinal Fluid Flow and Its Relevance to the Glymphatic System. Current neurology and neuroscience reports 2020;20(12):58. - PMC - PubMed
    1. Benveniste H, Liu X, Koundal S, Sanggaard S, Lee H, Wardlaw J. The Glymphatic System and Waste Clearance with Brain Aging: A Review. Gerontology 2019;65(2):106–119. - PMC - PubMed
    1. Aspelund A, Antila S, Proulx ST, Karlsen TV, Karaman S, Detmar M, Wiig H, Alitalo K. A dural lymphatic vascular system that drains brain interstitial fluid and macromolecules. The Journal of experimental medicine 2015;212(7):991–999. - PMC - PubMed
    1. Louveau A, Smirnov I, Keyes TJ, Eccles JD, Rouhani SJ, Peske JD, Derecki NC, Castle D, Mandell JW, Lee KS, Harris TH, Kipnis J. Structural and functional features of central nervous system lymphatic vessels. Nature 2015;523(7560):337–341. - PMC - PubMed
    1. Absinta M, Ha SK, Nair G, Sati P, Luciano NJ, Palisoc M, Louveau A, Zaghloul KA, Pittaluga S, Kipnis J, Reich DS. Human and nonhuman primate meninges harbor lymphatic vessels that can be visualized noninvasively by MRI. eLife 2017;6. - PMC - PubMed

Publication types

LinkOut - more resources