. 2023 Nov;25(7):592-607.
doi: 10.1111/bdi.13355. Epub 2023 Jun 12.

The network structure of mania symptoms differs between people with and without binge eating

Affiliations

The network structure of mania symptoms differs between people with and without binge eating

Helena L Davies et al. Bipolar Disord. 2023 Nov.

Abstract

Objectives: People with bipolar disorder who also report binge eating have increased psychopathology and greater impairment than those without binge eating. Whether this co-occurrence is related to binge eating as a symptom or presents differently across full-syndrome eating disorders with binge eating is unclear.

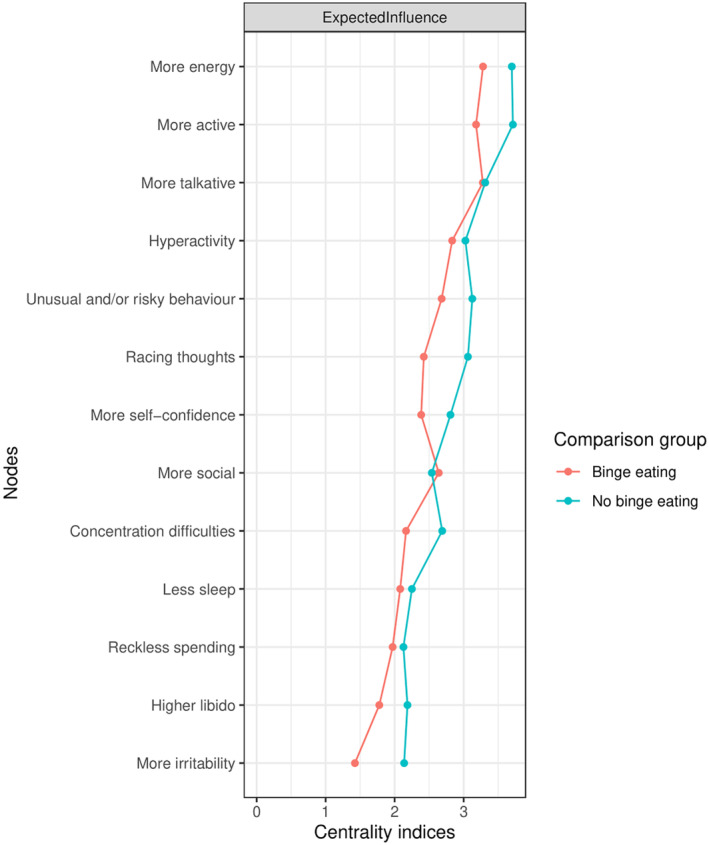
Methods: We first compared networks of 13 lifetime mania symptoms in 34,226 participants from the United Kingdom's National Institute for Health and Care Research BioResource with (n = 12,104) and without (n = 22,122) lifetime binge eating. Second, in the subsample with binge eating, we compared networks of mania symptoms in participants with lifetime anorexia nervosa binge-eating/purging (n = 825), bulimia nervosa (n = 3737), and binge-eating disorder (n = 3648).

Results: People with binge eating endorsed every mania symptom significantly more often than those without binge eating. Within the subsample, people with bulimia nervosa most often had the highest endorsement rate of each mania symptom. We found significant differences in network parameter statistics, including network structure (M = 0.25, p = 0.001) and global strength (S = 1.84, p = 0.002) when comparing the binge eating with no binge-eating participants. However, network structure differences were sensitive to reductions in sample size and the greater density of the latter network was explained by the large proportion of participants (34%) without mania symptoms. The structure of the anorexia nervosa binge-eating/purging network differed from the bulimia nervosa network (M = 0.66, p = 0.001), but the result was unstable.

Conclusions: Our results suggest that the presence and structure of mania symptoms may be more associated with binge eating as a symptom rather than any specific binge-type eating disorder. Further research with larger sample sizes is required to confirm our findings.

Keywords: anorexia nervosa; binge-eating disorder; bipolar disorder; bulimia nervosa; diagnosis; network analysis; signs and symptoms.


Conflict of interest statement

Prof Breen has received honoraria, research or conference grants and consulting fees from Illumina, Otsuka, and COMPASS Pathfinder Ltd. Prof Walters has received grant funding from Takeda for work unrelated to the GLAD Study. The remaining authors have nothing to disclose.

Figures

FIGURE 1
FIGURE 1
Differences in mania symptom endorsement across participants with no lifetime binge eating (n = 22,122) versus participants with lifetime binge eating (n = 12,104) from the National Institute for Health and Care Research BioResource (n = 34,226). Black lines indicate statistically significant differences between the groups. Further detail is in Table S2.
FIGURE 2
FIGURE 2
Mania symptom networks in individuals with [(A) n = 12,104] and without [(B); n = 22,122] lifetime binge eating. Blue edges indicate positive associations and red edges indicate negative associations. The width and saturation of the edge indicate the strength of the relationship, with thicker and more saturated edges representing stronger associations. Networks are plotted by calculating the average layout of the networks, and then constraining each of these networks to that layout. Within each network, the colour of the node indicates its cluster membership as defined by the walktrap algorithm (covariates have been forced into their own category). For all binary nodes, the orange colour around each node indicates the accuracy achieved by the marginal (i.e. unadjusted model); the red colour around each node indicates the additional accuracy achieved by all nodes that are connected to that node. Red + orange denotes the accuracy of the full model (i.e. marginal + additional accuracy). Normalised accuracy is depicted by the ratio of red/(red + white). Normalised accuracy is the accuracy achieved by all nodes it is connected to, beyond the accuracy achieved by the marginal. For the continuous node (i.e. age), the blue bar indicates the explained variance achieved by all nodes it is connected to.
FIGURE 3
FIGURE 3
Centrality plot comparing the standardised expected influence of each symptom node in the groups within the symptom‐level analysis (lifetime binge eating n = 12,104; no lifetime binge eating n = 22,122).
FIGURE 4
FIGURE 4
Differences in mania symptom endorsement across hierarchically categorised eating disorder groups (anorexia binge‐eating/purging n = 825; bulimia nervosa n = 3737; binge‐eating disorder n = 3648), from the National Institute for Health and Care Research BioResource (n = 8210). Black lines indicate statistically significant differences between the groups. Further detail is in Table S5.
FIGURE 5
FIGURE 5
Mania symptom networks in individuals hierarchically categorised into groups of lifetime diagnosis of anorexia nervosa binge‐eating/purging [(A); n = 825], bulimia nervosa [(B); n = 3737], binge‐eating disorder [(C); n = 3648]. Blue edges indicate positive associations and red edges indicate negative associations. The width and saturation of the edge indicate strength of the relationship, with thicker and more saturated edges representing stronger associations. Networks are plotted by calculating the average layout of the networks, and then constraining each of these networks to that layout. Within each network, the colour of the node indicates its cluster membership as defined by the walktrap algorithm (covariates have been forced into their own category). For all binary nodes, the orange colour around each node indicates the accuracy achieved by the marginal (i.e. unadjusted model); the red colour around each node indicates the additional accuracy achieved by all nodes that are connected to that node. Red + orange denotes the accuracy of the full model (i.e. marginal + additional accuracy). Normalised accuracy is depicted by the ratio of red/(red + white). Normalised accuracy is the accuracy achieved by all nodes it is connected to, beyond the accuracy achieved by the marginal. For the continuous node (i.e. age), the blue bar indicates the explained variance by all nodes it is connected to.
FIGURE 6
FIGURE 6
Differences in mania symptom endorsement across binge‐eating groups in a sensitivity analysis (no lifetime binge eating n = 22,122; lifetime overeating n = 926 [i.e. without loss of control]; lifetime binge eating n = 12,104 [i.e. with loss of control]) from the National Institute for Health and Care Research BioResource. Black lines indicate statistically significant differences between the groups.

References

    1. Thiebaut S, Godart N, Radon L, Courtet P, Guillaume S. Crossed prevalence results between subtypes of eating disorder and bipolar disorder: a systematic review of the literature. Encephale. 2019;45:60‐73. - PubMed
    1. McElroy SL, Kotwal R, Keck PE Jr. Comorbidity of eating disorders with bipolar disorder and treatment implications. Bipolar Disord. 2006;8:686‐695. - PubMed
    1. McElroy SL, Crow S, Blom TJ, et al. Clinical features of bipolar spectrum with binge eating behaviour. J Affect Disord. 2016;201:95‐98. - PubMed
    1. American Psychiatric Association . Diagnostic and Statistical Manual of Mental Disorders (DSM‐5®). American Psychiatric Pub; 2013.
    1. Tseng M‐CM, Chang C‐H, Chen K‐Y, Liao S‐C, Chen H‐C. Prevalence and correlates of bipolar disorders in patients with eating disorders. J Affect Disord. 2016;190:599‐606. - PubMed

Publication types