. 2023 Jun 12;9(1):55.
doi: 10.1038/s41421-023-00559-7.

Single-cell landscape of primary central nervous system diffuse large B-cell lymphoma

Affiliations

Single-cell landscape of primary central nervous system diffuse large B-cell lymphoma

Nianping Liu et al. Cell Discov. .

Abstract

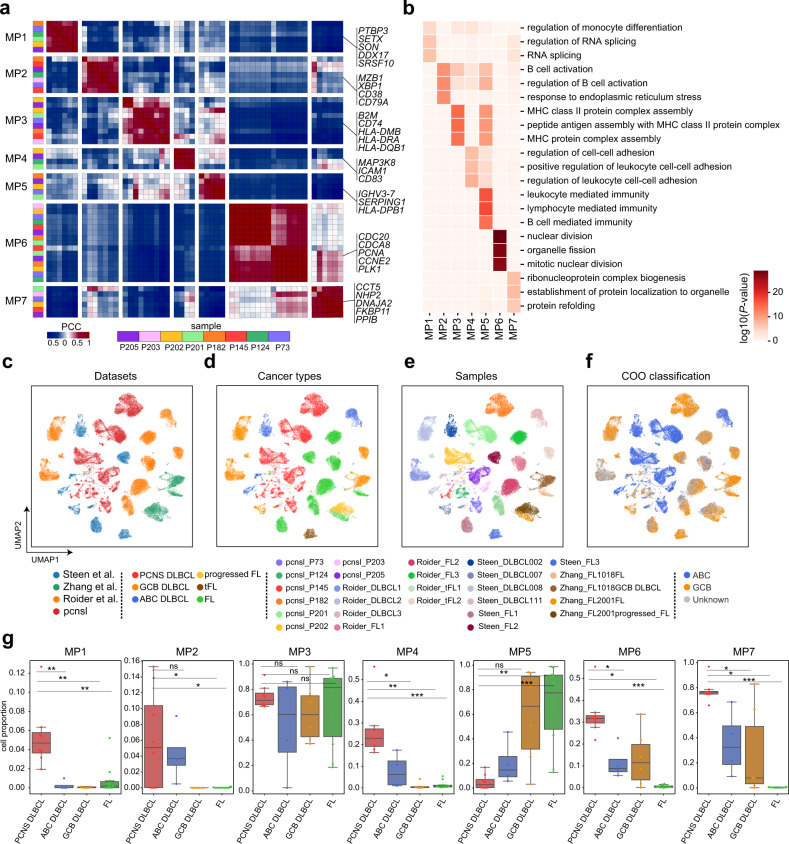
Understanding tumor heterogeneity and immune infiltrates within the tumor-immune microenvironment (TIME) is essential for the innovation of immunotherapies. Here, combining single-cell transcriptomics and chromatin accessibility sequencing, we profile the intratumor heterogeneity of malignant cells and immune properties of the TIME in primary central nervous system diffuse large B-cell lymphoma (PCNS DLBCL) patients. We demonstrate diverse malignant programs related to tumor-promoting pathways, cell cycle and B-cell immune response. By integrating data from independent systemic DLBCL and follicular lymphoma cohorts, we reveal a prosurvival program with aberrantly elevated RNA splicing activity that is uniquely associated with PCNS DLBCL. Moreover, a plasmablast-like program that recurs across PCNS/activated B-cell DLBCL predicts a worse prognosis. In addition, clonally expanded CD8 T cells in PCNS DLBCL undergo a transition from a pre-exhaustion-like state to exhaustion, and exhibit higher exhaustion signature scores than systemic DLBCL. Thus, our study sheds light on potential reasons for the poor prognosis of PCNS DLBCL patients, which will facilitate the development of targeted therapy.


Conflict of interest statement

The authors declare no competing interests.

Figures

Fig. 1
Fig. 1. Characterization of the PCNS DLBCL TIME using scRNA-seq paired with V(D)J profiling and scATAC-seq.
a Schematic of the workflow for tumor section processing and scRNA-seq paired with V(D)J profiling and scATAC-seq. b UMAP of all cells colored by cell clusters (left) from scRNA-seq and immune receptor classification (right) based on scV(D)J data. Dashed circles highlight the major cell types. NK natural killer cells, Oligo oligodendrocytes, gd T gamma-delta T cells, Treg regulatory T cells, CD8 Tex exhausted CD8 T cells, CD8 Tprolif proliferative CD8 T cells, CD8 Tmem-like memory-like CD8 T cells. c UMAP of all cells colored by normalized expression levels of selected marker genes in the scRNA-seq data. Color bars indicate the log-normalized expression values of each gene in single cells. d UMAP of all cells colored by cell clusters from scATAC-seq. Dashed circles highlight the major cell types. e UMAP of all cells colored by gene activity scores of selected marker genes in the scATAC-seq data. Color bars indicate the gene activity scores of each gene in single cells, which were calculated by summing the fragments intersecting with the region of gene body and 2 kb upstream of transcription start site. f Donut plot showing the B-cell state classification (outer circle) and COO classification (inner circle) of malignant B cells in each patient. Arrows indicate that B-cell states from S1 to S5 represent malignancy from more GCB-like to more ABC-like subtypes. In (c) and (e), marker genes included CD3D for T cells, CD8A for CD8 T cells, MS4A1 for B cells, CD163 for myeloid cells, and MOG for oligodendrocytes.
Fig. 2
Fig. 2. Identification of intratumor malignant meta-programs in PCNS DLBCL patients.
a Heatmap depicting pair-wise correlations of intratumor programs derived from PCNS DLBCL patients. Both rows and columns represent programs identified by consensus NMF algorithm sample-wise. Color bar on the left indicates which sample each program belongs to. Color of each block represents the Pearson correlation coefficient (PCC) between two programs. Further hierarchical clustering identified seven coherent expression meta-programs across samples (MP1–7). The representative genes of each meta-program are displayed on the right of the heatmap. b Heatmap of representative biological pathways significantly enriched in the seven meta-programs. UMAP of malignant cells colored by datasets (c), cancer types (d), samples (e), and COO classification (f). FL follicular lymphoma, tFL transformed follicular lymphoma, DLBCL diffuse large B-cell lymphoma. g Boxplot showing the proportion of cells enriched for the meta-programs in each patient. Each dot in the boxplot represents the cell proportion of an individual patient, and patients were classified into different cancer types. A two-sided Wilcoxon rank-sum statistic was used to calculate significance (***P < 0.001, **P < 0.01, *P < 0.05). Box boundaries and middle lines correspond to the interquartile range (IQR) and median, respectively. Whiskers extend to the lowest or highest data points that are no more than 1.5 times the IQR from the box boundaries. In (c), Steen et al., Zhang et al. and Roider et al. represent three publicly available scRNA-seq datasets; “pcnsl” represents PCNS DLBCL dataset in this study.
Fig. 3
Fig. 3. The presence of a PCNS DLBCL-specific phenotype with a tumor-promoting feature.
a Heatmap of CNV profiles for individual cells (rows) from a representative sample (P201), which were inferred based on the average expression of genes surrounding each chromosomal position (columns). Red: chromosome amplifications; Blue: chromosome deletions. b Clonality tree of single cells from sample P201 based on the results of inferCNV. The branches were scaled according to the percentage of cells in the calculated subclone containing the corresponding CNVs. c UMAP of malignant cells from P201 colored by nodes of the clonality tree in (b). A dashed circle highlights the cells in Node I (including leaf nodes: K, L, O, P). d UMAP of malignant cells from P201 colored by the MP1 signature score (left); violin plot showing the MP1 signature score of cells in the nodes of the clonality tree (right). A dashed circle highlights the cells with high MP1 signature scores. e Stacked bar plot showing proportions of spliced and unspliced gene counts in cells of clonality tree nodes. f Venn diagram showing the DEGs of Node I compared with other nodes only using unspliced and spliced gene counts. Representative DEGs are displayed. UMAP of malignant cells from P201 colored by spliced gene counts (left) and unspliced gene counts (right) for genes SRSF10 (g) and BCL2 (h).
Fig. 4
Fig. 4. A plasmablast-like expression program in PCNS DLBCL.
a Schematic of the workflow for joint analysis of scATAC-seq and scRNA-seq data of B cells. We first mapped the PCA embeddings and cluster annotations of the reference dataset (King et al.) to our scRNA-seq data. Then, cluster annotations were transferred from the scRNA-seq data to the scATAC-seq data through canonical correlation analysis. b UMAP of B cells colored by GC B-cell cluster annotations transferred from publicly available reference data. Dashed circles highlight the plasmablast cells. c UMAP of B cells colored by MP2 signature score. Dashed circles highlight the MP2 cells. d Heatmap showing expression levels of selected functional genes in B cells. e Bar plot showing the TFs that were significantly enriched in plasmablast-like malignant cells. TFs marked with asterisks are the master TFs for differentiation of plasmablast cells. f Strip plot showing the RNA expression levels (upper) and corresponding TF motif activity (bottom) in malignant B cells with GC cluster annotations. g The recurrence-free survival (RFS) curve of 20 PCNS DLBCL patients and the progression-free survival (PFS) curve of 229 systemic DLBCL patients based on MP2 signature scores. The P values were calculated by the log-rank test.
Fig. 5
Fig. 5. Characterization of exhausted clonally expanded CD8 T cells and bystander CD8 T cells in the TIME.
UMAP of CD8 T cells colored by CD8 T clusters (a) and clonal expansion of TCR clones (b) in the scRNA-seq data. CD8 Tprolif proliferative CD8 T cells, CD8 Tex exhausted CD8 T cells (including exhausted CD8 T-1–6), CD8 Tmem-like memory-like CD8 T cells. c Quantification of TCR overlap (Morisita index) between each pair of CD8 T clusters in each patient. Each dot represents a patient. P values were calculated by a two-sided Wilcoxon rank-sum test. d Heatmap of selected T-cell functional markers for CD8 T-cell clusters. e UMAP of CD8 T cells colored by expression levels of gene ENTPD1 (CD39). f Genome tracking plot showing aggregated genomic peaks of ENTPD1(CD39) in the scATAC-seq data. g Boxplot showing the exhaustion scores of CD8 T cells in different B-cell lymphoma categories. The Kruskal–Wallis test followed by a post hoc test of Fisher’s least significant difference (LSD) was performed to evaluate the significance. Compact letter displays were used to show the significance of the pair-wise comparisons, in which any two groups not sharing any letters were significantly different in exhaustion score. Reactive Lymph Reactive Lymphadenitis. h UMAP of tumor-reactive CD8 T cells colored by exhaustion stages identified by trajectory analysis of the scRNA-seq data. i is the same as (h), but using the scATAC-seq data. j Boxplot showing the exhaustion scores of tumor-reactive CD8 T cells in the different exhaustion stages. k is the same as (j), but using the scATAC-seq data. In (j), (k), P values were calculated by a two-sided Wilcoxon rank-sum test. l Heatmap showing expression levels of TCF7 and PDCD1 in tumor-reactive CD8 T cells in different exhaustion stages. m is the same as (l), but using the scATAC-seq data. Heatmap showing the gene expression (n) and motif activity (o) dynamics along the pseudotime trajectory. In (g), (j), and (k), box boundaries and middle lines correspond to the IQR and median, respectively. Whiskers extend to the lowest or highest data points that are no more than 1.5 times the IQR from the box boundaries.

References

    1. Gerstner ER, Batchelor TT. Primary central nervous system lymphoma. Arch. Neurol. 2010;67:291–297. doi: 10.1001/archneurol.2010.3. - DOI - PubMed
    1. Ferreri AJ, et al. Chemoimmunotherapy with methotrexate, cytarabine, thiotepa, and rituximab (MATRix regimen) in patients with primary CNS lymphoma: results of the first randomisation of the International Extranodal Lymphoma Study Group-32 (IELSG32) phase 2 trial. Lancet Haematol. 2016;3:e217–e227. doi: 10.1016/S2352-3026(16)00036-3. - DOI - PubMed
    1. Ferreri AJM, et al. Whole-brain radiotherapy or autologous stem-cell transplantation as consolidation strategies after high-dose methotrexate-based chemoimmunotherapy in patients with primary CNS lymphoma: results of the second randomisation of the International Extranodal Lymphoma Study Group-32 phase 2 trial. Lancet Haematol. 2017;4:e510–e523. doi: 10.1016/S2352-3026(17)30174-6. - DOI - PubMed
    1. Schorb E, et al. Induction therapy with the MATRix regimen in patients with newly diagnosed primary diffuse large B-cell lymphoma of the central nervous system—an international study of feasibility and efficacy in routine clinical practice. Br. J. Haematol. 2020;189:879–887. doi: 10.1111/bjh.16451. - DOI - PubMed
    1. Schaff LR, Grommes C. Primary central nervous system lymphoma. Blood. 2022;140:971–979. doi: 10.1182/blood.2020008377. - DOI - PMC - PubMed