. 2023 Jun 12;8(1):92.
doi: 10.1038/s41541-023-00682-2.

A pilot metabolomic study of drug interaction with the immune response to seasonal influenza vaccination

Affiliations

A pilot metabolomic study of drug interaction with the immune response to seasonal influenza vaccination

Amnah Siddiqa et al. NPJ Vaccines. .

Abstract

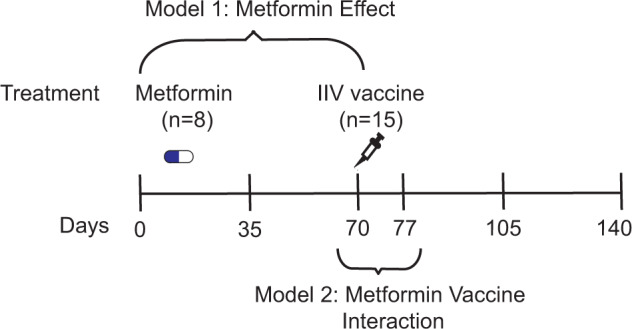
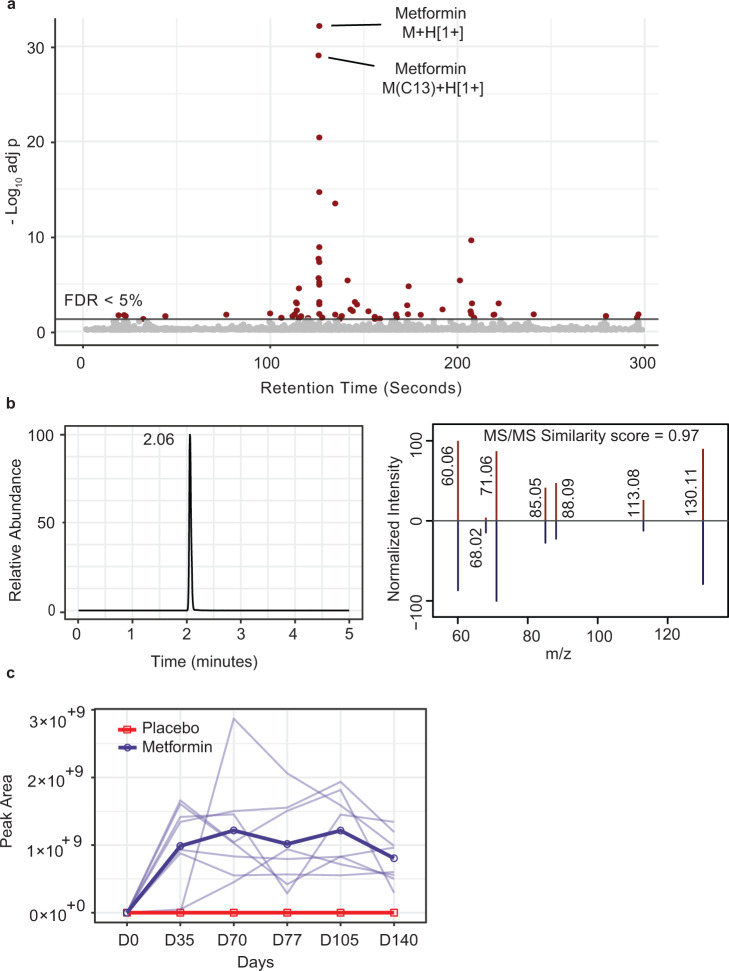
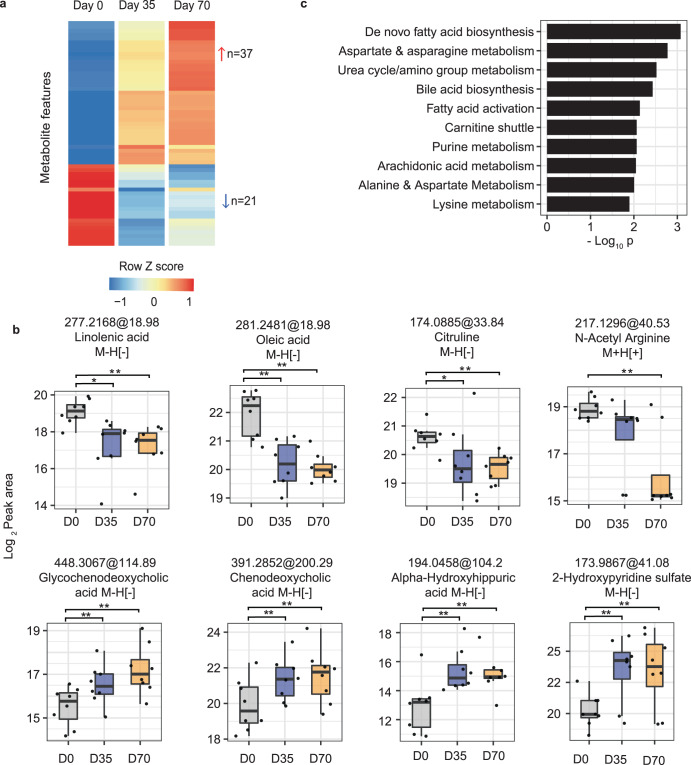
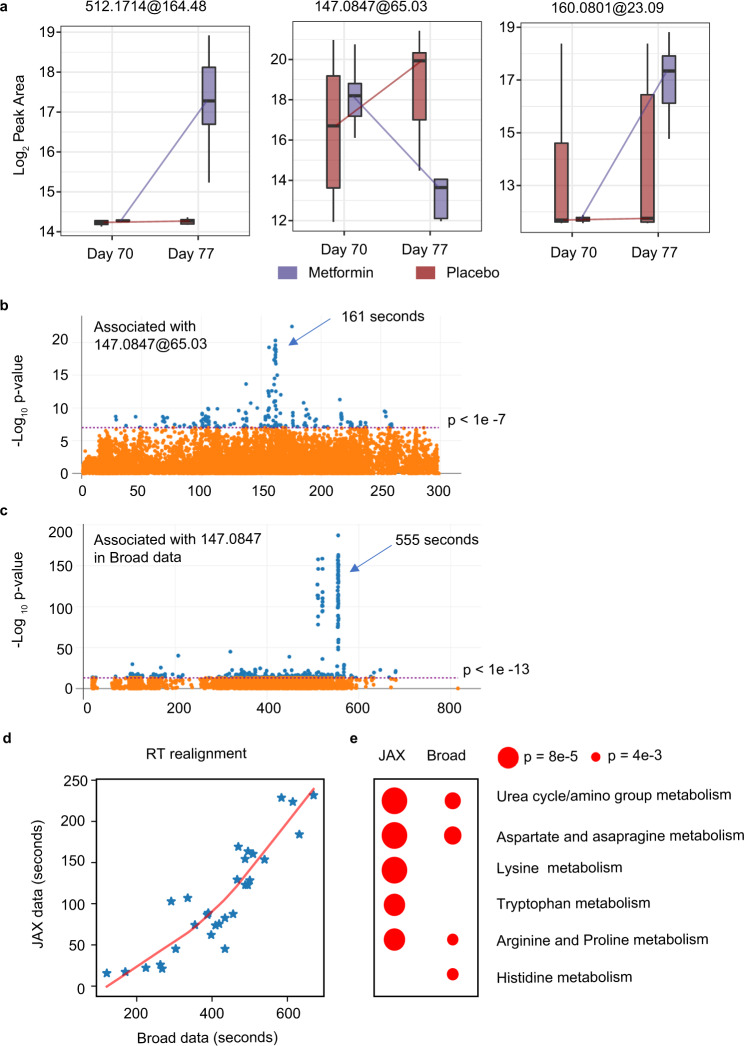
Many human diseases, including metabolic diseases, are intertwined with the immune system. The understanding of how the human immune system interacts with pharmaceutical drugs is still limited, and epidemiological studies only start to emerge. As the metabolomics technology matures, both drug metabolites and biological responses can be measured in the same global profiling data. Therefore, a new opportunity presents itself to study the interactions between pharmaceutical drugs and immune system in the high-resolution mass spectrometry data. We report here a double-blinded pilot study of seasonal influenza vaccination, where half of the participants received daily metformin administration. Global metabolomics was measured in the plasma samples at six timepoints. Metformin signatures were successfully identified in the metabolomics data. Statistically significant metabolite features were found both for the vaccination effect and for the drug-vaccine interactions. This study demonstrates the concept of using metabolomics to investigate drug interaction with the immune response in human samples directly at molecular levels.


Conflict of interest statement

The authors declare no competing interests.

Figures

Fig. 1
Fig. 1. A double blinded clinical study of metformin in influenza vaccination in the elderly.
A total of 15 study participants over the age of 65 years were randomly assigned to metformin or placebo treatment for 20 weeks. All participants were vaccinated with high-dose trivalent inactivated influenza vaccine after 10 weeks of treatment of metformin or placebo. Blood samples were collected over six timepoints, on days 0, 35, 70, 77, 105 and 140 approximately. Metformin administration started on day 0, and vaccine was administered on day 70. Our statistical analysis used two models to focus on the metformin effect (Model 1 using first three timepoints), and on the vaccine effect and interaction (Model 2 using two timepoints before and after vaccination).
Fig. 2
Fig. 2. Identification of metformin and measured kinetics in study cohort.
a Metabolite features that are different between the metformin group and placebo group, analyzed using Model 1, a mixed effect model where visit was modeled as fixed effect and participants were modeled as random effect. Significance is shown as -log10(adjusted p-value) on Y-axis. The two most significant features correspond to metformin and its 13C isotopologue. Features with false discovery rate (FDR) under 0.05 are colored in red. b Metformin is identified by accurate mass and fragmentation in MS/MS. Reference MS/MS spectrum of metformin is from MassBank (id: EA255011; red color), precursor ion m/z 130.1089. c Kinetics of metformin in all study participants. No metformin is detected in the placebo group (red). Each participant in the metformin group is plotted in light blue, and their mean values are in dark blue. All data in this figure are based on ESI+ mass spectrometry coupled with a HILIC column.
Fig. 3
Fig. 3. Metabolomic response to metformin in study cohort.
a Metabolite features significantly different after metformin administration in the plasma samples of participants. Heatmap shows group mean values, for 58 features with FDR < 0.05 and absolute fold change response >1.5 in both post-metformin visits (i.e. day 70 and day 77). b Selected significant features, all significant as in (a) but also marked by paired t-test p-values (*p < 0.05, **p < 0.01). The annotation of 2-hydroxypyridine sulfate was based on MS1 and MS2 spectra matches (level 2). The other metabolites were identified with authentic standards (level 1). All of the box plots show the median (center line), first and third quantiles (box limits), and max 1.5 × interquartile range (IQR) from box limits in each direction (upper and lower whiskers). c Pathway enrichment of top metabolite features using mummichog software (across all modes). Only top ten pathways enriched at p < 0.05 and >3 overlapping empirical compounds are shown.
Fig. 4
Fig. 4. Metabolomic response to seasonal influenza vaccine in study cohort.
a Metabolite features different after IIV vaccination in the plasma samples of participants, shown in volcano plot with significance on Y-axis and magnitude on X-axis. Significant metabolite features were determined by Model 2 (FDR < 0.05 and absolute fold change response >1.5). b Selected significant features, all significant as in (a) but also marked by paired t-test p-values (*p < 0.05, **p < 0.01). Glyceric acid was identified with MSI level 1 annotation and others (1-Methylinosine [283.1037@103.62], Thymidine glycol [275.0833@110.96], Bissulfine [117.0041@45.67]) with MSI level 4 annotation. All of the box plots show the median (center line), first and third quantiles (box limits), and max 1.5 × interquartile range (IQR) from box limits in each direction (upper and lower whiskers). c Pathway enrichment of top metabolite features using mummichog software (across all modes). Only top ten pathways enriched at p < 0.05 and >3 overlapping compounds are shown.
Fig. 5
Fig. 5. Metabolite features found with significant statistical interaction between metformin and vaccine.
a Metabolites with FDR < 0.05 in Model 2 show different responses to vaccination based on the metformin treatment. Their m/z@retention time is shown on top. All of the box plots show the median (center line), first and third quantiles (box limits), and max 1.5 × interquartile range (IQR) from box limits in each direction (upper and lower whiskers). b Metabolite features associated with [147.0847@65.03] in this study, HILIC ESI+ data. c The metabolite features associated with [147.0843@354.85] in the Broad dataset. The p-value on Y-axis in (b, c) is based on Spearman rank correlation. FDR values are in similar range. d Retention times between the two studies are comparable after realignment, based on common known metabolites in both datasets. Both are HILIC ESI+ data. e Pathway enrichment of metabolites significantly associated with the 147.0843 features in both datasets, as in (b) and (c). All pathways with p < 0.01 are shown.

Similar articles

Cited by

References

    1. Osborn O, Olefsky JM. The cellular and signaling networks linking the immune system and metabolism in disease. Nat. Med. 2012;18:363–374. doi: 10.1038/nm.2627. - DOI - PubMed
    1. Saravia J, Raynor JL, Chapman NM, Lim SA, Chi H. Signaling networks in immunometabolism. Cell Res. 2020;30:328–342. doi: 10.1038/s41422-020-0301-1. - DOI - PMC - PubMed
    1. Suzuki T, Hidaka T, Kumagai Y, Yamamoto M. Environmental pollutants and the immune response. Nat. Immunol. 2020;21:1486–1495. doi: 10.1038/s41590-020-0802-6. - DOI - PubMed
    1. Lu E, Cyster JG. G‐protein coupled receptors and ligands that organize humoral immune responses. Immunol. Rev. 2019;289:158–172. doi: 10.1111/imr.12743. - DOI - PMC - PubMed
    1. Gutiérrez-Vázquez C, Quintana FJ. Regulation of the immune response by the aryl hydrocarbon receptor. Immunity. 2018;48:19–33. doi: 10.1016/j.immuni.2017.12.012. - DOI - PMC - PubMed