. 2023 Jun 13;14(6):358.
doi: 10.1038/s41419-023-05847-4.

Targeting transglutaminase 2 mediated exostosin glycosyltransferase 1 signaling in liver cancer stem cells with acyclic retinoid

Affiliations

Targeting transglutaminase 2 mediated exostosin glycosyltransferase 1 signaling in liver cancer stem cells with acyclic retinoid

Xian-Yang Qin et al. Cell Death Dis. .

Abstract

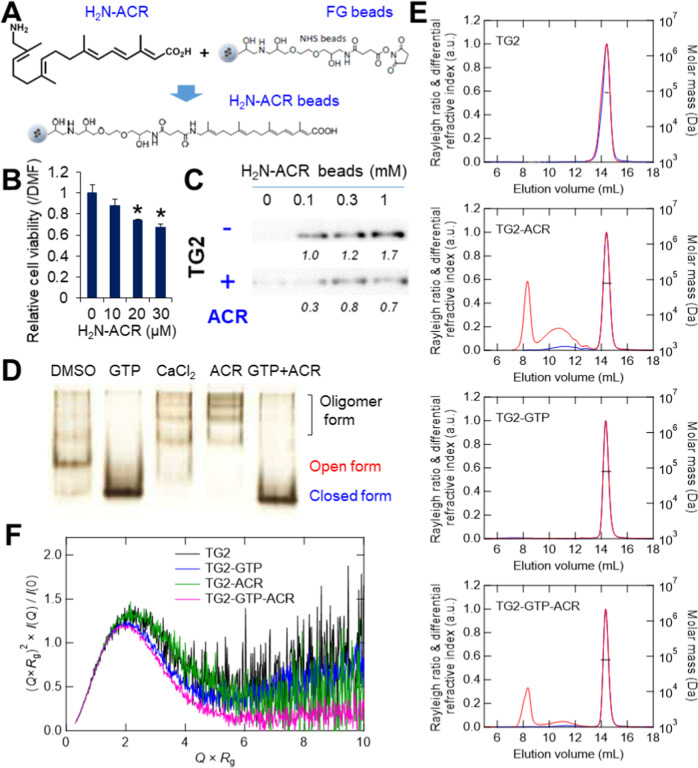
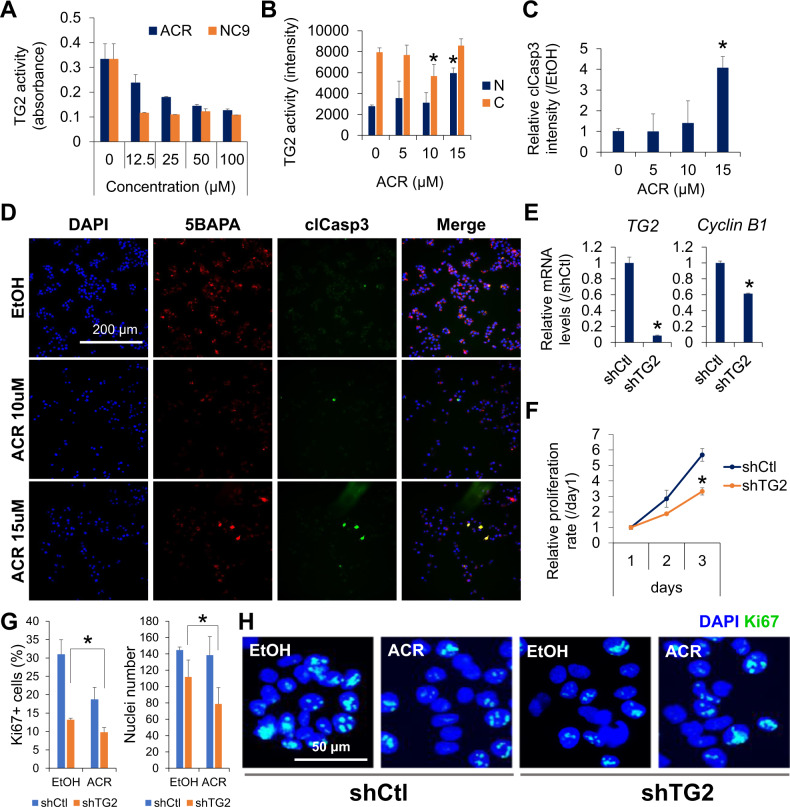
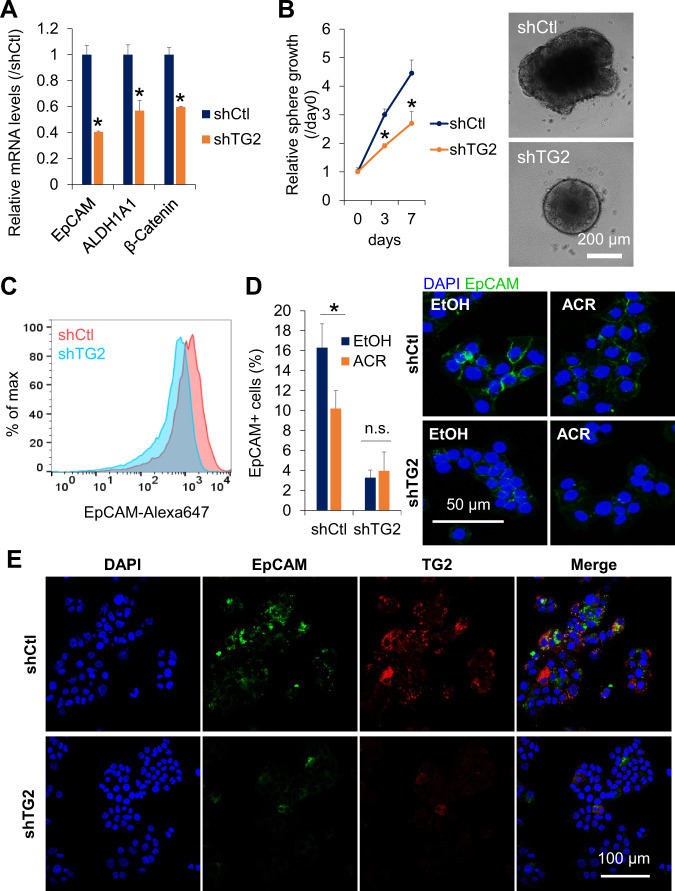
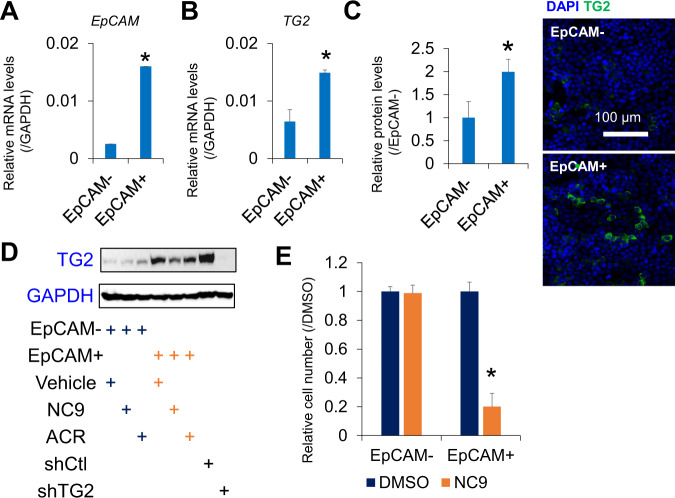
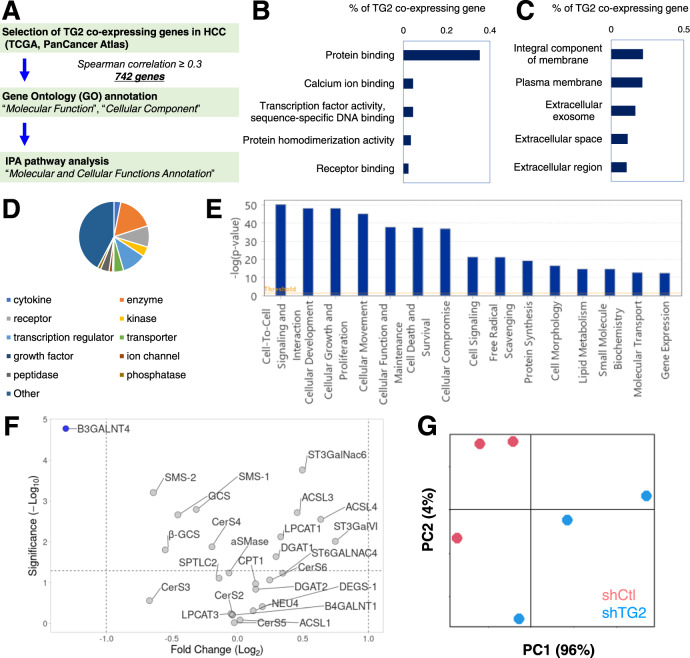
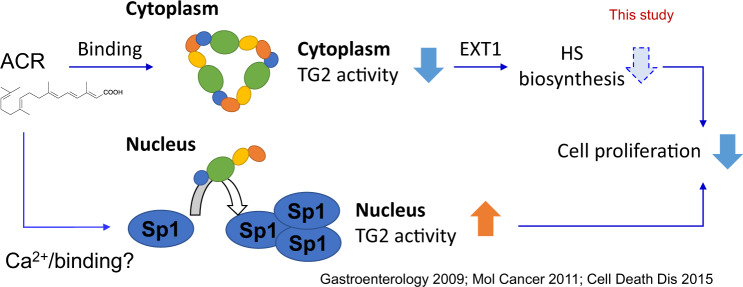
Transglutaminase 2 (TG2) is a multifunctional protein that promotes or suppresses tumorigenesis, depending on intracellular location and conformational structure. Acyclic retinoid (ACR) is an orally administered vitamin A derivative that prevents hepatocellular carcinoma (HCC) recurrence by targeting liver cancer stem cells (CSCs). In this study, we examined the subcellular location-dependent effects of ACR on TG2 activity at a structural level and characterized the functional role of TG2 and its downstream molecular mechanism in the selective depletion of liver CSCs. A binding assay with high-performance magnetic nanobeads and structural dynamic analysis with native gel electrophoresis and size-exclusion chromatography-coupled multi-angle light scattering or small-angle X-ray scattering showed that ACR binds directly to TG2, induces oligomer formation of TG2, and inhibits the transamidase activity of cytoplasmic TG2 in HCC cells. The loss-of-function of TG2 suppressed the expression of stemness-related genes, spheroid proliferation and selectively induced cell death in an EpCAM+ liver CSC subpopulation in HCC cells. Proteome analysis revealed that TG2 inhibition suppressed the gene and protein expression of exostosin glycosyltransferase 1 (EXT1) and heparan sulfate biosynthesis in HCC cells. In contrast, high levels of ACR increased intracellular Ca2+ concentrations along with an increase in apoptotic cells, which probably contributed to the enhanced transamidase activity of nuclear TG2. This study demonstrates that ACR could act as a novel TG2 inhibitor; TG2-mediated EXT1 signaling is a promising therapeutic target in the prevention of HCC by disrupting liver CSCs.


Conflict of interest statement

The authors declare no competing interests.

Figures

Fig. 1
Fig. 1. ACR induces conformational change of TG2.
A Fixation of H2N-ACR onto magnetic FG beads. The amino-group of H2N-ACR was attached covalently by displacement of the NHS functional groups of the FG beads. B Cytotoxic activity of H2N-ACR on JHH7 cells. The cells were treated with increasing concentrations of H2N-ACR for 24 h. DMF was used as the vehicle control. The data are presented as the mean ± SD; *P < 0.05, Student’s t test. C Pull down assay of human recombinant TG2 incubated with increasing concentrations of H2N-ACR-immobilized beads in the presence (+) or absence (–) of 50 nmol ACR for competitive inhibition. TG2 was detected by western blot analysis. Intensity value of each blot was shown relative to the treatment with 0.1 mM H2N-ACR-immobilized beads in the absence of ACR. D Native PAGE conformation study of recombinant human TG2. TG2 was incubated with DMSO, 500 μM GTP, 5 mM CaCl2, 100 μM ACR, or 100 μM ACR in the presence of 500 μM GTP for 2 h at room temperature and then subjected to electrophoresis. The protein bands were visualized with silver staining. E SEC-MALS chromatograms. Rayleigh ratio, differential refractive index and molar mass are displayed by red, blue, and black lines, respectively. F Dimensionless Kratky plots measured by SEC-SAXS of recombinant human TG2 (5.6 mg/mL) incubated with vehicle control EtOH, 100 μM GTP, 100 μM ACR, or 100 μM ACR in the presence of 100 μM GTP for 2 h at room temperature.
Fig. 2
Fig. 2. Dose-dependent roles of ACR on intracellular TG2 activity.
A Dose-dependent inhibitory effects of ACR and NC9 on transamidase activity. 5BAPA incorporation onto casein-coated plate in the presence of TG2, 5 mM CaCl2 and increasing concentrations of ACR or NC9 for 1 h at 37 °C was examined as the indicator of TG2 transamidase activity. B Dose-dependent effects of ACR on intracellular transamidase activity of nuclear (N) and cytoplasm (C) TG2 in JHH7 cells treated with increasing concentrations of ACR as indicated for 4 h at 37 °C. Fluorescence intensity resulting from the TRITC-based incorporation of 5BAPA into the cells was examined as an indicator of intracellular TG2 transamidase activity. C Relative intensity of clCasp3 and D representative immunofluorescence staining for 5BAPA and clCasp3 of JHH7 cells treated with increasing concentrations of ACR for 4 h. Scale bar, 200 μm. E Relative gene expression of TG2 (TGM2) and cyclin B1 (CCNB1) and F cell proliferation of JHH7 cells transduced with shCtl or shTG2 shRNA lentiviral particles. G Percentages of Ki67 positive (Ki67+) cells (left) and nuclei number (right) and H representative immunofluorescence staining of Ki67 in shCtl and shTG2-transduced JHH7 cells treated with EtOH or 5 μM ACR for 24 h. Scale bar, 50 μm. The data are presented as the mean ± SD; *P < 0.05, Student’s t test.
Fig. 3
Fig. 3. TG2 regulates proliferation of liver CSCs in monolayer and spheroid cultures.
A Relative gene expression of stemness-related genes EpCAM, ALDH1A1, and CTNNB1 and B spheroid proliferation in shCtl and shTG2-transduced JHH7 cells. C Flow cytometric analysis of EpCAM protein expression in shCtl and shTG2-transduced JHH7 cells. D Immunofluorescence triple staining of DAPI (blue), EpCAM (green), and TG2 (red) in shCtl and shTG2-transduced JHH7 cells. Scale bar, 100 μm. E Percentages (left) and representative immunofluorescence staining (right) of EpCAM+ cells in shCtl and shTG2-transduced JHH7 cells treated with EtOH or 10 μM ACR for 24 h. Scale bar, 50 μm.
Fig. 4
Fig. 4. TG2 high expression liver CSCs are selectively targeted by NC9.
Relative gene expression of A EpCAM and B TGM2 in sorted EpCAM+ and EpCAM- JHH7 cells. C Relative fluorescence intensity (left) and representative immunofluorescence staining (right) of TG2 in EpCAM+ and EpCAM– JHH7 cells. D Protein expression of TG2 in sorted EpCAM+ and EpCAM- JHH7 cells treated with vehicle control, 25 μM NC9 or 10 μM ACR for 16 h or shCtl and shTG2-transduced JHH7 cells. E Cell viability of EpCAM+ and EpCAM- JHH7 cells treated with 25 μM NC9 for 48 h. The data are presented as the mean ± SD; *P < 0.05, Student’s t test.
Fig. 5
Fig. 5. TG2 mediates HS signaling in liver CSCs.
A Hierarchical clustering of fold change expression for the proteins measured by nLC-MS/MS in sorted EpCAM+ and EpCAM– JHH7 cells treated with vehicle control, 25 μM NC9, or 10 μM ACR for 16 h or shCtl and shTG2-transduced JHH7 cells. B Summary of the number of differentially expressed proteins with a threshold of more than 2-fold. C Comparison of downregulated proteins by NC9 and ACR in EpCAM+ JHH7 cells, downregulated proteins between shTG2 and shCtl JHH7 cells, and upregulated proteins between EpCAM+ and EpCAM– JHH7 cells. The three common proteins are highlighted. D Correlation between gene expression of TGM2 and EXT1 in a total of 25 HCC cell lines in the CCLE database. The data are presented as a robust multiarray average. E Protein expression of EXT1 in JHH7 cells treated with vehicle control, 25 μM NC9, or 25 μM ZDON for 16 h. F Gene expression of EXT1 in JHH7 cells treated with vehicle control, 25 μM NC9, or 25 μM ZDON for 4 h. G Gene expression of EXT1 and H cell proliferation of JHH7 cells transfected either with siCtl or siEXT1 for 24 h. Representative immunofluorescence staining for HS (I) in JHH7 cells treated with DMSO or 25 μM NC9 for 24 h and J in shCtl and shTG2-transduced JHH7 cells. Scale bar, 50 μm. K Immunofluorescence triple staining of DAPI (blue), TG2 (green), and HS (red) in EpCAM+ and EpCAM– JHH7 cells. Scale bar, 100 μm. L A schematic model of TGF-β1 activation-dependent regulatory network underlying the control of EXT1 gene expression by TG2 in HCC cells generated using “Upstream Regulator Analysis” and “Path Explore” functions in IPA platform. Gene expression of (M) EXT1 and 4 candidate upstream transcription regulators of EXT1 that CITED2, KLF6, HNF1B, and BHLHE40 and (N) downstream targets of TGF-β1 that SMAD2, SMAD3 and SMAD4 in shCtl and shTG2-transduced JHH7 cells. (O) Gene expression of EXT1 and SMAD3 in JHH7 cells treated with DMSO or a TGF-β small molecule inhibitor SB431542 at 10 μM for 4 h. The data are presented as the mean ± SD; *P < 0.05, Student’s t-test.
Fig. 6
Fig. 6. Correlation of TG2 and membrane signaling in human HCC tumors.
A Schematic overview to identify TG2-correlated genes in human HCC tumors through an analysis of the Cancer Genome Atlas (TCGA). Gene Ontology (GO) annotation of B “Molecular Function” and C “Cellular Component” with TG2-correlated genes in human HCC tumors. D Gene type and E molecular and cellular functions annotation analysis with TG2-correlated genes in human HCC tumors in IPA platform. F Volcano plot of the gene expression profile of 26 well-known enzymes involved in cell recognition and membrane protein regulation and G PCA plot of lipidomic profiling analysis with MALDI-TOFMS in shCtl and shTG2-transduced JHH7 cells.
Fig. 7
Fig. 7. Schematic diagram of multiple roles of ACR on intracellular TG2 activity in regulating cell proliferation of liver CSCs.
ACR directly bonded to and induced oligomer formation of TG2, which inhibited the transamidase activity of cytoplasmic TG2 in HCC cells. Loss-of-function of TG2 suppressed the expression of stemness-related genes, spheroid proliferation and selectively induced cell death of the EpCAM+ liver CSC subpopulation in HCC cells. Mechanistically, TG2 inhibition suppressed the gene and protein expression of the HS biosynthesis enzyme, EXT1, and HS biosynthesis in HCC cells. TG2 and HS were highly expressed and co-located in EpCAM+ liver CSCs, highlighting a potential role of TG2-mediated HSPG signaling in regulating cell proliferation of liver CSCs. In contrast, ACR at a high dose increased intracellular Ca2+ concentration along with clCasp3+ cells, which probably contributed to the enhanced transamidase activity of nuclear TG2, cross-linking of nuclear transcription factors such as Sp1, and apoptosis in HCC cells as previously reported [32, 36, 37].

Similar articles

Cited by

References

    1. Sung H, Ferlay J, Siegel RL, Laversanne M, Soerjomataram I, Jemal A, et al. Global cancer statistics 2020: GLOBOCAN estimates of incidence and mortality worldwide for 36 cancers in 185 countries. CA Cancer J Clin. 2021;71:209–49. doi: 10.3322/caac.21660. - DOI - PubMed
    1. Singal AG, Lampertico P, Nahon P. Epidemiology and surveillance for hepatocellular carcinoma: New trends. J Hepatol. 2020;72:250–61. doi: 10.1016/j.jhep.2019.08.025. - DOI - PMC - PubMed
    1. Kudo M, Finn RS, Qin S, Han K-H, Ikeda K, Piscaglia F, et al. Lenvatinib versus sorafenib in first-line treatment of patients with unresectable hepatocellular carcinoma: a randomised phase 3 non-inferiority trial. Lancet. 2018;391:1163–73. doi: 10.1016/S0140-6736(18)30207-1. - DOI - PubMed
    1. Llovet JM, Ricci S, Mazzaferro V, Hilgard P, Gane E, Blanc J-F, et al. Sorafenib in advanced hepatocellular carcinoma. N Engl J Med. 2008;359:378–90. doi: 10.1056/NEJMoa0708857. - DOI - PubMed
    1. Finn RS, Qin S, Ikeda M, Galle PR, Ducreux M, Kim T-Y, et al. Atezolizumab plus Bevacizumab in Unresectable Hepatocellular Carcinoma. N Engl J Med. 2020;382:1894–905. doi: 10.1056/NEJMoa1915745. - DOI - PubMed

Publication types

Substances