. 2023 Jun 12;14(1):3455.
doi: 10.1038/s41467-023-39020-4.

Single cell and spatial sequencing define processes by which keratinocytes and fibroblasts amplify inflammatory responses in psoriasis

Affiliations

Single cell and spatial sequencing define processes by which keratinocytes and fibroblasts amplify inflammatory responses in psoriasis

Feiyang Ma et al. Nat Commun. .

Abstract

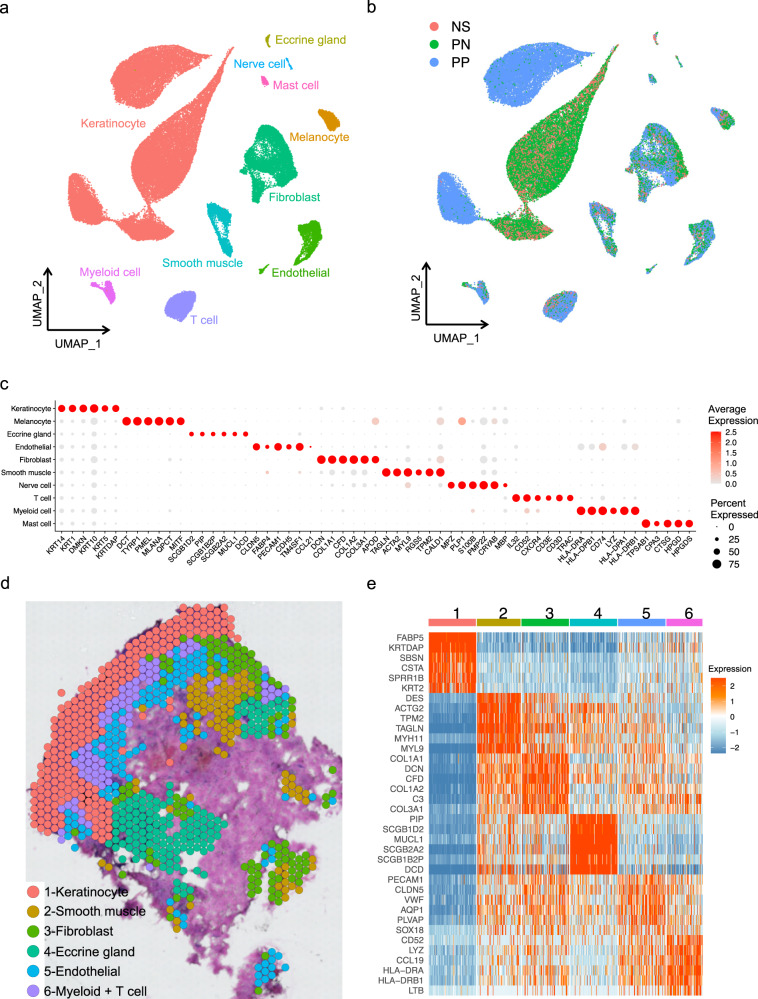
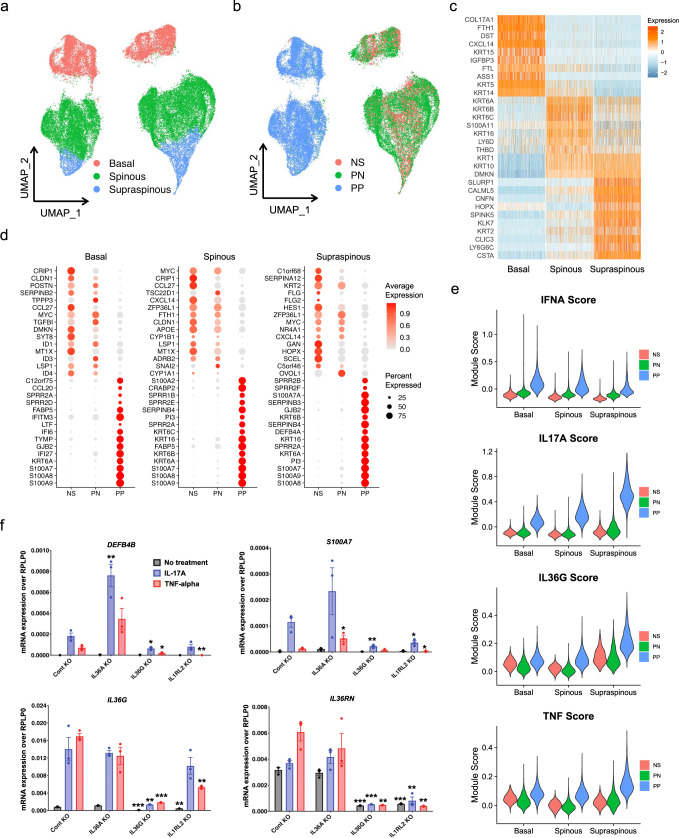
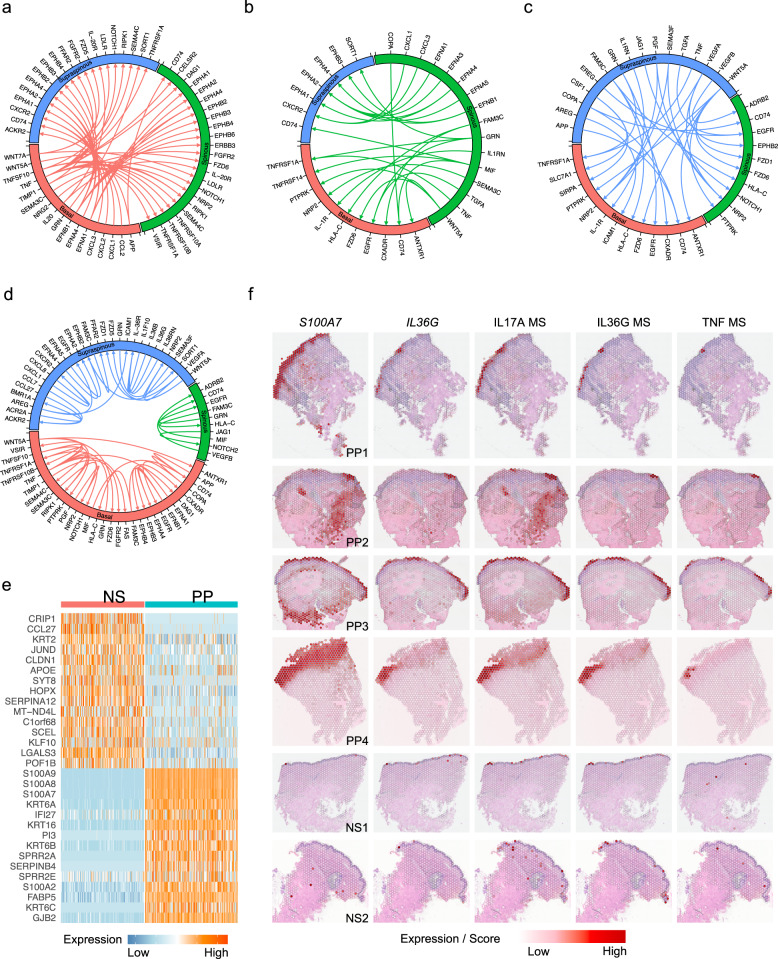
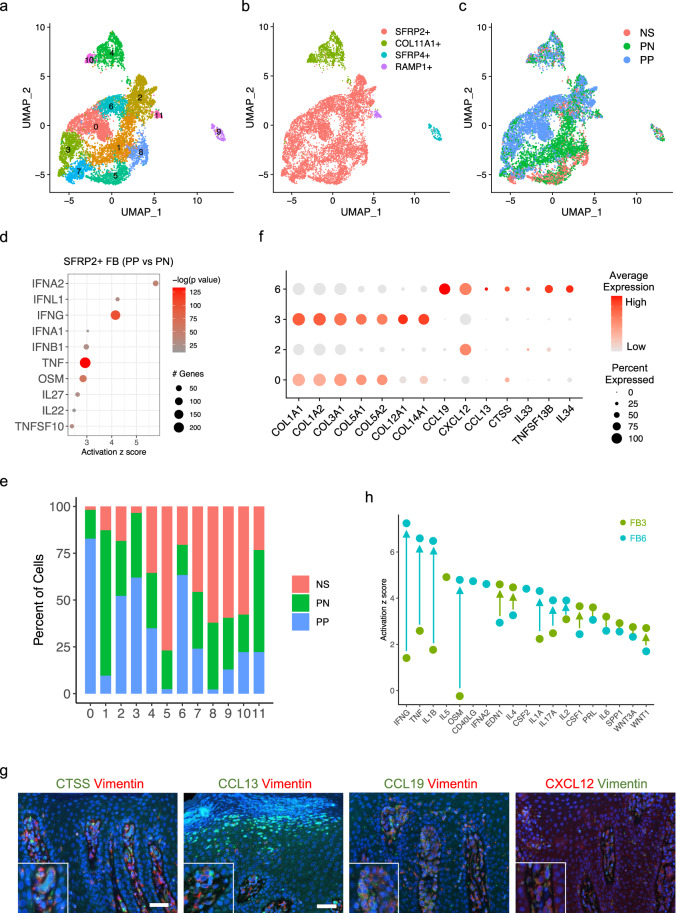
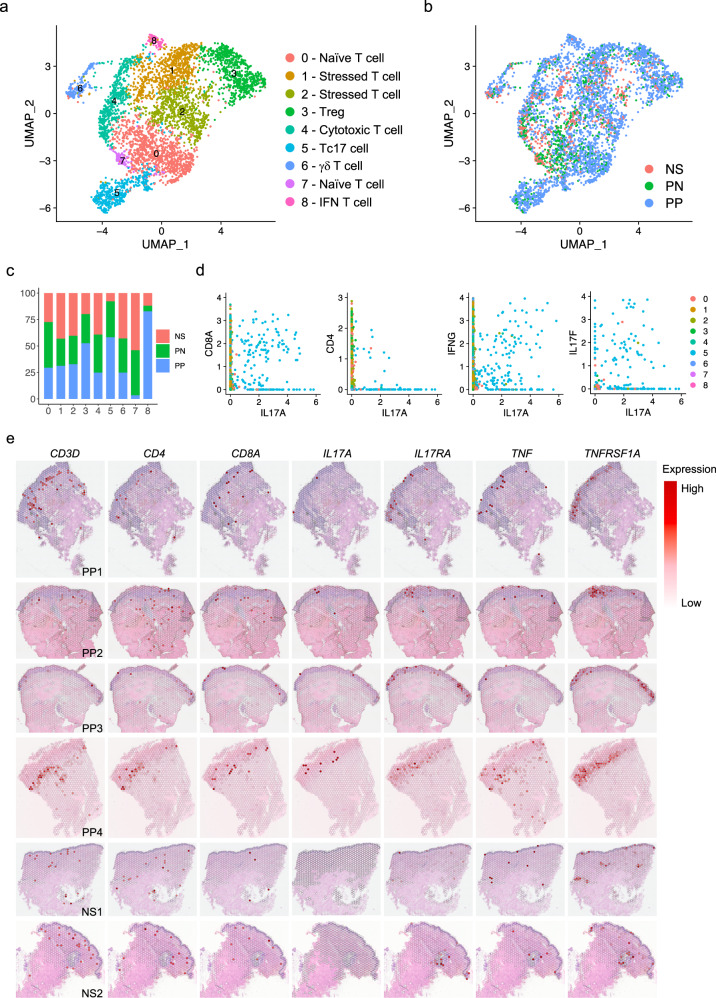
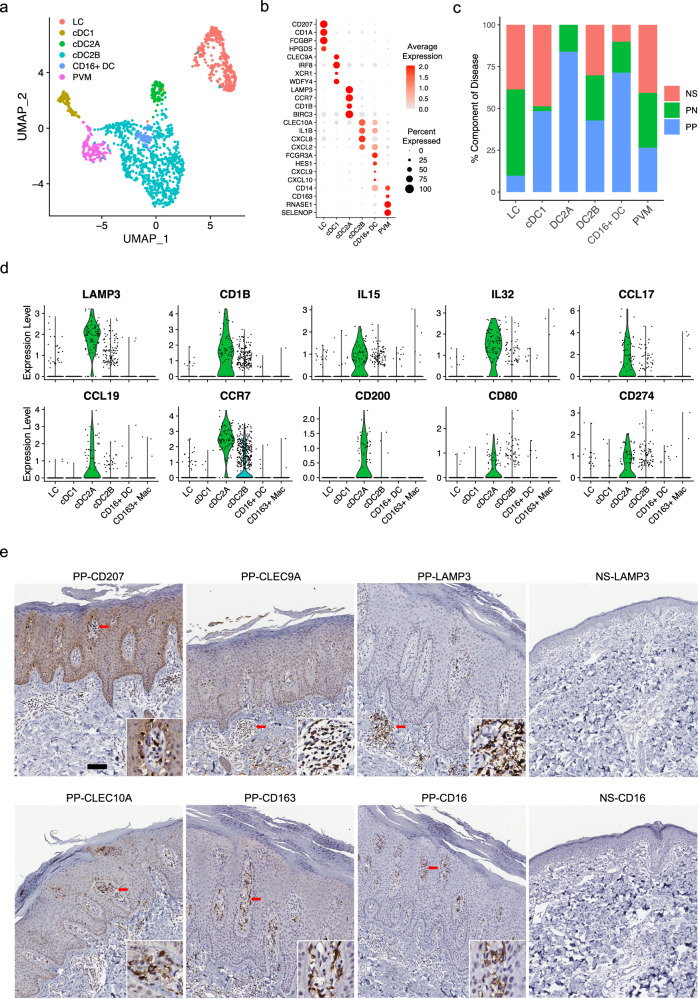
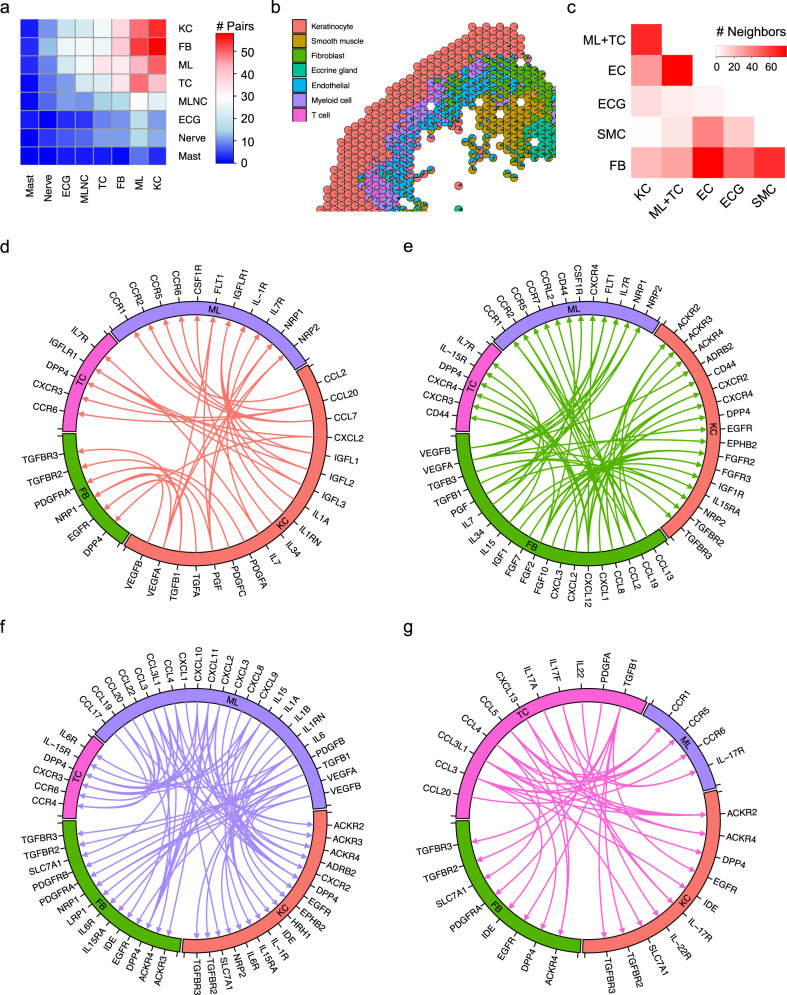
The immunopathogenesis of psoriasis, a common chronic inflammatory disease of the skin, is incompletely understood. Here we demonstrate, using a combination of single cell and spatial RNA sequencing, IL-36 dependent amplification of IL-17A and TNF inflammatory responses in the absence of neutrophil proteases, which primarily occur within the supraspinous layer of the psoriatic epidermis. We further show that a subset of SFRP2+ fibroblasts in psoriasis contribute to amplification of the immune network through transition to a pro-inflammatory state. The SFRP2+ fibroblast communication network involves production of CCL13, CCL19 and CXCL12, connected by ligand-receptor interactions to other spatially proximate cell types: CCR2+ myeloid cells, CCR7+ LAMP3+ dendritic cells, and CXCR4 expressed on both CD8+ Tc17 cells and keratinocytes, respectively. The SFRP2+ fibroblasts also express cathepsin S, further amplifying inflammatory responses by activating IL-36G in keratinocytes. These data provide an in-depth view of psoriasis pathogenesis, which expands our understanding of the critical cellular participants to include inflammatory fibroblasts and their cellular interactions.


Conflict of interest statement

J.E.G. has received research support from Almirall, AnaptysBio, Novartis, AbbVie, Eli Lilly, Kyowa Kirin, Galderma, BMS, Janssen. J.E.G. has served as advisor to Pfizer, AbbVie, Eli Lilly, Galderma, Almirall, AnaptysBio, Novartis, Sanofi, BMS. J.M.K. has received research support from Janssen, BMS, and Q32 bio. J.M.K. has served as an advisor to Eli Lilly, BMS, AstraZeneca, GlaxoSmithKline, Ventus Therapeutics, Admirex Pharmaceuticals, Aurinia Pharmaceuticals, and Provention Bio. The remaining authors declare no competing interests.

Figures

Fig. 1
Fig. 1. Cell types observed in psoriasis skin and their spatial locations.
a UMAP plot showing 67,378 cells colored by cell types. b UMAP plot showing the cells colored by disease conditions. NS healthy normal skin, PN psoriatic non-lesional skin, PP psoriasis skin. c Dot plot showing representative marker genes for each cell type. The color scale represents the scaled expression average of each gene. The size of the dot represents the percentage of cells expressing each gene of interest. d Spatial plot for 764 spots colored by clusters, the coordinates of the spot correspond to the location in the tissue. e Heatmap showing the representative marker genes for each cluster in panel d. The color scale represents the scaled expression of each gene.
Fig. 2
Fig. 2. IL-36 amplifies IL-17 response in the supraspinous epidermis of psoriatic skin.
a UMAP plot showing 41,923 keratinocytes colored by cell types. b UMAP plot showing the keratinocytes colored by disease conditions. c Heatmap showing marker genes with the highest fold change for each subtype. The color scale represents the scaled expression of each gene. d Dot plot showing the top 15 differentially expressed genes comparing PP to NS in the basal (left), spinous (middle), and supraspinous (right) layers. The color scale represents the scaled expression of each gene. The size of the dot represents the percentage of cells expressing each gene of interest. e Violin plot showing the cytokine module scores in the keratinocyte subtypes, and each subtype is split by the disease conditions. f qRT-PCR of four genes in IL36A, IL36G and IL1RL2 KO keratinocytes after treatment with IL-17A and TNF (n = 3 biologically independent; unpaired t-test; *P < 0.05, **P < 0.01, ***P < 0.001; mean ± SEM).
Fig. 3
Fig. 3. Ligand–receptor interaction and spatial location of the keratinocyte subtypes.
a Circos plot showing the ligand–receptor interactions with a higher score in PP compared to NS. The ligands are expressed by the basal keratinocytes, the receptors are expressed by the other subtypes. b Circos plot showing the ligand–receptor interactions with a higher score in PP compared to NS. The ligands are expressed by the spinous keratinocytes, the receptors are expressed by the other subtypes. c Circos plot showing the ligand–receptor interactions with a higher score in PP compared to NS. The ligands are expressed by the supraspinous keratinocytes, the receptors are expressed by the other subtypes. d Circos plot showing the ligand-receptor interactions with a higher score in PP compared to NS. The ligands and receptors are expressed by the same subtype. e Heatmap showing the top differentially expressed genes between NS and PP keratinocytes identified in both scRNA-seq and spatial-seq. f Spatial plots showing expression level of S100A7 and IL36G, and the downstream target module scores for IL-17A, IL-36G, and TNF.
Fig. 4
Fig. 4. SFRP2+ fibroblasts transition from pro-fibrotic state to pro-inflammatory state in psoriatic skin.
a UMAP plot showing 9327 fibroblasts colored by sub-clusters. b UMAP plot showing the fibroblasts colored by subtypes. c UMAP plot showing the fibroblasts colored by disease conditions. d Dot plot showing the top 10 cytokine upstream regulators for differentially expressed genes comparing PP to PN in the SFRP2+ fibroblasts. The color scale represents the −log10(p value) from the enrichment analysis. The size of the dot represents the number of differentially expressed genes downstream of each upstream regulator. Hypergeometric test was used for the enrichment analysis, and the Benjamini–Hochberg procedure was used for false discovery rate adjustment. e Bar plot showing the abundance composition across the disease conditions for each fibroblast sub-clusters. f Dot plot showing collagen marker genes for sub-cluster 3 and inflammatory marker genes for sub-cluster 3. The color scale represents the scaled expression average of each gene. The size of the dot represents the percentage of cells expressing each gene of interest. g Immunofluorescence showing the colocalization of CTSS, CCL13, CCL19, and CXCL12 with Vimentin in the dermal papillae. h Scatter plot showing the top upstream regulators for marker genes in PP fibroblast cluster 3 and cluster 6. The color represents the cluster identity of the upstream regulator. The arrows show the change of the activation z scores.
Fig. 5
Fig. 5. CD8+ Tc17 is a major source of IL17A in psoriatic skin.
a UMAP plot showing 4468T cells colored by sub-clusters. b UMAP plot showing the T cells colored by disease conditions. c Bar plot showing the abundance composition across the disease conditions for each sub-cluster. d Scatter plot showing co-expression of pairs of genes. The color represents the sub-cluster identity of the cells. e Spatial plots showing the expression level of CD3D, CD4, CD8A, IL17A, IL17RA, TNF, and TNFRSF1A in all the spatial-seq samples.
Fig. 6
Fig. 6. Single-cell RNA sequencing defines unique myeloid subsets in psoriasis.
a UMAP plot showing 1436 myeloid cells colored by subtypes. b Dot plot showing the representative marker genes for each subtype. The color scale represents the scaled expression of the gene. The size of the dot represents the percentage of cells expressing the gene of interest. c Bar plot showing the abundance composition across the disease conditions for each subtype. d Violin plot showing the expression of genes split by subtype. Each dot represents the gene’s expression in a single cell. e Immunohistochemistry staining for marker genes for each myeloid subtype. LAMP3 and CD16 were shown in both NS and PP samples. The red arrow points to the zoom-in location. The size bar represents 100 μm.
Fig. 7
Fig. 7. Ligand–receptor interaction analysis between the four main cell types in psoriatic skin.
a Heatmap showing the number of ligand–receptor pairs with a higher score in PP compared to NS among the cell types. The ligands were expressed by the cell types in the row, and the receptors were expressed by the cell types in the column. The color scale represents the number of ligand–receptor pairs. b Scatter pie plot showing the relative adjacency of the cell types identified in spatial-seq. c Heatmap showing the number of neighbors for each pair of cell types. d Circos plot showing the cytokine and growth factor ligand–receptor interactions with a higher score in PP compared to NS. The ligands are expressed by the keratinocytes, the receptors are expressed by the other cell types. e Circos plot showing the cytokine and growth factor ligand–receptor interactions with a higher score in PP compared to NS. The ligands are expressed by the fibroblasts, the receptors are expressed by the other cell types. f Circos plot showing the cytokine and growth factor ligand–receptor interactions with a higher score in PP compared to NS. The ligands are expressed by the myeloid cells, the receptors are expressed by the other cell types. g Circos plot showing the cytokine and growth factor ligand–receptor interactions with a higher score in PP compared to NS. The ligands are expressed by the T cells, the receptors are expressed by the other cell types.

References

    1. Nestle FO, Kaplan DH, Barker J. Psoriasis. N. Engl. J. Med. 2009;361:496–509. doi: 10.1056/NEJMra0804595. - DOI - PubMed
    1. Griffiths CEM, Armstrong AW, Gudjonsson JE, Barker J. Psoriasis. Lancet. 2021;397:1301–1315. doi: 10.1016/S0140-6736(20)32549-6. - DOI - PubMed
    1. Gudjonsson JE, Elder JT. Psoriasis: epidemiology. Clin. Dermatol. 2007;25:535–546. doi: 10.1016/j.clindermatol.2007.08.007. - DOI - PubMed
    1. Tsoi LC, et al. Large scale meta-analysis characterizes genetic architecture for common psoriasis associated variants. Nat. Commun. 2017;8:15382. doi: 10.1038/ncomms15382. - DOI - PMC - PubMed
    1. Uppala R, et al. “Autoinflammatory psoriasis”-genetics and biology of pustular psoriasis. Cell. Mol. Immunol. 2021;18:307–317. doi: 10.1038/s41423-020-0519-3. - DOI - PMC - PubMed

Publication types