. 2023 Jun 12;14(1):3457.
doi: 10.1038/s41467-023-39191-0.

Dynamic chromatin architecture of the porcine adipose tissues with weight gain and loss

Affiliations

Dynamic chromatin architecture of the porcine adipose tissues with weight gain and loss

Long Jin et al. Nat Commun. .

Abstract

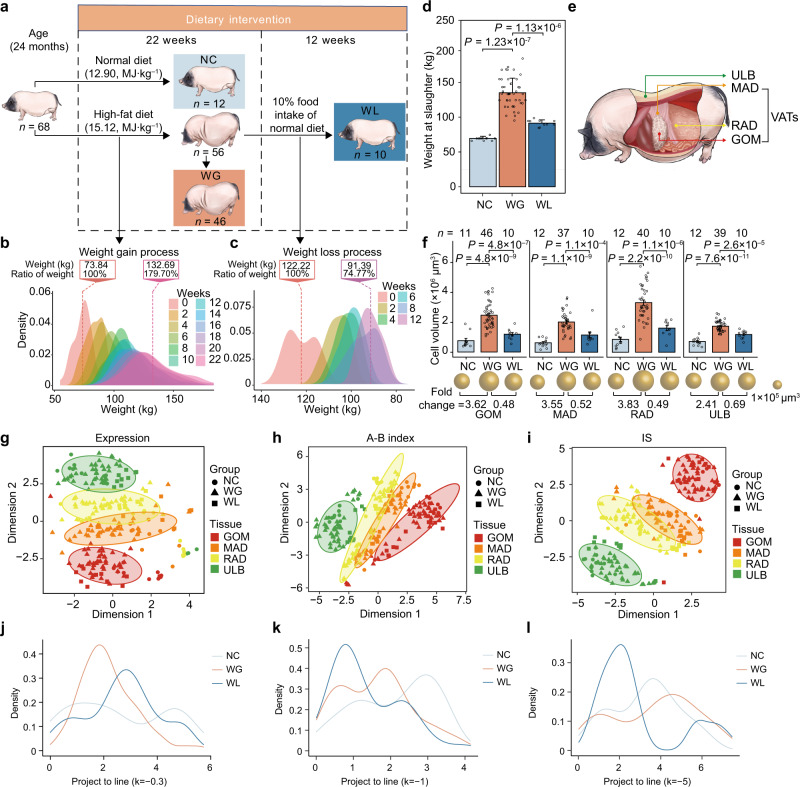
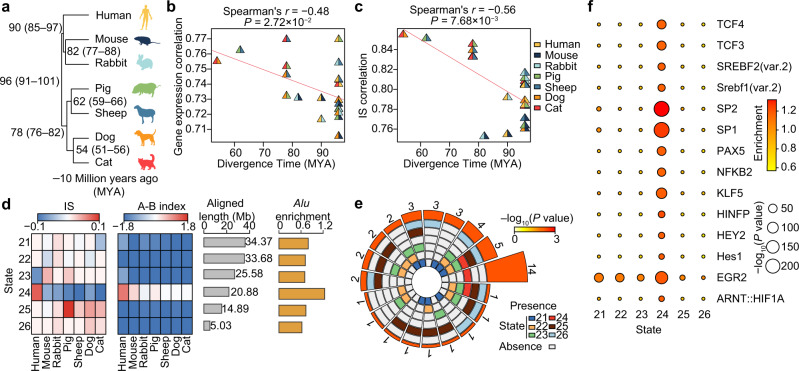
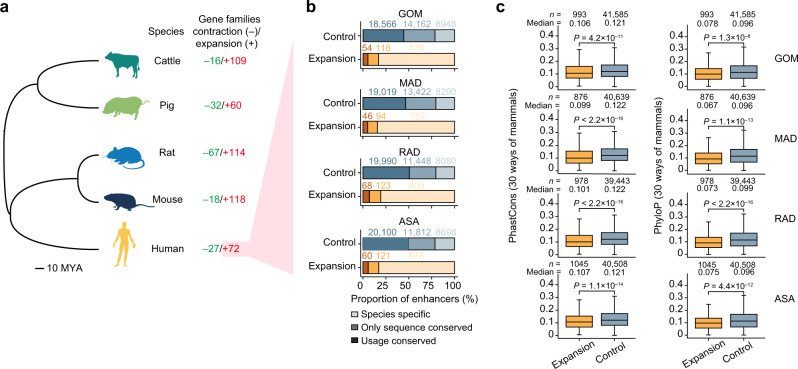
Using an adult female miniature pig model with diet-induced weight gain/weight loss, we investigated the regulatory mechanisms of three-dimensional (3D) genome architecture in adipose tissues (ATs) associated with obesity. We generated 249 high-resolution in situ Hi-C chromatin contact maps of subcutaneous AT and three visceral ATs, analyzing transcriptomic and chromatin architectural changes under different nutritional treatments. We find that chromatin architecture remodeling underpins transcriptomic divergence in ATs, potentially linked to metabolic risks in obesity development. Analysis of chromatin architecture among subcutaneous ATs of different mammals suggests the presence of transcriptional regulatory divergence that could explain phenotypic, physiological, and functional differences in ATs. Regulatory element conservation analysis in pigs and humans reveals similarities in the regulatory circuitry of genes responsible for the obesity phenotype and identified non-conserved elements in species-specific gene sets that underpin AT specialization. This work provides a data-rich tool for discovering obesity-related regulatory elements in humans and pigs.


Conflict of interest statement

The authors declare no competing interests.

Figures

Fig. 1
Fig. 1. Transcriptomic and chromatin architecture dynamics in distinct ATs associated with body weight in changes.
a Schematic overview of the experimental design for dietary treatments. b Body weight of pigs (n = 56) during progressive weight gain over 22 weeks, observed every 2 weeks (12 time points). Ratio of weight: relative to the weight at baseline (0 weeks). c Body weight of pigs (n = 10) during progressive weight loss over 12 weeks (from 23rd to 34th week), observed every 2 weeks (6 time points). Ratio of weight: relative to the weight at the 22nd week. d Histogram of body weight at slaughter for NC, WG, and WL groups. WG weight gain, WL weight loss, NC normal diet. Data are presented as means ± SD (NC, n = 12; WG, n = 46; WL, n = 10). p values were determined by two-sided Wilcoxon rank-sum test. e Adipose tissue sources: one SAT (ULB: upper layer of backfat) and three VATs (GOM greater omentum, MAD mesenteric adipose, RAD retroperitoneal adipose). SAT subcutaneous adipose tissue, VAT visceral adipose tissue. f Histogram of adipocyte volumes during weight gain or loss for each adipose depot (top). Spheres show relative adipocyte volume, with the scale shown on the right (middle). Fold-changes in adipocyte volume in WG relative to NC (left) and in WL relative to WG (right) (bottom). Data are presented as mean values ± SD. Statistical significance was determined using a one-sided Wilcoxon rank-sum test. gi Comparison of variation in gene transcription (g), AB compartment (h), and IS (i) between adipose depots and between groups. t‑distributed stochastic neighbor embedding (t-SNE) clustering of samples. In t-SNE plots, ellipses indicate AT samples with similar profiles, constructed at a probability of 0.85. jl Proportional distribution of projection distance for t-SNE plots of gene expression in g (j), A-B index in h (k), and IS in i (l) between each dot and a given line (y = kx, k = −0.3, −1, −5 for gene expression, A-B index and IS, respectively) across groups. Source data for (bd, fl) are provided as a Source Data file.
Fig. 2
Fig. 2. Population-level dynamics of compartmentalization and TAD boundaries in distinct ATs across weight gain and loss treatment groups.
a, b Differences in the frequency of A/B compartments in pairwise comparisons of ATs and treatments. Proportion plot showing stability and variability of compartment shifts across different ATs (a) and groups/treatments (b). Circos plots highlight changes in compartment status between pairwise ATs in each treatment group (a) or between treatment groups in each AT (b). Red or blue vectors indicate changes in frequency from low-to-high or high-to-low, respectively, in pairwise comparisons between ATs in adjacent rings; vector thickness is proportional to frequency of the changed compartment. c, d Differences in frequency of TAD boundaries in pairwise comparisons of ATs and treatments. Proportion plot showing the stability and variability of TAD boundary shifts across different ATs (c) and groups/treatments (d). Circos plots highlight changes in TAD boundary frequency. e Box plots of changes in expression level for genes embedded in stable active compartment regions (red) vs. those that changed (green) between pairwise ATs. f, g Representative changes in A/B compartment status between ATs. Compartment status (A/B) across all individuals in the NC group is shown for the typical VAT-active gene WT1 and SAT-active gene IRX3. Expression levels (TPM) were also plotted. h Box plots showing changes in expression levels of genes embedded in stable TAD boundary regions (red) vs. those that changed (green) between pairwise ATs. In the boxplot in (e) and (h), the internal line indicates the median, box limits indicate the 25th and 75th quartiles, and whiskers extend to 1.5 × IQR from the quartiles. The gene number in each category is listed above each box. Statistical significance was determined by a two-sided Wilcoxon rank-sum test. i, j Representative TAD boundaries shift between ATs. Chromatin interaction heat maps are shown for typical replicates of GOM and ULB in the NC group. The black arrow indicates the position of the shifted boundary. Representative embedded genes include EN1 (i) and TCF21 (j), which are highly expressed in ULB and GOM, respectively. Source data are provided as a Source Data file.
Fig. 3
Fig. 3. Rewiring of PEIs with transcriptional changes between distinct ATs and the dynamic during different nutritional conditions.
a The number of PEIs in each AT across groups. The numbers of genes/promoters are indicated above each bar. b Positive correlation between gene expression and RPS. Genes with RPS > 0 were divided equally into five percentiles. In the boxplot, the internal line indicates the median, the box limits indicate the upper and lower quartiles and the whiskers extend to 1.5 IQR from the quartiles (n = 18). RPS: a regulatory potential score for each gene. c t-SNE plots of the number of enhancers that interact with each promoter. d t-SNE plots of RPS of genes. The divergence in PRS profiling highlights that differences in features are more pronounced among ATs than among groups. e Schematic representation of PEIs for the typical pro-inflammatory gene TGM2, which was abundantly expressed in VATs of the NC group. (left) Promoter-centered interactions and expression levels for gene examples across four ATs. (middle left) Interaction metaplots of promoter-centered regions across four ATs. (middle right) 3D structural models of the corresponding genomic regions. (right) Difference in PEI intensity between pairwise AT comparisons. f Schematic representation of PEIs for the typical adipogenesis gene PPARG, which is abundantly expressed in SATs of the NC group. g Heatmaps of RPS values (top) and expression level (bottom) of HOXD genes across ATs. h Changes in expression and RPS values of 159 known inflammatory genes in each AT between the NC and WG groups. Twenty-three inflammation-related up-regulated genes in each AT of the WG group compared to NC are shown. i Heatmaps of RPS (left) and expression (right) patterns of 15 inflammation-related genes that are highly expressed in the WG group compared to the NC group and remained stable in the WL group. Differential RPS genes: genes with changes in RPS FC [fold change] >1.5, |Δ| > 2; Otherwise, Non-differential RPS genes. Source data are provided as a Source Data file.
Fig. 4
Fig. 4. Evolutionary divergence of local spatial context in ATs across seven mammalian species.
a Divergence times (million years ago, MYA) and phylogenetic tree topology of seven representative mammalian species retrieved from the TimeTree database (http://www.timetree.org/). The number in the parentheses indicates the range of divergence times. b Plot of Spearman’s r values showing the relationship (r = –0.481) between gene expression levels of 1-1 orthologs (n = 8020) and the divergence time for each pair of mammalian species. The statistical significance of the two-sided p value was calculated using hypothesis testing. c Plot of Spearman’s r values showing the relationship (r = –0.564) between the IS index of all bins (94,994 10-kb bins) and the divergence time for each pair of mammalian species. The statistical significance of the two-sided p value was calculated using hypothesis testing. Evolutionary distance is positively correlated with divergence in gene expression levels and with IS divergence across species. d Distribution pattern of IS levels, A/B compartment status, and Alu element for non-conserved states (state 21–26, see Supplementary Fig. 34 for details). Note the enrichment for SINE-Alu elements in human-specific high IS state 24. e Circular plot illustrating the overlap/intersection of transcription factor motifs enriched across non-conserved states. The six tracks in the middle represent the six states, with individual blocks showing the “presence” (colored) or “absence” (white) of the state in each intersection. The height of the bars in the outer layer is proportional to the intersection size. Numbers above each bar indicate overlapping TFs for each state. The color intensity of the bars represents the significance of the intersections, as denoted by its p value (χ2 test). f Enrichment of 14 TFs that were specifically enriched in state 24. The statistical significance of the p value was calculated using χ2 testing. Source data for (bf) are provided as a Source Data file.
Fig. 5
Fig. 5. Inter-species conservation of human enhancers connected to orthologs between humans and pigs in each AT.
a Schematic of anatomic locations of AT depots in humans. b The number of PEIs in each AT. The number of genes/promoters are indicated above each bar. c Example evaluation of enhancer conservation in human ATs performed by mapping the contacts of PEIs from humans to pigs. In this case, PEIs of the IGFBP5 gene in human ASA are shown. According to the distance-normalized contact frequency (percentile score [PS]) (using C-intersecture software, see “Methods” for details), three types of enhancer conservation, including only sequence conserved (yellow), usage conserved (red), and sequence-specific (gray), are indicated in the magnified area. d Percent distribution of enhancers that are conserved in both sequence and usage for different types of orthologs between humans and pigs in each AT. The number of enhancers is shown in each bar. e Typical 1-1 ortholog examples (PPARG, CEBPB, IGFBP5, IL6ST, and VEGFA) contain enhancers that are highly conserved between humans and pigs. The conservation of enhancers for each gene is shown using humans (left) and pigs (right) as “reference” species, respectively. f Percentage distribution of enhancer conservation for 1-1 orthologs with significantly different changes in normalized expression between humans and pigs (5% confidence intervals) in each AT. The number of enhancers is shown in each bar. Source data for (bf) are provided as a Source Data file.
Fig. 6
Fig. 6. Inter-species conservation of human enhancers of rapidly evolving duplicated genes in each AT.
a Phylogenetic relationship of five representative mammalian species. The number of gene families showing significant expansion or contraction is displayed in red and green, respectively. b Inter-species conservation of human enhancers for gene families showing significant expansion compared to that for other families (as control). c Boxplots showing evolutionary conservation (inferred by PhastCons and PhyloP values) for enhancers of expanded genes and other genes. In the boxplot, the internal line indicates the median, the box limits indicate the upper and lower quartiles and the whiskers extend to 1.5 IQR from the quartiles. The numerical value above each bar indicates number of genes within this group. p values determined by one-sided Wilcoxon rank-sum test. Source for (b, c) data are provided as a Source Data file.

References

    1. OECD/World Health Organization. Overweight and obesity. In Health at a Glance: Asia/Pacific 2020: Measuring Progress Towards Universal Health Coverage (OECD Publishing, 2020). https://www.oecd-ilibrary.org/social-issues-migration-health/health-at-a....
    1. Kelly T, Yang W, Chen CS, Reynolds K, He J. Global burden of obesity in 2005 and projections to 2030. Int. J. Obes. 2008;32:1431–1437. doi: 10.1038/ijo.2008.102. - DOI - PubMed
    1. Wang QA, Tao C, Gupta RK, Scherer PE. Tracking adipogenesis during white adipose tissue development, expansion and regeneration. Nat. Med. 2013;19:1338–1344. doi: 10.1038/nm.3324. - DOI - PMC - PubMed
    1. McLaughlin T, Lamendola C, Liu A, Abbasi F. Preferential fat deposition in subcutaneous versus visceral depots is associated with insulin sensitivity. J. Clin. Endocrinol. Metab. 2011;96:E1756–E1760. doi: 10.1210/jc.2011-0615. - DOI - PMC - PubMed
    1. Kleinert M, et al. Animal models of obesity and diabetes mellitus. Nat. Rev. Endocrinol. 2018;14:140–162. doi: 10.1038/nrendo.2017.161. - DOI - PubMed

Publication types