. 2023 Jul;30(7):935-947.
doi: 10.1038/s41594-023-01016-5. Epub 2023 Jun 12.

H4K16ac activates the transcription of transposable elements and contributes to their cis-regulatory function

Affiliations

H4K16ac activates the transcription of transposable elements and contributes to their cis-regulatory function

Debosree Pal et al. Nat Struct Mol Biol. 2023 Jul.

Abstract

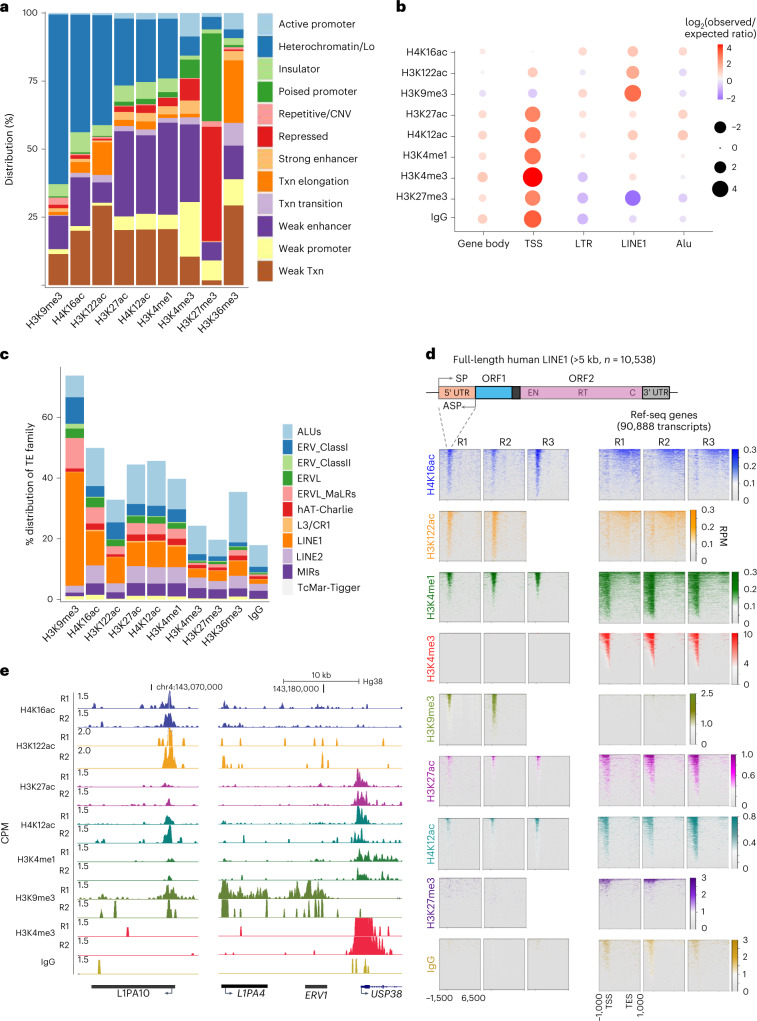
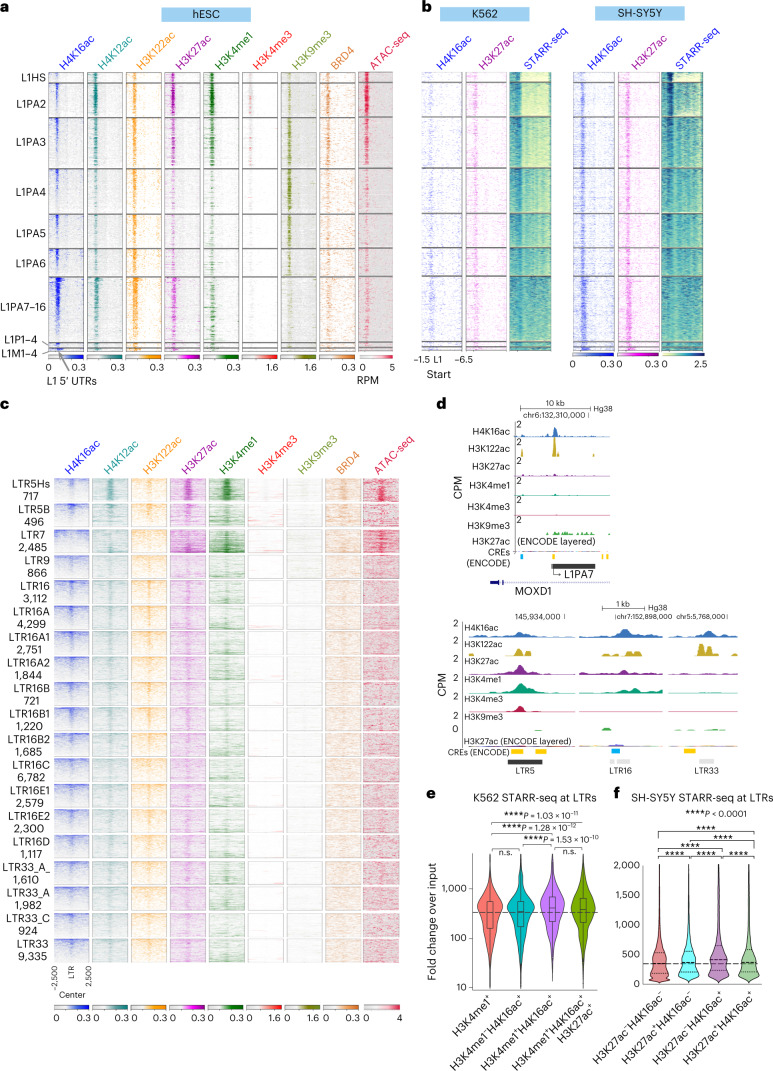
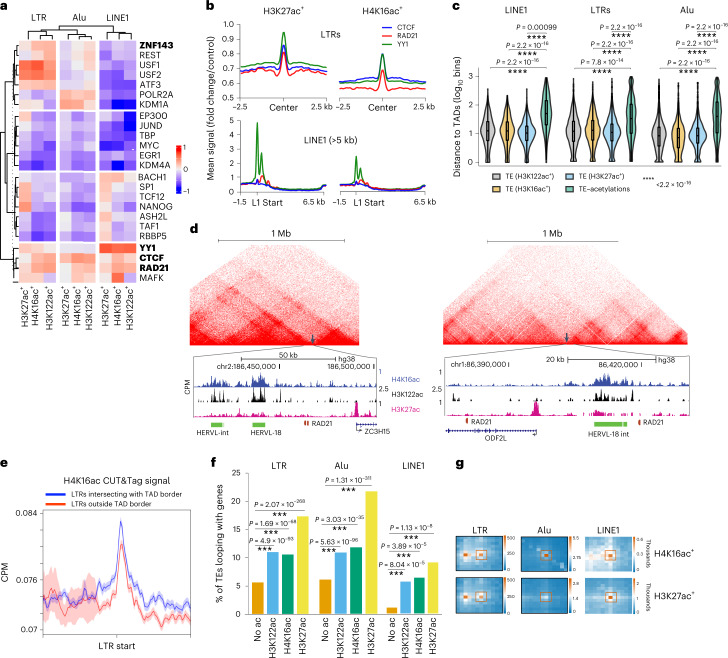
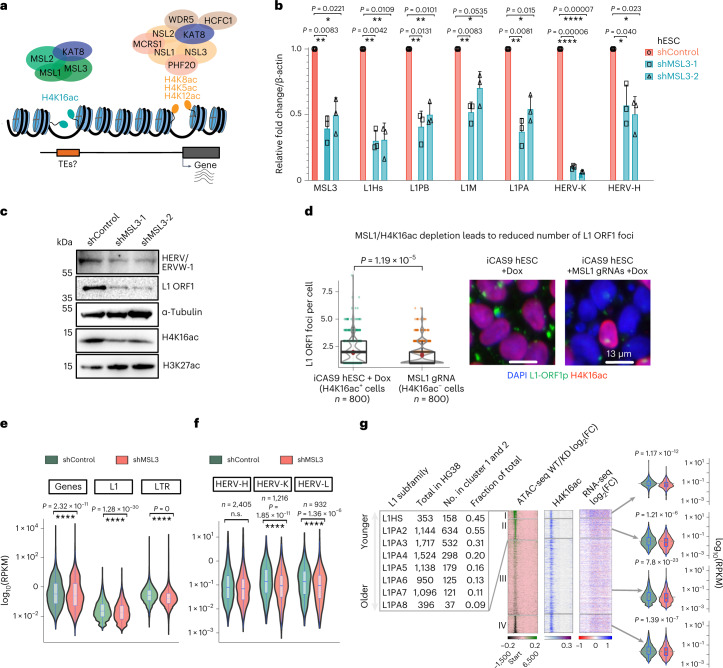
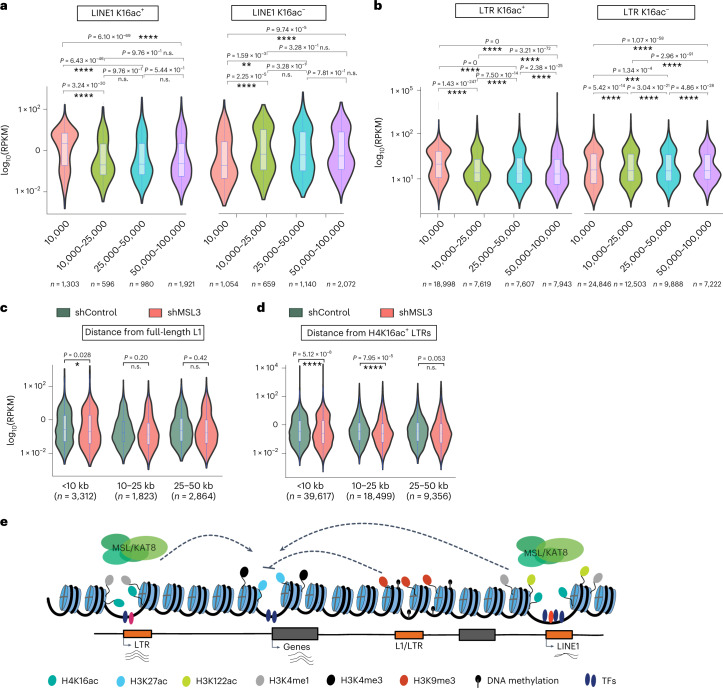
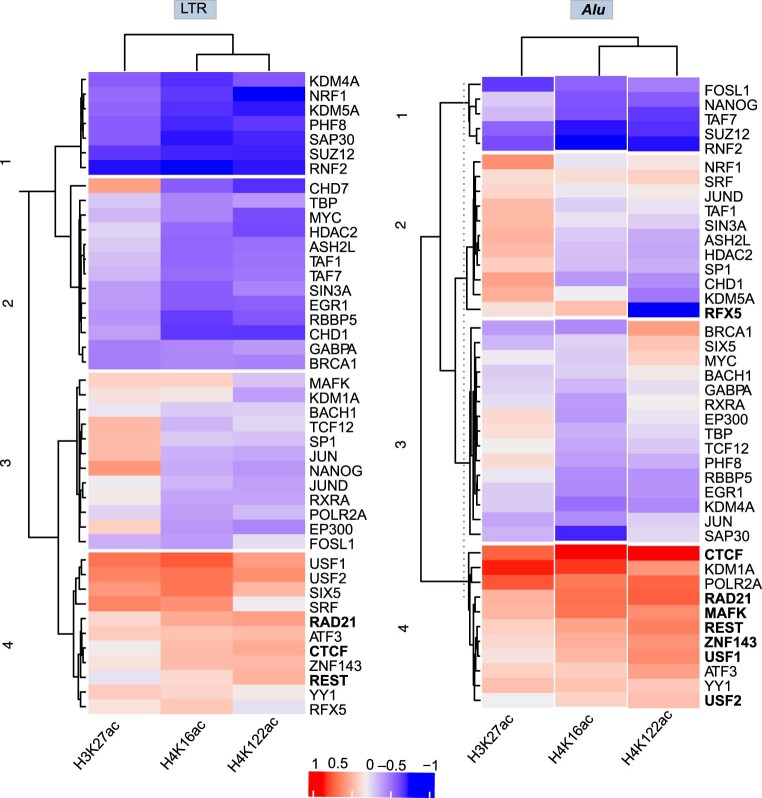
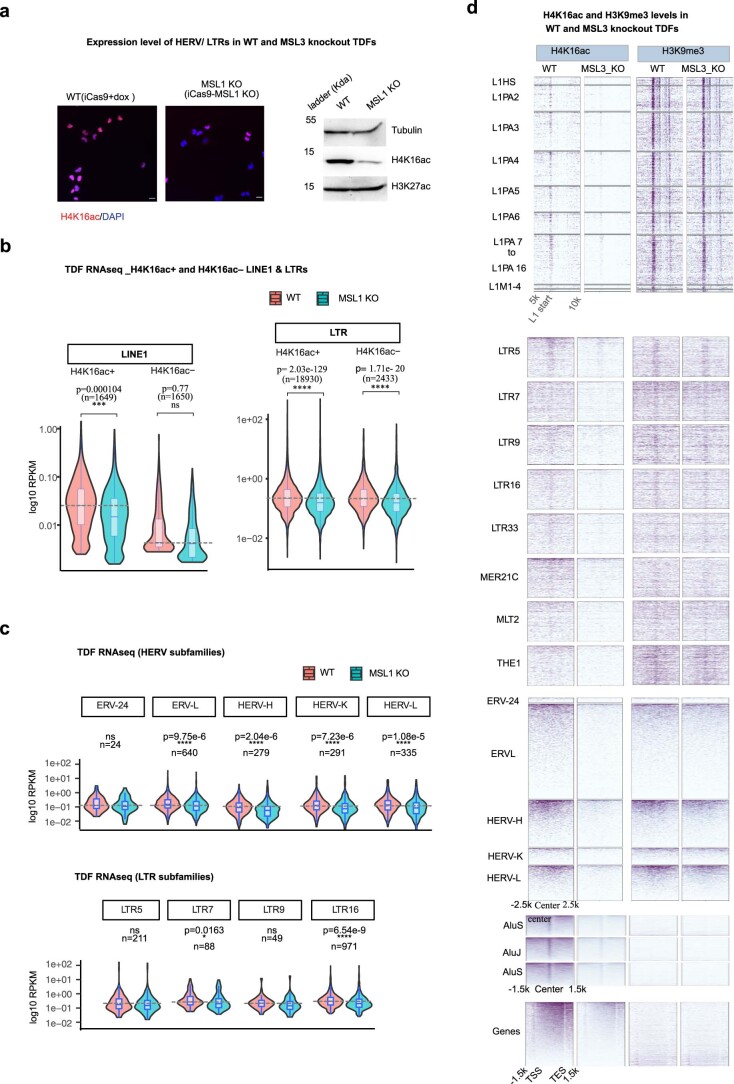
Mammalian genomes harbor abundant transposable elements (TEs) and their remnants, with numerous epigenetic repression mechanisms enacted to silence TE transcription. However, TEs are upregulated during early development, neuronal lineage, and cancers, although the epigenetic factors contributing to the transcription of TEs have yet to be fully elucidated. Here, we demonstrate that the male-specific lethal (MSL)-complex-mediated histone H4 acetylation at lysine 16 (H4K16ac) is enriched at TEs in human embryonic stem cells (hESCs) and cancer cells. This in turn activates transcription of subsets of full-length long interspersed nuclear elements (LINE1s, L1s) and endogenous retrovirus (ERV) long terminal repeats (LTRs). Furthermore, we show that the H4K16ac-marked L1 and LTR subfamilies display enhancer-like functions and are enriched in genomic locations with chromatin features associated with active enhancers. Importantly, such regions often reside at boundaries of topologically associated domains and loop with genes. CRISPR-based epigenetic perturbation and genetic deletion of L1s reveal that H4K16ac-marked L1s and LTRs regulate the expression of genes in cis. Overall, TEs enriched with H4K16ac contribute to the cis-regulatory landscape at specific genomic locations by maintaining an active chromatin landscape at TEs.


Conflict of interest statement

The authors declare no competing interests.

Figures

Fig. 1
Fig. 1. H4K16ac and H3K122ac are enriched at the 5′ UTR of L1 and ERV/LTRs in hESCs.
a, Bar chart showing the percentage distribution (y axis) of histone PTMs CUT&Tag peaks across ChromHMM chromatin features. Low signal (Lo), transcription (Txn) b, Dot plot showing the ratio (observed/expected) of enrichment of CUT&Tag peaks across gene transcription start sites, TE families (L1, ERVLTRs, SINE/Alu-Alu family of short interspersed nuclear elements) and the gene body. The circle size represents the log2 value for the ratio, and the color range represents the enrichment ratio. c, Percentage distribution of repeat elements: Alu, ERV_classI & ERV_classII (endogenous retrovirus class I & II), ERVL_MaLRs (endogenous retrovirus type-L mammalian apparent retrotransposon, hAT_Charlie (member of hAT superfamily of DNA transposon), L3/CR1 (long interspersed nuclear elements 3/chicken repeat1), LINE1, LINE2 (long interspersed nuclear elements 2), MIRs (mammalian inverted repeats) and TcMar-Tigger (TcMar-Tigger DNA transposon, Tigger2 subfamily) for CUT&Tag peaks. d, Illustration showing the structure of human L1s (above), two open reading frames (ORF1 and ORF2), along with endonuclease (EN), reverse transcriptase (RT) and carboxyl terminal segment (C) within the ORF2 are shown. Heatmap displaying the histone modification CUT&Tag signal (counts per million, CPM) at 10,538 (n) full-length L1s (>5 kb, left) and NCBI Ref-seq genes (right); data for three replicates, R1, R2, and R3, are plotted separately. e, UCSC Genome Browser tracks (Hg38) showing signal density (CPM) of histone modifications (individual replicates) at L1PA10, a representative L1 subfamily, (left) and the L1PA4, ERV1, and USP38 genes (right).
Fig. 2
Fig. 2. H4K16ac+ TEs are enriched with chromatin features associated with enhancer activity.
a, Heatmap of CUT&Tag signals for histone modifications and BRD4 (n = 2 or 3 biological replicates), normalized to IgG and ATAC-seq signal at TE subfamilies; –1.5 kb to +6.5 kb from the full-length L1 start sites (>5 kb). b, Heatmap showing H4K16ac and H3K27ac CUT&Tag and STARR-seq signal, normalized to input, in K562 and SH-SY5Y cells. c, Like a, but for ±2.5 kb around the ERV/LTR center for subfamilies of LTR5, LTR7, LTR9, LTR16 and LTR33. The number of LTRs in each subfamily are shown below. Data for the Alu subfamily and the rest of the LTR subfamilies are in Extended Data Figure 5. d, Genome browser tracks (Hg38) showing the average (n = 2 or 3 biological replicates) CPM for two replicates of H4K16ac, H3K122ac, H3K27ac, H3K4me1 and H3K4me3 CUT&Tag data from hESCs. RepeatMasker tracks showing L1 (L1PA7, top), LTR5, LTR16 and LTR33 (bottom), and ENCODE-layered H3K27ac and CREs are shown below each panel. e, Violin plots showing STARR-seq signal from K562 cells (n = 2 biological replicates, signal normalized to input) across LTRs intersecting H3K4me1 peaks; H4K16ac but not H3K4me1 peaks; H3K4me1 and H4K16ac peaks; and H3K4me1 and both H3K27ac and H4K16ac peaks. f, Like e, but for SH-SY5Y cells (n = 2 biological replicates, signal normalized to control) across LTRs that intersect with no H4K16ac or H3K27ac peaks (n = 40,000 LTRs); H3K27ac but not H4K16ac peaks (n = 22,447 LTRs); H4K16ac but not H3K27ac peaks (n = 35,349 LTRs); and H4K16ac and H3K27ac peaks (n = 15,602 LTRs). In all box plots, center lines indicate the median, bounds indicate the 25th and 75th percentiles, and whisker limits show 1.5 × interquartile range; P values for all the violin and box plots were calculated using the pairwise two-sided multi-comparison Dunn test for post hoc testing, following the Kruskal–Wallis test with Bonferroni correction.
Fig. 3
Fig. 3. H4K16ac+ L1 and LTRs are enriched at TAD borders and loops with genes.
a, Heatmap shows the difference/sum (details in Methods) ratio for observed and expected occurrences of TF-binding sites in H4K16ac, H3K27ac and H3K122ac peaks at the 5′ UTR of L1, ERV/LTR or SINE/Alu, over the random background. Looping factors that are known to be enriched at enhancer-promoter loops are in bold; a complete list of TFs is in Extended Data Figure 6. b, Average type summary plots showing the mean signal distribution (fold change/control) of YY1 (green), RAD21 (red), and CTCF (blue) at LTRs (top) and full-length L1 (>5 kb, bottom) that overlaps with H3K27ac (left) or H4K16ac (right). c, Violin plot showing the distance to TAD borders (y axis, log10 bins) for LTR (H4K16ac+ #10258, H3K27ac+ #8063, H3K122ac+ #17132), Alu element (H4K16ac+ #7394, H3K27ac+ #4659, H3K122ac+ #61312) and L1 (H4K16ac+ #892, H3K27ac+ #550, H3K122ac+ #1439) marked with H3K27ac, H4K16ac or H3K122ac, and for TEs that lack these marks (LTR #31678, Alu #31589 and L1 #452). P values for the violin plots were calculated by Mann–Whitney U test. d, Example UCSC Genome Browser tracks showing H4K16ac, H3K122ac and H3K27ac signals at TAD borders (arrow marks) (micro-C data from H9 hESC). CRISPRi was used for some of these HERV/LTRs for validation (Fig. 4d). e, Average type summary plot depicting IgG-normalized H4K16ac signal (CPM), with standard error (shaded area), at the LTRs overlapping the TAD border (blue) and LTRs elsewhere in the genome (red). f, Bar graph showing the percentage of H4K16ac+, H3K27ac+ and H3K122ac+ TEs and TEs that lack these marks (full-length L1, LTR and Alu) that contact genes through chromatin loops (P values were calculated by Fisher’s exact test). (# same as in c). g, Aggregate peak analysis (APA) plots for H4K16ac+ and H3K27ac+ LTRs, Alu elements, and L1s that contact genes through loops. The number of contacts (in thousands) are shown in the scale bars. In all box plots, center lines indicate the median, bounds indicate the 25th and 75th percentiles, and whisker limits show 1.5 × interquartile range. Source data
Fig. 4
Fig. 4. H4K16ac+ L1 5′ UTRs function as enhancers to regulate genes in cis.
a, Illustration showing CRISPRi and CRISPR-mediated deletion strategy for TEs. Genes that show looping interaction (in RAD21-HiChIP data) and that are expressed in hESCs were chosen as putative targets for RT–qPCR, and other nearby expressed genes were chosen as controls. b,c, Genome browser tracks showing H4K16ac and H3K27ac CUT&Tag data (CPM) at LTR7/HERV-H-int and LTR/ERV1 loci and their putative target genes. d, RT–qPCR data showing relative fold change (normalized to ACTB) in the expression of putative target genes NUS1 and PEX1 upon CRISPRi for HERV/LTRs, but not other nearby genes (GOPC and GATAD1). ei. Like b and c, the genome browser track shows CUT&Tag data at L1PA10 at the TANC2 locus, L1PA7 at the COMMD10 locus, L1PA7 at the MOXD1 locus, L1PA10 and L1PA7 at the USP38 locus, and L1PA7 at the RLN2 locus. L1PA2 and L1MA27 at the USP38 locus, which lack histone acetylation marks, were used as controls. j, Same as d, but for H4K16ac+ or H4K16ac putative target genes for L1s (L1PA2 and L1MA2). TANC2, COMMD10, MOXD1, STX7, and USP38 were selected as putative target genes, along with CYB561, SEMA10A, ENPP1, GAB1, and SMARCA5 were selected as putative non-targets. k, Same as j, but RT–qPCR was done upon CRISPR–CAS9-mediated deletion of full-length L1. Two independent clones for L1PA10 (H4K16ac+) and one for L1PA7 (H4K16ac+), L1PA2 (H4K16ac) and L1MA2 (H4K16ac) located at the upstream of USP38 were tested, and for L1PA7 located at MOXD1 and RLN2, the pools of cells were tested. For all RT–qPCR experiments, data are shown as mean ± s.d. from n = 3 independent experiments; P values are from unpaired t-test with Welch correction; the two-stage step-up (Benjamini, Krieger and Yekutieli) method was used, and the false-discovery rate (FDR) was 1.00% for multiple comparisons. n.s., not significant. Source data
Fig. 5
Fig. 5. MSL activates transcription of TEs.
a, Illustration showing that KAT8 catalyzes H4K16ac only when bound to the MSL complex, not the NSL complex. b, RT–qPCR data from hESCs showing mean fold change (normalized to β-actin) in MSL3, L1 and HERV subfamilies upon lentiviral shRNA-mediated KD of MSL3 using two independent shRNAs, versus hESCs transfected with a non-targeted control shRNA. Data are shown as mean ± s.d. from n = 3 independent experiments; P values were calculated using an unpaired t-test with Welch correction; the two-stage step-up (Benjamini, Krieger and Yekutieli) method was used, and the FDR was 1% for multiple comparisons. c, Western blots showing HERV, L1-ORF1, and H4K16ac levels after shRNA-mediated knockdown of MSL3 described in b; α-tubulin and H3K27ac served as controls in control and MSL3-KD hESCs (data are representative of n = 2 independent experiments; uncropped images are in Supplementary Data Fig. 1). d, Representative images (right) and quantification of high-content (automated microscopy) imaging data (left) showing the number of L1 ORF1p foci per cell in H4K16ac+ and H4K16ac MSL1-KO cells. Eight hundred cells per condition were analyzed in two wells. Data are representative of n = 2 independent experiments; P values were calculated using Welch’s t-test with 95% confidence interval. Scale bar, 13 µm. e, Violin plots showing RNA-seq for genes, full-length L1s, and LTRs for control and MSL3-KD hESCs (n = 4). f, RNA-seq signal at HERV subclasses HERV-K, HERV-H, and HERV-L. g, Left, heatmaps showing H4K16ac (CPM), ATAC-seq (CPM) and RNA-seq (log2(fold change)) for control/MSL3 KD in hESCs, n = 4) across full-length L1 with K-means clusters. The distribution of L1 subfamily members in clusters 1 and 2 is shown on the left; multi-mapped reads were retained for these heatmaps. Right, violin plots showing RNA-seq signal (log10(reads per kilobase of transcript, per million mapped reads, RPKM), control and MSL3-KD hESCs) at four L1 clusters. In all box plots, center lines indicate the median, bounds indicate the 25th and 75th percentiles and whisker limits show 1.5 × interquartile range. P values for all the violin and box plots were calculated using the pairwise two-sided multi-comparison Dunn test, used for post-hoc testing following the Kruskal–Wallis test, with Bonferroni correction. Source data
Fig. 6
Fig. 6. H4K16ac maintains an active chromatin landscape at TEs.
a, Violin plots showing the distance-dependent effect on the expression of genes from L1 with H4K16ac peaks (H4K16ac+) (left). Genes close to L1 that lack detectable H4K16ac peaks (H4K16ac) are in TDF cells (right). X–axis shows the distance from the TEs. b, Like a, but for LTRs. c, hESC RNA-seq signals for control (shControl) and MSL3 knockdown (shMSL3) at genes that lie 10 kb, 10–25 kb, or 25–50 kb away from the H4K16ac-overlapping full-length L1s. d, Like c, RNA-seq signals at genes that lie in 10 kb, 10–25 kb or 25–50 kb away from the H4K16ac-overlapping LTRs. e, The working model shows MSL/KAT8-mediated H4K16ac maintains accessible chromatin, activates transcription at TEs, and contributes to their enhancer activity to regulate genes in cis. In all box plots, center lines indicate the median, bounds indicate the 25th and 75th percentiles, and whisker limits show 1.5 × interquartile range. P values for all the violin and box plots were calculated using the pairwise two-sided multi-comparison Dunn test, used for post hoc testing following the Kruskal–Wallis test with Bonferroni correction.
Extended Data Fig. 1
Extended Data Fig. 1. Related to Fig. 1. CUT&Tag data correlation data and overlap of histone modification peaks and at LINE1.
a. Pearson correlation heatmap for the CUT&Tag replicates across histone modifications in H9 cells. b. Upset plot showing the intersection of CUT&Tag peaks at TE (LTR, Alu and full-length L1) families. The X-axis shows the total number of peaks, and the Y-axis is the number of peaks intersected. c. Heatmaps showing signals (CPM) for the H3K9me3, H4K16ac, H3K27ac and H3K122ac at the full-length L1s marked by either H3K9me3 (top of each heatmap) or H4K16ac (bottom of each heatmap).
Extended Data Fig. 2
Extended Data Fig. 2. Related to Fig. 1, Overlap of CUT&Tag data peaks from replicates.
Venn diagrams showing reproducibility for the CUT&Tag peaks among the replicates called for the Histone PTMs.
Extended Data Fig. 3
Extended Data Fig. 3. Related to Figs. 1 and 2. H4K16ac is enriched at TEs in human brain, cancer and mouse stem cells.
a. Heatmap showing H4K16ac ChIPseq signal across full-length L1s in the human brain (prefrontal lobe) tissues from young, old and Alzheimer’s patients from Nativio et al. 2018. b. Heatmap showing two replicates of H4K16ac and H3K27ac CUT&Tag signal across RefSeq genes (left) and full-length L1s (>5 kb) from the mouse genome. c. Stacked bar plot showing ratio (Y-axis) of observed over expected (background) for the TSS, gene body and TEs (LTR, Alu and L1) overlapping with H4K16ac or H3K27ac (X-axis) in SHSY-5Y, K562 and TDF cells. d and e. Observed over expected enrichment ratio for H4K16ac and H3K27ac mouse embryonic stem cells (E 14 mESCs) CUT&Tag peaks at transposable elements from mouse genome (from Repbase).
Extended Data Fig. 4
Extended Data Fig. 4. Related to Fig. 2. a STARRseq and histone mark.
Related to Fig. 2. a. Frequency distribution of LTR elements (Y-axis, log 10 percentage) showing the STARR-seq signal enrichment (X-axis) that are H3K27ac–/H4K16ac+, H3K227ac+/H4K16ac+, H3K227ac+/H4K16ac– or H3K227ac–/H4K16ac–.b. Heatmaps showing signals (CPM) for the H4K16ac, H4K12ac, H3K27ac and H3K122ac, H3K4me1, H3K9me3 and ATACseq at the LTR subfamilies and Alu subfamilies.
Extended Data Fig. 5
Extended Data Fig. 5. Related to Fig. 3. Continuation of Fig. 3.
Like Fig. 3a, transcription factor binding sites enriched at the H3K27ac, H4K16ac and H3K122ac marked LTR and Alu in hESCs.
Extended Data Fig. 6
Extended Data Fig. 6. Related to Fig. 4. CRISPR CAS9 mediated deletion of L1 elements.
a) Illustration showing the Full length LINE1 (L1, ~7 kb), guideRNAs sites for CAS9 cutting (scissors), and the flanking primers (green arrow) and internal reverse primer (orange arrow) used for genotyping. b) Agarose gel electrophoresis showing PCR products for L1PA10 and L1PA7 clones, amplified using L1 flanking primers. ~500 bp amplification showing deletion of L1 (above). PCR with internal reverse primers showing presence of wild type allele (below). c) PCR amplicons with L1 flanking primers for pool of cells showing nearly 50% deletion efficiency for L1PA7 at the RLN2 locus and L1PA8 at the MOXD1 locus.
Extended Data Fig. 7
Extended Data Fig. 7. Related to Fig. 5. Depletion of MSL proteins leads to downregulation of TEs.
a. Immunofluorescence images showing H4K16ac levels (Magenta) in WT and MSL1 KO TDFs (left). Western blots showing H4K16ac level in MSL1 KO and WT TDFs (Right). b. Violin plots showing the log10 RPKM signal of RNAseq reads for parental (WT) and doxycycline-inducible MSL1 (MSL1 KO) for L1s (left panel) and LTRs (right panel) that are either H4K16ac+ or H4K16ac. c. Violin plots for RNAseq signal across different ERV subfamilies (ERV24, ERVL, HERVK, HERVH and HERVL; top), and LTR subfamilies (LTR5, LTR7, LTR9 and LTR16; below). Statistical tests for all violin plots were performed as Dunn test with Bonferroni correction. d. Heatmap comparing the CUT&Tag signals for H4K16ac and H3K9me3 for WT and MSL1 KO samples across L1 subfamilies, LTRs and ERV subfamilies, Alu subfamilies and NCBI refseq genes. Source data
Extended Data Fig. 8
Extended Data Fig. 8. Related to Fig. 5, MSL3 depletion data.
a. IGV browser tracks showing RNAseq reads (RPKM) at MSL1, MSL2, MSL3 and KAT8 locus in control knockdown (nontargeting shRNA) and MSL3 knockdown (n = 4, biological replicates) H9 hESCs. b. Volcano plot showing up-and down-regulated genes upon lentiviral shRNA mediated knockdown of MSL3. Pluripotency-associated genes (for example, POU5F1, NANOG, SOX2) and genes expressed in neuronal differentiation (for example, PAX6, GFAP, NES, NEUROD1) are shown in arrow marks. c. Violin plots for the RNAseq signal (log10 RPKM) for the Control-shRNA and MSL3-shRNA knockdown inH9 hESCs for genes that contain H4K16ac peak (H4K16ac+) and genes that lack H4K16ac peaksor (H4K16ac–). d. Like C but for LTR subfamilies (ERV24, ERVL, LTR5, LTR7, LTR9 and LTR16; bottom panel).
Extended Data Fig. 9
Extended Data Fig. 9. H4K16ac is enriched at TEs in proliferative cells compared to senescent cells.
H4K16ac ChIPseq/input signal for L1 (left) and LTR (right) subfamilies in the proliferative and senescent IMR90 cell line.

References

    1. Hancks DC, Kazazian HH. Roles for retrotransposon insertions in human disease. Mob. DNA. 2016;7:9. - PMC - PubMed
    1. Burns KH. Transposable elements in cancer. Nat. Rev. Cancer. 2017;17:415–424. - PubMed
    1. Molaro A, Malik HS. Hide and seek: how chromatin-based pathways silence retroelements in the mammalian germline. Curr. Opin. Genet. Dev. 2016;37:51–58. - PMC - PubMed
    1. Almeida, M. V., Vernaz, G., Putman, A. L. K. & Miska, E. A. Taming transposable elements in vertebrates: from epigenetic silencing to domestication. Trends Genet. 38, 529–553 (2022). - PubMed
    1. Karimi MM, et al. DNA methylation and SETDB1/H3K9me3 regulate predominantly distinct sets of genes, retroelements, and chimeric transcripts in mescs. Cell Stem Cell. 2011;8:676–687. - PMC - PubMed

Publication types