. 2023 Jul;26(7):1295-1307.
doi: 10.1038/s41593-023-01357-w. Epub 2023 Jun 12.

A rapid and bidirectional reporter of neural activity reveals neural correlates of social behaviors in Drosophila

Affiliations

A rapid and bidirectional reporter of neural activity reveals neural correlates of social behaviors in Drosophila

Moise Bonheur et al. Nat Neurosci. 2023 Jul.

Abstract

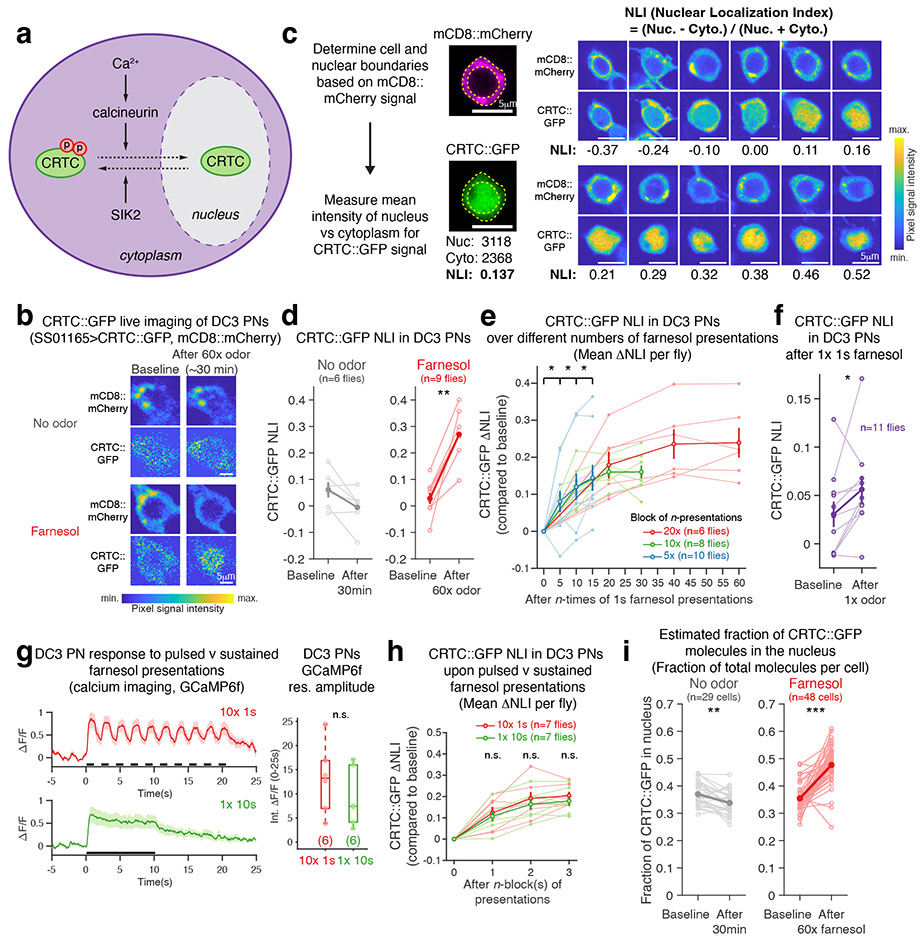
Neural activity is modulated over different timescales encompassing subseconds to hours, reflecting changes in external environment, internal state and behavior. Using Drosophila as a model, we developed a rapid and bidirectional reporter that provides a cellular readout of recent neural activity. This reporter uses nuclear versus cytoplasmic distribution of CREB-regulated transcriptional co-activator (CRTC). Subcellular distribution of GFP-tagged CRTC (CRTC::GFP) bidirectionally changes on the order of minutes and reflects both increases and decreases in neural activity. We established an automated machine-learning-based routine for efficient quantification of reporter signal. Using this reporter, we demonstrate mating-evoked activation and inactivation of modulatory neurons. We further investigated the functional role of the master courtship regulator gene fruitless (fru) and show that fru is necessary to ensure activation of male arousal neurons by female cues. Together, our results establish CRTC::GFP as a bidirectional reporter of recent neural activity suitable for examining neural correlates in behavioral contexts.


Conflict of interest statement

DECLARATION OF INTERESTS

The authors declare no competing interests.

Figures

Extended Data Fig. 1:
Extended Data Fig. 1:. Translocation of CRTC::GFP in DC3 PNs.
(a) ΔF/F0 traces from GCaMP calcium imaging experiments of DC3 projection neurons (PNs). Stimulus period is indicated by black line. Sample number represents the number of cell bodies imaged and number of flies in parenthesis. Lines indicate mean and shadings indicate SEM. (b) Changes in CRTC::GFP nuclear signals (NLI) in DC3 PNs in different conditions for Fig. 1d. Thin lines represent individual flies (averaged across cells) and thick lines indicate mean ± SEM across flies. (c) and (d) Changes in CRTC::GFP nuclear signals (NLI) in DC3 PNs in different conditions for Fig. 1e and Fig. 1h. Thin lines represent individual flies (averaged across cells) and thick lines indicate mean ± SEM across flies. ΔNLI in Fig. 1e, h was calculated for each cell by subtracting baseline NLI and averaged across cells per fly. (e) Estimated fraction of CRTC::GFP molecules in the nucleus for different NLIs in cells with different relative nuclear radii. The range of relative nuclear radii was determined to be 0.55 to 0.85 based on the cell and nuclear ROIs determined for 10,338 neurons of different cell types that were immunostained and imaged using confocal microscopy (0.71±0.09; mean ± SD). For DC3 live imaging, mean relative nuclear radius is calculated based on images obtained using 2-photon microscope (0.70±0.06; mean ± SD).
Extended Data Fig. 2:
Extended Data Fig. 2:. Subcellular distribution of CRTC::GFP provides a readout for neural activity in free moving flies.
(a) NLI of CRTC::GFP signal in PAM-γ4 for thermogenetic activation experiments. Individual fly data for Fig. 2b. Lighter color dots are individual cells and darker color dots are mean of each fly. Boxplot; median (horizontal line), first and third quartiles (box), and data within 1.5x IQR (whiskers). (b) Confocal images of brains immunostained with anti-calcineurin-β antibody (see Methods). Maximum intensity projection images of slices that encompass antennal lobe to mushroom body lobes are shown. A pan-neuronal driver (c155, elav) was used to express shRNA targeting GFP (control, left) or CanB/B2 (right). Immunostaining for both control and experimental brains was performed in the same wells and the same imaging parameters were used for all brains. Representative images from 3 experiments (N=12 for GFP, N=12 for CanB/B2) are shown. (c) NLI of CRTC::GFP signal in the MBON-α'3 (labeled by VT037580-GAL4) in the presence of RNAi-mediated knockdown of calcineurin B and B2 (CanB/B2). Each dot represents mean NLI across cells per fly. Boxplot; median (horizontal line), first and third quartiles (box), and data within 1.5x IQR (whiskers). Statistics by two-sided Wilcoxon rank sum test; *** p<0.001. (d) NLI of CRTC::GFP signal in MBON-α'3 for thermogenetic activation experiments. Individual fly data for Fig. 2d. Lighter color dots are individual cells and darker color dots are mean of each fly. Boxplot; median (horizontal line), first and third quartiles (box), and data within 1.5x IQR (whiskers). (e) Thermogenetic activation experiments for MBON-α'3 using GFP instead of CRTC::GFP. Each dot represents mean NLI across cells per fly. Boxplot; median (horizontal line), first and third quartiles (box), and data within 1.5x IQR (whiskers). Kruskal-Wallis test followed by a post hoc Tukey’s HSD test; p=0.002 for comparisons between dTRPA1+, 32°C and dTRPA1−, 25°C. (f) NLI of CRTC::GFP signal in P1a neurons of male flies in different rearing conditions. Individual fly data for Fig. 2f. Lighter color dots are individual cells and darker color dots are mean of each fly. Boxplot; median (horizontal line), first and third quartiles (box), and data within 1.5x IQR (whiskers). (g) NLI of CRTC::GFP signal in P1a neurons of male flies in different rearing conditions. Subject flies were housed singly for 2 days upon eclosion and were housed for 1 day with males or females, or were left single-housed (“solo”). Each dot represents mean NLI across cells per fly. Boxplot; median (horizontal line), first and third quartiles (box), and data within 1.5x IQR (whiskers). Statistics by Kruskal-Wallis test followed by a post hoc Tukey’s HSD test; * p<0.05.
Extended Data Fig. 3:
Extended Data Fig. 3:. Evaluation of network performance.
(a) Performance evaluation for trained U-net, MobileNet-v2, ResNet-18, and Xception. (b) Eleven examples of pixel classification by trained ResNet-50 (UbwonkoNet) and trained Unet. The cells in the 4th and 8th rows show examples where U-Net failed to selectively “focus” on the cell body of interest. Examples include those shown in Fig. 4c. (c) Comparison of experimental results obtained using UbwonkoNet-determined NLIs vs manually-determined NLIs. A subset of data from the P1a experiments described in Fig. 7 (ad libitum fed group) were manually quantified (purple) and compared to the results obtained by UbwonkoNet (green). The left two columns are the same as the first and the third column of Fig. 7b. Boxplot; median (horizontal line), first and third quartiles (box), and data within 1.5x IQR (whiskers). Statistics by Kruskal-Wallis test followed by a post hoc Tukey’s HSD test; *** p<0.001.
Extended Data Fig. 4:
Extended Data Fig. 4:. Neuronal expression of CRTC::GFP does not significantly affect male mating and courtship behaviors.
(a) Fertility of flies expressing GFP, CRTC::GFP, or EGFP::Kir2.1 in corazonin neurons. N=25 each. Statistics by Fisher’s exact test and Bonferroni correction; *** p<0.001. (b) Behavior observation chamber used to examine mating behaviors. (c) Left; ethograms of mating experiments. Males of indicated genotypes were paired with wild-type females in the behavior observation chamber. Middle; copulation duration in 2-hour observation period for fly pairs each consisting of a male of indicated genotype and a wild-type female. Boxplot; median (horizontal line), first and third quartiles (box), and data within 1.5x IQR (whiskers). Statistics by Kruskal-Wallis test followed by a post hoc Tukey’s HSD test; *** p<0.001. Right; latency to copulation initiation. Statistics by Kruskal-Wallis test followed by a post hoc Tukey’s HSD test; p>0.05. (d) Courtship and mating behaviors of male flies expressing CRTC::GFP pan-neuronally. Left; ethograms. Right; courtship index. Boxplot; median (horizontal line), first and third quartiles (box), and data within 1.5x IQR (whiskers). Statistics by two-sided Wilcoxon rank sum test; p>0.05. (e) Behavioral transitions during courtship behavior of male flies expressing CRTC::GFP panneuronally. Behaviors aligned to the onset (left) or offset (right) of licking (top) or attempted copulation (bottom). Line plots show fraction of epochs with specific behavior over time (thick lines) and shading indicates 95% confidence interval determined by bootstrapping. N=132 epochs for licking and N=112 epochs for attempted copulation for elav>GFP, N=167 and 132 for elav>CRTC::GFP.
Extended Data Fig. 5:
Extended Data Fig. 5:. Examination of P1a activity in fruitless mutant flies.
(a) Additional example flies for P1a calcium imaging. (b) P1a GCaMP response in contact epochs. Unsorted data for Fig. 6f. Calcium traces are shown only for the duration of each contact epoch, which varies from epoch to epoch. (c) Fraction of contact epochs in which P1a neurons become activated as determined with a different threshold from Fig. 6g. Activation epoch if at least 5 consecutive frames (appx. 0.28 sec) exhibit over 1.96 z-scored activity. Statistics by Fisher’s exact test. *** p<0.001, n.s. p>0.05.
Fig. 1:
Fig. 1:. Drosophila CRTC translocates into the nucleus upon odor-evoked neural activation.
(a) Schematic representation of CRTC translocation. (b) Representative 2-photon images of mCD8::mCherry and CRTC::GFP in DC3 cell bodies. Flies were exposed to three blocks of 20x farnesol presentations (see Methods). See Supplementary Table 1 for genotypes. (c) Quantification of nuclear localization index (NLI). Left; mCD8::mCherry is used to identify plasma and nuclear membranes (yellow dotted lines), which demarcate nucleus and cytoplasm. NLI is calculated by (mean nuclear GFP signal − mean cytoplasmic GFP signal) / (mean nuclear GFP signal + mean cytoplasmic GFP signal) and ranges from −1 to +1. Right; example images of cell bodies that exhibit different CRTC localization patterns with corresponding NLIs. Example cell images are single confocal slices of immunostained cell bodies. (d) Changes in NLI (ΔNLI) of DC3 PNs upon odor exposure. Thin lines; individual flies, thick lines; mean ± SEM. See Extended Data Fig. 1b. Statistics by two-sided Wilcoxon signed rank test; ** p<0.01. Statistics for all figure panels including exact p-values are in Supplementary Table 2. (e) ΔNLI of DC3 PNs upon different number of farnesol presentations. Farnesol was presented as blocks of 5x, 10x, or 20x 1s pulses with 5s inter-pulse intervals. Thin lines; individual flies, thick lines; mean ± SEM. See Extended Data Fig. 1c for raw NLIs for individual flies. Statistics by two-sided Wilcoxon signed rank test; * p<0.05. (f) ΔNLI of DC3 PNs upon 1x 1s farnesol presentation. Thin lines; individual flies, thick lines; mean ± SEM. Statistics by two-sided Wilcoxon signed rank test; * p<0.05. (g) Left; ΔF/F0 traces from GCaMP calcium imaging experiments of DC3 PNs in response to pulsed vs sustained farnesol presentations. Stimulus period is indicated by black line. Lines; mean, shadings; SEM. Right; integrated ΔF/F0. Statistics by two-sided Wilcoxon rank sum test; n.s. p>0.05. (h) ΔNLI of DC3 PNs in response to pulsed vs sustained farnesol presentations. Thin lines; individual flies, thick lines; mean ± SEM. See Extended Data Fig. 1d for raw NLIs for individual flies. Statistics by two-sided Wilcoxon rank sum test; n.s. p>0.05. (i) Estimated fractions of CRTC::GFP molecules in the nucleus per cell body. Molecular fractions are calculated based on NLIs observed for baseline and after three blocks of farnesol presentations with relative nuclear radius of 0.7. Thin lines; individual cells, thick lines; mean ± SEM. See Extended Data Fig. 1e and Methods. Statistics by two-sided Wilcoxon signed rank test; ** p<0.01, *** p<0.001.
Fig. 2:
Fig. 2:. Subcellular distribution of CRTC::GFP provides a readout for neural activity in free moving flies.
(a) Example confocal images of PAM-γ4 from thermogenetic activation experiments. Left; morphology of PAM-γ4. Dotted areas contain cell bodies. In merged image, green; CRTC::GFP, magenta; mCD8::mCherry. Right; representative example images of single PAM-γ4 cell bodies in different conditions. Each image is a confocal slice and mCD8::mCherry (top) and CRTC::GFP (bottom) signals are shown. (b) Thermogenetic activation experiments for PAM-γ4. Left; mean cytoplasmic vs nuclear CRTC::GFP signal intensities for each cell. Right; mean CRTC::GFP NLI averaged across cells per fly. Each dot represents a fly (number of flies in parenthesis) and boxplot shows median (horizontal line), first and third quartiles (box), and data within 1.5x IQR (whiskers). See Extended Data Fig. 2a for individual fly data. Kruskal-Wallis test followed by a post hoc Tukey’s HSD test; *** p<0.001. (c) Left; morphology of MBON-α'3 with dotted area indicating cell bodies. Right; representative confocal slice images of MBON-α'3 from thermogenetic activation experiments. Dotted outlines in CRTC::GFP images indicate plasma membrane of each cell determined in mCD8::mCherry images. (d) Thermogenetic activation experiments for MBON-α'3. Experimental flies were incubated at 25°C or 32°C for one hour before brain dissection, fixation, and immunostaining. Left; mean cytoplasmic vs nuclear CRTC::GFP signal intensities for each cell. Right; mean CRTC::GFP NLI averaged across cells per fly. Boxplot; median (horizontal line), first and third quartiles (box), and data within 1.5x IQR (whiskers). See Extended Data Fig. 2d for individual fly data and Extended Data Fig. 2e for GFP only controls. Kruskal-Wallis test followed by a post hoc Tukey’s HSD test; *** p<0.001. (e) Example confocal images of P1a neurons. Subject flies were paired for three days with males or females, or were left single-housed (“solo”). Left; morphology of P1a neurons with dotted areas indicating cell bodies. Right; representative confocal slice images of single P1a cell bodies in different conditions. (f) Effect of different rearing conditions upon CRTC::GFP localization in P1a neurons. Left; mean cytoplasmic vs nuclear CRTC::GFP signal intensities for each cell. Right; mean CRTC::GFP NLI averaged across cells per fly. Boxplot; median (horizontal line), first and third quartiles (box), and data within 1.5x IQR (whiskers). See Extended Data Fig. 2f for individual fly data and Extended Data Fig. 2g for data obtained with one day of social rearing conditions. Statistics by Kruskal-Wallis test followed by a post hoc Tukey’s HSD test; *** p<0.001.
Fig. 3:
Fig. 3:. Subcellular distribution of CRTC::GFP changes on the order of minutes and indicates both increases and decreases in neural activity.
(a) Time-course experiments that examine nuclear import kinetics of CRTC::GFP. Flies with or without dTRPA1 expression in the MBON-α'3 were incubated at 32°C for 0, 5, 15, 30, 60, or 120 min before dissection, fixation, and immunostaining. Lighter color dots; individual flies, darker color dots and thick lines; mean ± SEM. Statistics by two-sided Wilcoxon rank sum test, no adjustment for multiple comparisons; a denotes p<0.05 compared to dTRPA1+ baseline (0 min incubation), b denotes p<0.05 compared to dTRPA1− at each timepoint, and c denotes p=0.035 compared to dTRPA1− baseline (0 min incubation). N=9-20 for all timepoints except dTRPA1-60 and 120 min, for which N=5 each. (b) Time-course experiments that examine nuclear export kinetics of CRTC::GFP. Flies with or without dTRPA1 expression in MBON-α'3 were incubated at 32°C for 15 min then were incubated at room temperature (22-25°C) for 0, 5, 15, 30, or 60 min before dissection, fixation, and immunostaining. Data format same as (a). Statistics by two-sided Wilcoxon rank sum test, no adjustment for multiple comparisons; a denotes p<0.05 compared to dTRPA1+ baseline (no incubation at 32°C), and b denotes p<0.05 compared to dTRPA1− at each time point. N=11-19. (c) Time from odor onset vs ΔNLI in DC3 PNs. Data from Fig. 1e (the first block of 5x or 10x farnesol stimulations). Line; mean ± SEM for ΔNLIs of cells in each 40-second bin between 40-240s. Statistics by two-sided Wilcoxon signed rank test with Bonferroni correction; * p<0.05, *** p<0.001. (d) Genetic silencing experiments of MBON-α'3. Left; representative confocal images. Right; each dot represents mean NLI across cells per fly (number of flies in parenthesis). Boxplot; median (horizontal line), first and third quartiles (box), and data within 1.5x IQR (whiskers). Statistics by two-sided Wilcoxon rank sum test; *** p<0.001.
Fig. 4:
Fig. 4:. Automating pixel classification by deep convolutional neural network.
(a) Workflow for training different convolutional neural networks and evaluation of performance. Membrane (mCD8::mCherry) and nuclear (nls::LacZ) markers were expressed from a bicistronic transgene, UAS-mCD8::mCherry-T2A-nls::LacZ. Confocal slice images comprising membrane and nuclear signals (i.e., no CRTC::GFP signal) and their pixel classification based on manually-drawn ROIs were the input for training each network. Five different networks were trained using 95% (8,680) of cells and the performance of each network was evaluated for 5% (447) of held-out cells. Pixel classification for two example test cells are shown at the bottom. (b) Performance evaluation for trained ResNet-50. See Extended Data Fig. 3a for the other networks. Left; confusion matrix for pixel-level performance evaluation. Right; comparison of NLIs for CRTC::GFP signal determined manually vs by network. Each dot is a cell and the orange line is regression. P[fail] denotes percentage of cells that each network fails to assign both cytoplasm and nucleus. See also Supplementary Table 3 for other metrics of network performance. (c) Seven examples of pixel classification by trained ResNet-50 (UbwonkoNet). See Extended Data Fig. 3b for additional examples.
Fig. 5:
Fig. 5:. CRTC::GFP detects acute increases and decreases in neural activity upon mating.
(a) Morphology of corazonin neurons in abdominal ganglion. Dotted area contains cell bodies. (b) Subcellular distribution of CRTC::GFP in corazonin neurons in male flies that had just mated vs not mated (copulation duration, 17.5±3.1 min). Left; representative confocal slices of cell bodies. Right; NLI of CRTC::GFP signal in corazonin-expressing neurons of males that just mated vs unmated. Boxplot; median (horizontal line), first and third quartiles (box), and data within 1.5x IQR (whiskers). Cellular and nuclear boundaries were drawn manually using mCD8mCherry signals. Statistics by two-sided Wilcoxon rank sum test; *** p<0.001. (c) Performance of NLI as classifier of mating status evaluated by receiver-operator characteristic (ROC) analysis. (d) Time-course experiments that examine nuclear import and export upon onset and offset of mating. N=17 flies for unmated, 14 for 5 min after mating onset, 14 for immediately after mating offset, 16 for 15 min after mating offset, and 17 for 30 min after mating offset. Mating duration varied across flies; 18.3±4.3 min. Lighter color dots; individual flies, darker color dots and thick lines; mean ± SEM. UbwonkoNet was used to determine nuclear vs cytoplasmic regions-of-interest for these experiments. Statistics by two-sided Wilcoxon rank sum test, no adjustment for multiple comparisons; a denotes p<0.05 compared to unmated and b denotes p<0.05 compared to immediately after mating offset. (e) CaLexA signals in corazonin neurons upon mating. Boxplot; median (horizontal line), first and third quartiles (box), and data within 1.5x IQR (whiskers). Statistics by Kruskal-Wallis test followed by a post hoc Tukey’s HSD test; ** p<0.01. (f) NLI of CRTC::GFP signal in two dopaminergic neuron types in males that just mated vs unmated. Boxplot; median (horizontal line), first and third quartiles (box), and data within 1.5x IQR (whiskers). Statistics by two-sided Wilcoxon rank sum test; ** p<0.01.
Fig. 6:
Fig. 6:. Examination of the activity of P1a neurons in fruitless mutants.
(a) Representative confocal slice images of P1a neuron cell bodies in control vs fru mutant males in different social conditions. Flies were reared singly for 3 days upon eclosion and then paired with indicated partners for an additional 3-day period. (b) NLI of CRTC::GFP signal in P1a neurons of control vs fru mutant males in different conditions. Each dot represents mean NLI across cells per fly. Boxplot; median (horizontal line), first and third quartiles (box), and data within 1.5x IQR (whiskers). Statistics by Kruskal-Wallis test followed by a post hoc Tukey’s HSD test; *** p<0.001, ** p<0.01, * p<0.05, n.s. p>0.05. (c) Confocal images of P1a neurons expressing GCaMP in control and fru mutant males. Dotted area represents approximate plane for calcium imaging. Anti-Brp antibody was used to label neuropil. (d) Example side view images of flies during calcium imaging experiments. Contact epoch (shaded pink and blue boxes) is defined as time between the first video frame in which a foreleg of the subject fly contacts the stimulus fly and the last video frame that the subject is in contact with the stimulus. (e) Example P1a activity upon contact with female (pink) or male (blue) abdomen in control (green) or fru mutant (purple) males. Shaded areas denote contact epochs. Median fluorescence intensity is used as baseline for calculation of ΔF/F for this panel. See Extended Data Fig. 5a for additional example flies. (f) P1a activity in contact epochs. Time is relative to the initiation of contact with stimulus fly. Data are sorted by duration of contact epochs. Fluorescence intensity observed during one second prior to the contact initiation is used as the baseline for ΔF/F0 calculation. See Extended Data Fig. 5b for unsorted data per fly. For control, 7 flies, 303 female epochs, 188 male epochs; for fru mutant, 7 flies, 283 female epochs, 235 male epochs. (g) Fraction of contact epochs in which P1a neurons become activated. Activation epoch if mean z-scored activity through epoch is over 1.96. See Extended Data Fig. 5c for data with a different threshold. Statistics by Fisher’s exact test; *** p<0.001, * p<0.05, n.s. p>0.05. (h) Mean P1a response across all contact epochs. Each dot is a fly and represents averaged peak ΔF/F0 observed during each contact epoch for the fly. Statistics by two-sided Wilcoxon rank sum test between control and fru mutant and by two-sided Wilcoxon signed rank test between response to females vs males. ** p<0.01.
Fig. 7:
Fig. 7:. Examination of the activity of P1a neurons in food-deprived flies.
(a) Schematic of experiment. Male subject flies were reared either singly or grouped with females for 7 days then food-deprived for one day. (b) Effect of food-deprivation and social conditions on subcellular localization of CRTC::GFP in P1a neurons. Boxplot; median (horizontal line), first and third quartiles (box), and data within 1.5x IQR (whiskers). Statistics by Kruskal-Wallis test followed by a post hoc Tukey’s HSD test; *** p<0.001. (c) Effect of food-deprivation on male courtship behavior. Statistics by Fisher’s exact test; * p<0.05 (see Supplementary Table 2).

References

    1. DeNardo L & Luo L Genetic strategies to access activated neurons. Curr Opin Neurobiol 45, 121–129, doi:10.1016/j.conb.2017.05.014 (2017). - DOI - PMC - PubMed
    1. Greenberg ME & Ziff EB Stimulation of 3T3 cells induces transcription of the c-fos proto-oncogene. Nature 311, 433–438, doi:10.1038/311433a0 (1984). - DOI - PubMed
    1. Lyford GL et al. Arc, a growth factor and activity-regulated gene, encodes a novel cytoskeleton-associated protein that is enriched in neuronal dendrites. Neuron 14, 433–445, doi:10.1016/0896-6273(95)90299-6 (1995). - DOI - PubMed
    1. Fujita N et al. Visualization of neural activity in insect brains using a conserved immediate early gene, Hr38. Curr Biol 23, 2063–2070, doi:10.1016/j.cub.2013.08.051 (2013). - DOI - PubMed
    1. Barth AL, Gerkin RC & Dean KL Alteration of neuronal firing properties after in vivo experience in a FosGFP transgenic mouse. J Neurosci 24, 6466–6475, doi:10.1523/JNEUROSCI.4737-03.2004 (2004). - DOI - PMC - PubMed

Publication types

LinkOut - more resources