. 2023 Aug;24(8):1318-1330.
doi: 10.1038/s41590-023-01529-7. Epub 2023 Jun 12.

The GPCR-Gαs-PKA signaling axis promotes T cell dysfunction and cancer immunotherapy failure

Affiliations

The GPCR-Gαs-PKA signaling axis promotes T cell dysfunction and cancer immunotherapy failure

Victoria H Wu et al. Nat Immunol. 2023 Aug.

Abstract

Immune checkpoint blockade (ICB) targeting PD-1 and CTLA-4 has revolutionized cancer treatment. However, many cancers do not respond to ICB, prompting the search for additional strategies to achieve durable responses. G-protein-coupled receptors (GPCRs) are the most intensively studied drug targets but are underexplored in immuno-oncology. Here, we cross-integrated large singe-cell RNA-sequencing datasets from CD8+ T cells covering 19 distinct cancer types and identified an enrichment of Gαs-coupled GPCRs on exhausted CD8+ T cells. These include EP2, EP4, A2AR, β1AR and β2AR, all of which promote T cell dysfunction. We also developed transgenic mice expressing a chemogenetic CD8-restricted Gαs-DREADD to activate CD8-restricted Gαs signaling and show that a Gαs-PKA signaling axis promotes CD8+ T cell dysfunction and immunotherapy failure. These data indicate that Gαs-GPCRs are druggable immune checkpoints that might be targeted to enhance the response to ICB immunotherapies.


Conflict of interest statement

Competing interests

J.S.G. reports consulting fees from Domain Pharmaceuticals, Pangea Therapeutics and io9 and is founder of Kadima Pharmaceuticals, unrelated to the current study. R.B. is an employee and shareholder of CellChorus, Inc. J.C. is an employee and shareholder of Pfizer, Inc. V.H.W. is an employee and shareholder of Septerna, Inc. The other authors declare no competing interests.

Figures

Extended Data Fig. 1 |
Extended Data Fig. 1 |. Patient and cancer information for integration analysis of CD8 T cells.
a, Information about patients, cancer type, and dataset used in the singe-cell RNA-seq integration. b, Visualization of 217,953 CD8 T cells after integration from 30 singe-cell RNA-seq datasets. c, Statistical comparison of calculated dysfunction score from tumor-infiltrating populations of CD8s characterized from Fig. 1b. Each dot represents one cell from groups listed in Supplementary Table 1a. Naïve: lower bound=0.147, middle bound=0.229, upper bound=0.337, 25th percentile=0.228, 75th percentile=0.231. Proliferating: lower bound=0.372, middle bound=0.564, upper bound=0.790, 25th percentile=0.556, 75th percentile=0.571. Cytotoxic: lower bound=0.184, middle bound=0.290, upper bound=0.447, 25th percentile=0.288, 75th percentile=0.292. Effector Memory: lower bound=0.209, middle bound=0.304, upper bound=0.431, 25th percentile=0.303, 75th percentile=0.305. Exhausted: lower bound=0.361, middle bound=0.555, upper bound=0.800, 25th percentile=0.551, 75th percentile=0.559.
Extended Data Fig. 2 |
Extended Data Fig. 2 |. Effect of targeting the Gαs/PKA signaling pathway in CD8 T cells.
a, Upregulation of inhibitory receptors and decrease of IFNγ and TNF in chronically versus acutely simulated CD8 T cells. The average relative expression and s.e.m. are shown (n = 6 biologically independent samples). b, Significant decrease of IFNγ or TNF with Gαs agonists in chronically stimulated CD8 T cells. The average relative expression and s.e.m. are shown (n = 6 biologically independent samples). c, Significant decrease of Ki-67 and viability with Gαs agonists in chronically stimulated CD8 T cells. The average relative expression and s.e.m. are shown (n = 6 biologically independent samples). d, Representative flow cytometry plots showing expression of Tim-3 and PD-1 in chronically stimulated CD8 T cells after treatment with 1 μM PGE2 (P), 5 μM Dobutamine (D), or 5 μM CGS-21860 (C). e, Effect of CXCL10 on PGE2-mediated decrease in IFNγ and TNFα The average frequency and s.e.m. are shown (n = 3 per group). Statistical significance was determined by two-way ANOVA. Unless indicated otherwise, statistical significance was determined by two-tailed unpaired Student’s t-test.
Extended Data Fig. 3 |
Extended Data Fig. 3 |. Development of a CD8-restricted PKI transgenic mouse model.
a, Scheme illustrating the generation of CD8-PKI mice. b, Genotyping information for CD8-PKI mice. c, Confirmation of PKI expression in CD4 or CD8 T cells isolated from splenocytes of CD8-PKI mice and littermate controls after induction by doxycycline and tamoxifen. The average relative expression and s.e.m. are shown (n = 6 mice per group). d, Quantification of IFNγ and TNF inhibition by PGE2 in chronically stimulated CD8 T cells from CD8-PKI mice. The average relative expression and s.e.m. are shown (n = 3 biologically independent samples). Statistical significance was determined by two-way ANOVA.
Extended Data Fig. 4 |
Extended Data Fig. 4 |. Development of a CD8-restricted Gαs-DREADD transgenic mouse model.
a, Genotyping confirmation for CD8-GsD mice. Primers detecting the Gαs-DREADD, ROSA26, and E8i-Cre were used to confirm recombination by the Cre-recombinase. Information about primers and genotyping is listed in Supplementary Table 4. b, Effect of DCZ on circulating CD8, CD4, NK cells, and CD11b myeloid cells in the peripheral blood of CD8− GsD mice treated with tamoxifen and 5 doses of DCZ (n = 5 mice for -DCZ; n = 6 mice for +DCZ). c, Effect of DCZ on non-tamoxifen-treated CD8-GsD mice. Quantification of IFNγ and TNF and PD-1 and Tim-3 in non-tamoxifen-treated CD8 T cells treated with or without DCZ. The average frequency and s.e.m. are shown (n = 3 biologically independent samples). Statistical significance was determined by two-tailed unpaired Student’s t-test.
Extended Data Fig. 5 |
Extended Data Fig. 5 |. Effect of tamoxifen and DCZ on tumor growth.
Tumor growth curve of CD8-GsD littermate control mice implanted with 4MOSC1 tumors treated with or without tamoxifen or DCZ. Mice were given 3 doses of tamoxifen, and 5 × 10⁵ 4MOSC1 cells were implanted into the tongue. Where indicated, 0.01 mg/kg DCZ was administered daily starting one day after tumor implantation.
Extended Data Fig. 6 |
Extended Data Fig. 6 |. Anti-CTLA-4 response in CD8-GsD mice bearing 4MOSC1 tumors.
Tumor growth curve (left panel) and survival plot (right panel) of CD8-GsD mice implanted with 4MOSC1 tumors treated with anti-CTLA-4 with or without DCZ (n = 7 mice per group). Mice were given three doses of tamoxifen before orthotopic tumor implantation and treated with checkpoint inhibitors and DCZ as previously described. Statistical significance was determined by two-way ANOVA. Statistical significance of survival data was calculated by the log-rank test.
Extended Data Fig. 7 |
Extended Data Fig. 7 |. Effect of Gnas deletion CD8 T cells in mice bearing 4MOSC1 tumors.
a, Tumor growth curve (left panel) and quantification of endpoint tumor volume (right panel) of CD8-Gnas+/+ (n = 14 mice) and CD8− Gnas−/− mice ( = 12 mice) implanted with 4MOSC1 tumors. Mice were given 3 doses of tamoxifen prior to orthotopic tumor implantation. The average tumor volume and s.e.m. are shown. Statistical significance was determined by two-way ANOVA. b, Quantification of PD-1+TIGIT+ CD8 T cells in 4MOSC1 tumors and draining lymph nodes at endpoint. The average frequency and s.e.m. are shown (n = 5 mice per group). Statistical significance was determined by two-tailed unpaired Student’s t-test. c, Frequency of CD8+ T cells in 4MOSC1 tumors in CD8-Gnas KO mice versus littermate controls. The average frequency and s.e.m. are shown (n = 5 mice per group). Statistical significance was determined by two-tailed unpaired Student’s t-test.
Extended Data Fig. 8 |
Extended Data Fig. 8 |. Gating strategy for chronic stimulation and in vivo experiments.
a, For chronic stimulation experiments, lymphocytes were gated from forward scatter area (FSC-A) and side scatter area (SSC-A). Single cells were distinguished from doublet cells in forward scatter height (FSC-H) and forward scatter width (FSC-W), and then side scatter height (SSC-H) and side scatter width (SSC-W). Live CD8 cells were then gated. b, For in vivo experiments, lymphocytes were gated from forward scatter area (FSC-A) and side scatter area (SSC-A). Single cells were distinguished from doublet cells in forward scatter height (FSC-H) and forward scatter width (FSC-W), and then side scatter height (SSC-H) and side scatter width (SSC-W). Live CD45 cells were then gated. T cells were distinguished by NK1.1 negative, CD19 negative, and CD3 positive. CD8 T cells were then gated as CD4 negative.
Fig. 1 |
Fig. 1 |. Gαs–GPCR correlation with T cell dysfunction and terminally exhausted T cells.
a, Schematic of integrated analysis of 19 scRNA-seq datasets (N = 263 individuals, n = 217,953 CD8+ T cells). The full names of the different cancer types and their abbreviations are listed in the text and in Supplementary Table 1a. This figure was generated, in part, with BioRender.com. b, Integration of all CD8-expressing cells and the stratification into five different CD8+ T cell subtypes (n = 217,953 CD8+ T cells analyzed). c, Visualization of integrated CD8+ T cells using dimensionality reduction. d, The CD8+ T cell onco-GPCRome. The normalized average expression of 367 GPCR genes is shown, with blue representing lower and red representing higher expression. Genes are organized by receptor family and are aligned with annotated landmark genes from different CD8+ T cell subtypes. e, Visualization of landmark genes for terminally exhausted CD8+ T cells with the top five most highly expressed GPCRs in the terminally exhausted CD8+ T cell population. f, Schematic explaining the correlation analysis of GPCRs and G-protein genes with the T cell dysfunction score. This figure was generated, in part, with BioRender.com. g, Quantification of T cell dysfunction score across all subtypes of CD8+ T cells; N, naive; P, proliferating; C, cytotoxic; EM, effector memory; EX, exhausted. h, Spearman correlation of 119 GPCR genes with the T cell dysfunction score. Statistical P values were calculated and plotted from tumor-infiltrating CD8+ T cells from human melanoma (GSE120575). Blue dots indicate GPCRs with Spearman correlations of P < 0.01, and gray dots indicate GPCRs with Spearman correlations of P > 0.01. A full list of P values and Spearman correlation values is available in Supplementary Table 1d. i, The mean correlation values of GPCRs were calculated based on their G-protein coupling designation from IUPHAR. These values were then ranked and plotted and included Gαi, Gα12/13, Gαq/11 and Gαs G-protein couplings. j, Spearman correlation of 367 GPCR genes with the T cell dysfunction scores and the calculated statistical P values. Gαs-coupled GPCRs (primary coupling as designated by IUPHAR) were plotted. Blue dots indicate GPCRs with Spearman correlations of P < 0.01, and gray dots indicate GPCRs with Spearman correlations of P > 0.01.
Fig. 2 |
Fig. 2 |. Gαs coupling augments an exhaustion-like dysfunctional state in CD8+ T cells.
a, Schematic of curated RNA-seq datasets from different subtypes of T cells sorted from the LCMV model. b, Differential expression analysis of GPCRs not significantly (P > 0.05; gray) or significantly (P < 0.05) upregulated in effector (orange) versus exhausted (purple) CD8+ T cells from LCMV datasets. Statistical significance was determined by the Wald test as part of the DESeq analysis package. c, Gene set enrichment analysis showing normalized enrichment scores (NES) of GPCRs significantly upregulated in either effector or exhausted T cells. Statistical significance was calculated as part of the gene set enrichment analysis; see Supplementary Table 3c for P values; *P < 0.05; **P < 0.01. d, Gene set enrichment analysis mountain plots illustrating significant enrichment of gene sets from c; ES, enrichment score. e, Experimental scheme illustrating the in vitro chronic stimulation assay of CD8+ T cells. f, Representative plots showing the expression of IFNγ and TNF in chronically stimulated CD8+ T cells after treatment with Gαs agonists. Statistical significance was determined by two-tailed unpaired Student’s t-test comparing to control samples (see g); **P < 0.01; ****P < 0.0001. g, Quantification of IFNγ and TNF, granzyme B, Ki-67, PD-1 and TIM-3 in CD8+ T cells treated with Gαs agonists. The average frequency and s.e.m. are shown (n = 6 biologically independent samples); Ctrl, control; P, PGE2 (1 μM); D, dobutamine (5 μM); C, CGS-21680 (5 μM). h, Schematic illustrating the in vitro coculture tumor killing assay. i, Percent killing by OT-1 T cells in the presence or absence of Gαs agonists. The average frequency and s.e.m. are shown (n = 6 biologically independent samples). j, Representative bar plot showing the specificity of pCREB induction (j) and IFNγ and TNF (k) inhibition by PGE2 in the presence or absence of EP2i or EP4i inhibitor. The average frequency and s.e.m. are shown (n = 3 biologically independent samples). Statistical significance was determined by one-way analysis of variance (ANOVA). l, Schematic depicting the generation of CD8-Gnas KO mice. m, Quantification of IFNγ and TNF in CD8+ T cells from CD8-Gnas+/+ or CD8-Gnas KO mice. The average frequency and s.e.m. are shown (n = 6 biologically independent samples). Unless indicated otherwise, statistical significance was determined by two-way ANOVA. Images in a and h were generated, in part, with BioRender.com.
Fig. 3 |
Fig. 3 |. Mechanisms of immune suppression in CD8+ T cells uncovered by Gαs–DREADD.
a, Schematic illustrating the generation of CD8-GsD mice. b, Experimental scheme showing confirmation of expression and activation of CD8-specific Gαs–DREADD by tamoxifen and DCZ, respectively. c, Confirmation of Gαs–DREADD expression in CD4+ or CD8+ T cells purified from peripheral blood of CD8-GsD mice dosed with or without tamoxifen. The average relative expression and s.e.m. are shown (n = 8 mice per group). Statistical significance was determined by two-way ANOVA. d, Confirmation of CD8-restricted Gαs–DREADD activation following tamoxifen and DCZ treatment in CD11b+, NK1.1+, CD4+ or CD8+ cells from peripheral blood. The average frequency and s.e.m. are shown (n = 4 mice per group). Statistical significance was determined by two-way ANOVA. e, Representative histograms showing pCREB induction from 0.002 mg ml–1 DCZ in vitro. f, Experimental scheme showing an in vitro chronic stimulation assay with CD8+ T cells purified from CD8-GsD mice. g, Representative flow cytometry plots of IFNγ and TNF (left) and quantification (right) in chronically stimulated CD8+ T cells with or without 0.002 mg ml–1 DCZ. The average relative expression and s.e.m. are shown (n = 3 biologically independent samples). h, Quantification of granzyme B, Ki-67, PD-1 and TIM-3 in chronically stimulated CD8+ T cells treated with or without 0.002 mg ml–1 DCZ. The average frequency and s.e.m. are shown (n = 3 mice per group). i, Schematic illustrating CREB activity downstream of cAMP/PKA. j, qPCR data showing relative expression of Dusp1 and exhaustion-associated genes. The average frequency and s.e.m. are shown (n = 3 biologically independent samples). k, Experimental schematic of CD8-GsD mice implanted with 4MSOC1-SIINFEKL. l,m, Representative flow cytometry plots (left) and quantification (right) of OVA-tetramer+ (l) or IFNγ+TNF+ (m) CD8+ T cells in CD8-GsD mice implanted with 4MOSC1-OVA treated with or without 0.01 mg per kg (body weight) DCZ (n = 4 mice per group). The average frequency and s.e.m. are shown. Unless indicated otherwise, statistical significance was determined by two-tailed unpaired Student’s t-test. Images in b,f,i and k were generated, in part, with BioRender.com.
Fig. 4 |
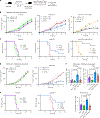
Fig. 4 |. CD8-restricted Gαs stimulation leads to immunotherapy failure.
a, Experimental scheme of CD8-GsD mice implanted with tumors and treated with DCZ, anti-PD-1 or anti-CTLA-4. This figure was generated, in part, with BioRender.com. b,c, Tumor growth curve (b) and survival curves (c) of CD8-GsD mice implanted with 4MOSC1 tumors treated with or without immunotherapy. Mice were treated with hamster IgG (left; n = 5 mice per group), 10 mg per kg (body weight) anti-PD-1 (middle; n = 10 mice per group) or both anti-PD-1 and 10 mg per kg (body weight) anti-CTLA-4 (right; n = 7 mice group for –DCZ and n = 8 mice per group for +DCZ). d,e, Tumor growth curve (d) and survival curves (e) of CD8-GsD mice implanted with MC38-OVA tumors treated with or without immunotherapy (n = 7 mice per group). Mice were given three doses of tamoxifen, and 1 × 10⁵ MC38-OVA cells were implanted into the flanks of mice. Mice were treated with either hamster IgG (left) or 10 mg per kg (body weight) anti-PD-1 (middle). f, Mice from d were taken, and tumors were dissected for flow cytometric analysis. Shown is the quantification of OVA (SIINFEKL)+ (left), IFNγ+ and granzyme B+ tumor-infiltrating CD8+ T cells following DCZ and/or anti-PD-1 treatment. The average frequency and s.e.m. are shown (n = 4 mice per group). Statistical significance was determined by two-way ANOVA. Statistical significance of survival data was calculated by the log-rank test.
Fig. 5 |
Fig. 5 |. Gαs–GPCRs in individuals with cancer correlate with decreased survival and ICB response.
a, Correlation of various Gαs–GPCRs to PDCD1 in melanoma tumors from the The Cancer Genome Atlas (TCGA) skin cutaneous melanoma (SKCM) cohort (n = 469 individuals) by RNA-Seq by Expectation Maximization (RSEM) . Spearman correlations and P values are listed. This figure was generated, in part, with BioRender.com. b, t-Distributed stochastic neighbor embedding (t-SNE) visualization of responders (R) and non-responders (NR) to immunotherapy in individuals with melanoma from GSE120575 (top left). Expression patterns of various Gαs–GPCRs are shown accordingly. c, AUC analysis of the ability of Gαs–GPCRs to predict response to immunotherapy (top left; n = 469 individuals). GPCR expression was calculated as log2 (transcripts per million + 1), and expression levels between responders and non-responders were compared. Statistical significance was determined by two-tailed unpaired Student’s t-test. The average frequency and P values are shown. d, Predicted correlation of ORR to ICB for each G-protein coupling pathway across 16 cancer types.
Fig. 6 |
Fig. 6 |. The Gαs signaling axis as an immune checkpoint in cancer.
s–GPCRs, such as EP2, EP4, A2AR, β1-AR and β2-AR, expressed on CD8+ T cells have ligands in the TME which activate cAMP and PKA, augment T cell exhaustion-related programs, and diminish T cell proliferation, cytotoxicity and infiltration into the tumor. These receptors may need to be blocked in combination with PD-1 and CTLA-4 to overcome T cell dysfunction and exhaustion. This figure was generated, in part, with BioRender.com.

Comment in

References

    1. Okazaki T & Honjo T PD-1 and PD-1 ligands: from discovery to clinical application. Int. Immunol 19, 813–824 (2007). - PubMed
    1. Leach DR, Krummel MF & Allison JP Enhancement of antitumor immunity by CTLA-4 blockade. Science 271, 1734–1736 (1996). - PubMed
    1. Mellman I, Coukos G & Dranoff G Cancer immunotherapy comes of age. Nature 480, 480–489 (2011). - PMC - PubMed
    1. Larkin J et al. Combined nivolumab and ipilimumab or monotherapy in untreated melanoma. N. Engl. J. Med 373, 23–34 (2015). - PMC - PubMed
    1. Haslam A & Prasad V Estimation of the percentage of US patients with cancer who are eligible for and respond to checkpoint inhibitor immunotherapy drugs. JAMA Netw. Open 2, e192535 (2019). - PMC - PubMed

Publication types

LinkOut - more resources