

Transcriptome and metabonomics combined analysis revealed the energy supply mechanism involved in fruiting body initiation in Chinese cordyceps
- PMID: 37308669
- PMCID: PMC10261108
- DOI: 10.1038/s41598-023-36261-7
Transcriptome and metabonomics combined analysis revealed the energy supply mechanism involved in fruiting body initiation in Chinese cordyceps
Abstract
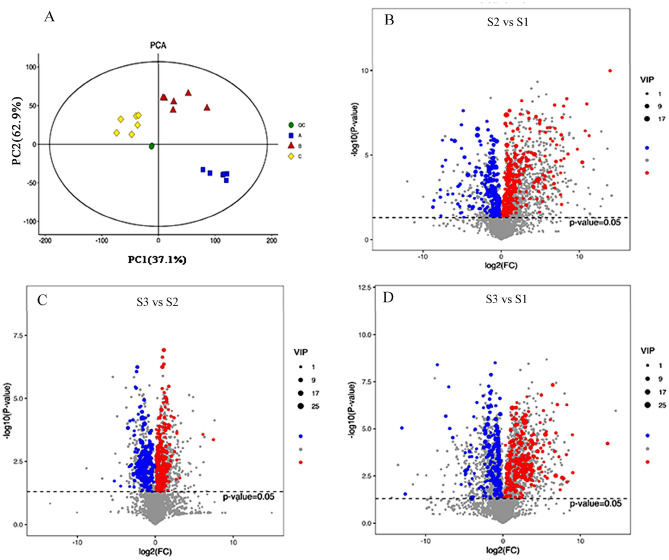
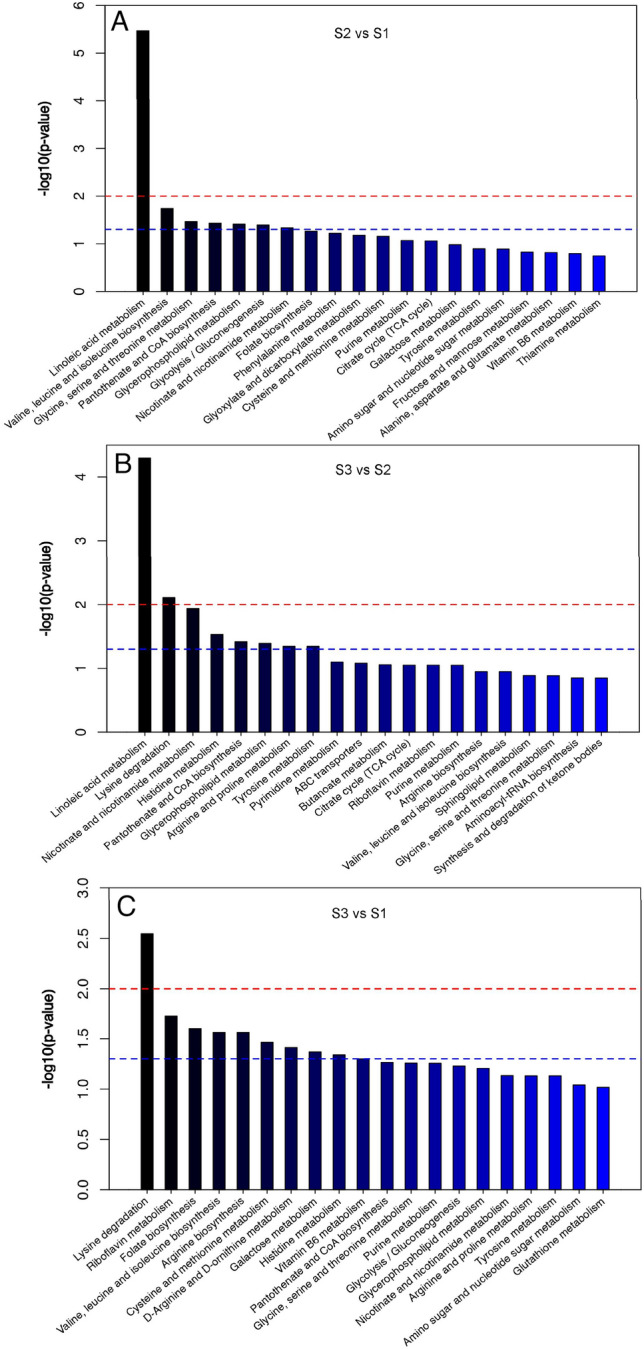
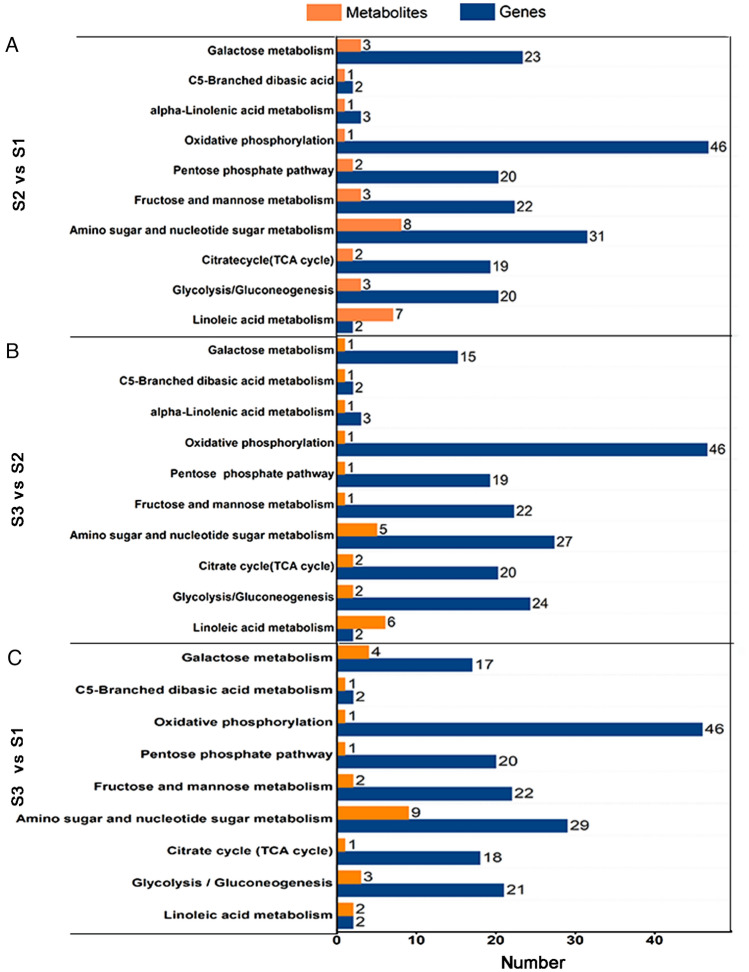
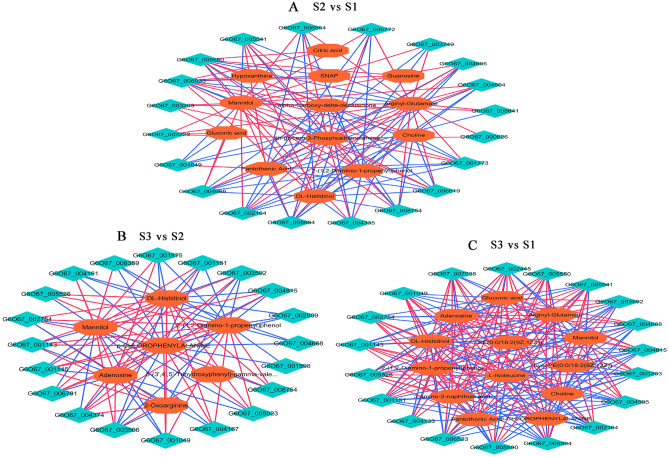
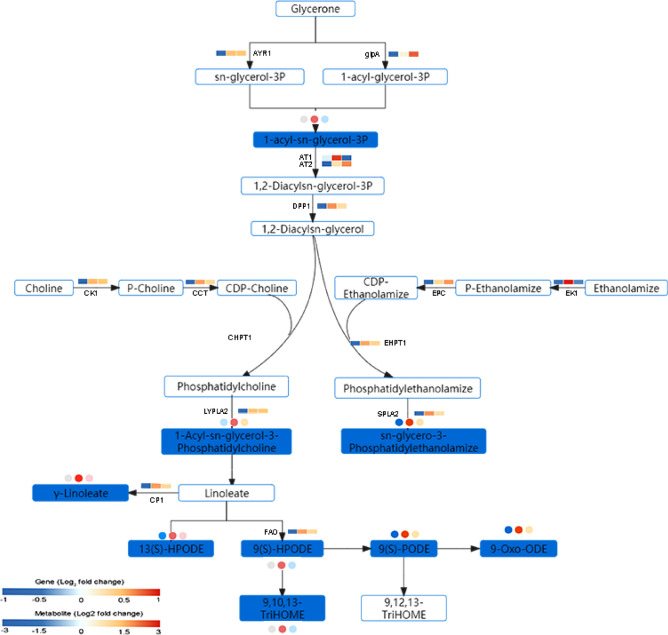
Chinese cordyceps was one of most valuable traditional Chinese medicine fungi. To elucidate the molecular mechanisms related to energy supply mechanism involved in the initiation and formation of primordium in Chinese cordyceps, we performed the integrated metabolomic and transcriptomic analyses of it at pre-primordium period, primordium germination period and after-primordium period, respectively. Transcriptome analysis showed that many genes related to 'starch and sucrose metabolism', 'fructose and mannose metabolism', 'linoleic acid metabolism', 'fatty acids degradation' and 'glycerophospholipid metabolism' were highly up-regulated at primordium germination period. Metabolomic analysis showed many metabolites regulated by these genes in these metabolism pathways were also markedly accumulated at this period. Consequently, we inferred that carbohydrate metabolism and β-oxidation pathway of palmitic acid and linoleic acid worked cooperatively to generate enough acyl-CoA, and then entered TCA cycle to provide energy for fruiting body initiation. Overall, our finding provided important information for further exploring the energy metabolic mechanisms of realizing the industrialization of Chinese cordyceps artificial cultivation.
© 2023. The Author(s).
Conflict of interest statement
The authors declare no competing interests.
Figures


Similar articles
-
Combined metabolome and transcriptome analysis reveal the mechanism of water stress in Ophiocordyceps sinensis.BMC Genomics. 2024 Oct 29;25(1):1014. doi: 10.1186/s12864-024-10785-2. BMC Genomics. 2024. PMID: 39472792 Free PMC article.
-
Transcriptomic analysis of the orchestrated molecular mechanisms underlying fruiting body initiation in Chinese cordyceps.Gene. 2020 Dec 30;763:145061. doi: 10.1016/j.gene.2020.145061. Epub 2020 Aug 17. Gene. 2020. PMID: 32818595
-
Developmental transcriptomics of Chinese cordyceps reveals gene regulatory network and expression profiles of sexual development-related genes.BMC Genomics. 2019 May 4;20(1):337. doi: 10.1186/s12864-019-5708-z. BMC Genomics. 2019. PMID: 31054562 Free PMC article.
-
A breakthrough in the artificial cultivation of Chinese cordyceps on a large-scale and its impact on science, the economy, and industry.Crit Rev Biotechnol. 2019 Mar;39(2):181-191. doi: 10.1080/07388551.2018.1531820. Epub 2018 Nov 4. Crit Rev Biotechnol. 2019. PMID: 30394122 Review.
-
Metabolites and Their Bioactivities from the Genus Cordyceps.Microorganisms. 2022 Jul 24;10(8):1489. doi: 10.3390/microorganisms10081489. Microorganisms. 2022. PMID: 35893547 Free PMC article. Review.
Cited by
-
Rapid discrimination between wild and cultivated Ophiocordyceps sinensis through comparative analysis of label-free SERS technique and mass spectrometry.Curr Res Food Sci. 2024 Aug 14;9:100820. doi: 10.1016/j.crfs.2024.100820. eCollection 2024. Curr Res Food Sci. 2024. PMID: 39263205 Free PMC article.
-
Multi-omics insights into growth and fruiting body development in the entomopathogenic fungus Cordycepsblackwelliae.IMA Fungus. 2025 May 7;16:e147558. doi: 10.3897/imafungus.16.147558. eCollection 2025. IMA Fungus. 2025. PMID: 40376252 Free PMC article.
-
Combined transcriptome and metabolome analysis of sugar and fatty acid of aromatic coconut and non-aromatic coconut in China.Food Chem (Oxf). 2023 Dec 28;8:100190. doi: 10.1016/j.fochms.2023.100190. eCollection 2024 Jul 30. Food Chem (Oxf). 2023. PMID: 38259870 Free PMC article.
-
Combined metabolome and transcriptome analysis reveal the mechanism of water stress in Ophiocordyceps sinensis.BMC Genomics. 2024 Oct 29;25(1):1014. doi: 10.1186/s12864-024-10785-2. BMC Genomics. 2024. PMID: 39472792 Free PMC article.
-
Genome Analysis of BnCNGC Gene Family and Function Exploration of BnCNGC57 in Brassica napus L.Int J Mol Sci. 2024 Oct 22;25(21):11359. doi: 10.3390/ijms252111359. Int J Mol Sci. 2024. PMID: 39518912 Free PMC article.
References
Publication types
MeSH terms
Substances
LinkOut - more resources
Full Text Sources
