. 2023 Nov;94(5):1675-1683.
doi: 10.1038/s41390-023-02679-y. Epub 2023 Jun 13.

Early assessment of injury with optical markers in a piglet model of neonatal encephalopathy

Affiliations

Early assessment of injury with optical markers in a piglet model of neonatal encephalopathy

Kelly Harvey-Jones et al. Pediatr Res. 2023 Nov.

Abstract

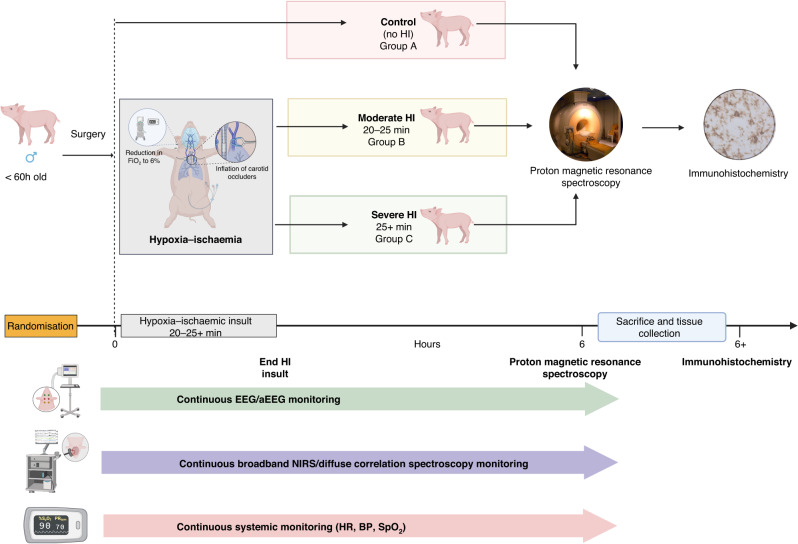
Background: Opportunities for adjunct therapies with cooling in neonatal encephalopathy are imminent; however, robust biomarkers of early assessment are lacking. Using an optical platform of broadband near-infrared spectroscopy and diffuse correlation spectroscopy to directly measure mitochondrial metabolism (oxCCO), oxygenation (HbD), cerebral blood flow (CBF), we hypothesised optical indices early (1-h post insult) after hypoxia-ischaemia (HI) predicts insult severity and outcome.

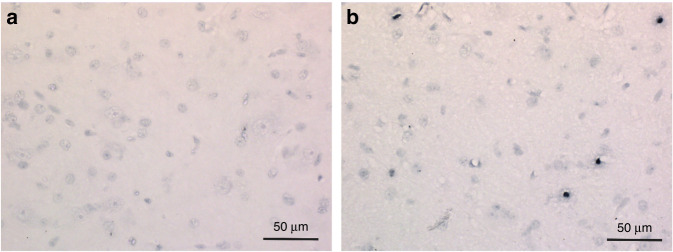
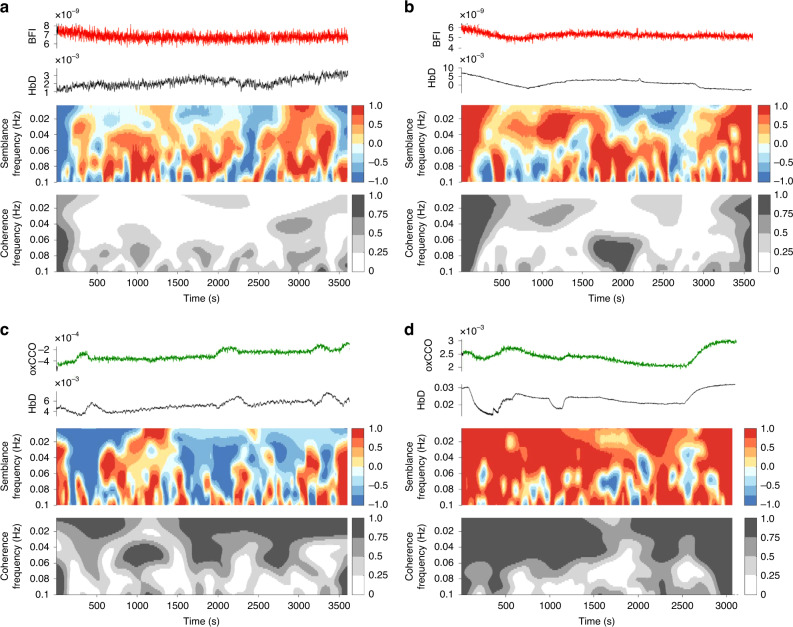
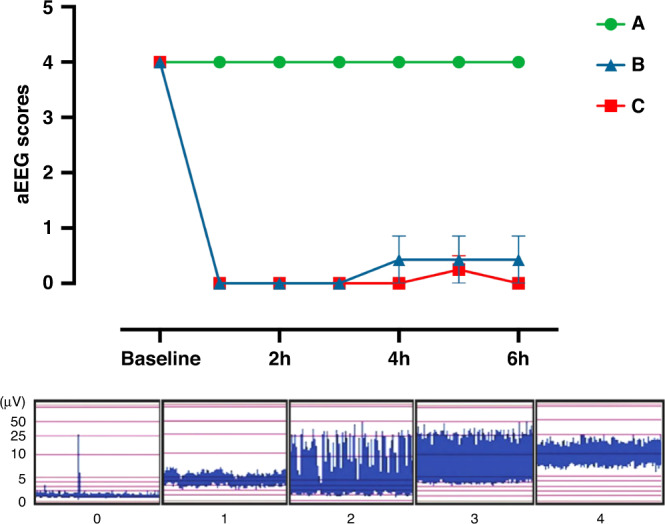
Methods: Nineteen newborn large white piglets underwent continuous neuromonitoring as controls or following moderate or severe HI. Optical indices were expressed as mean semblance (phase difference) and coherence (spectral similarity) between signals using wavelet analysis. Outcome markers included the lactate/N-acetyl aspartate (Lac/NAA) ratio at 6 h on proton MRS and TUNEL cell count.

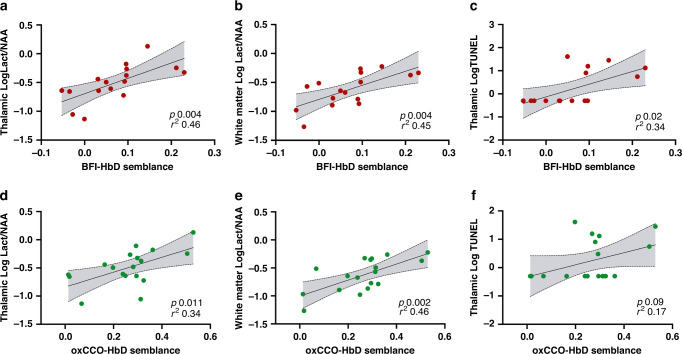
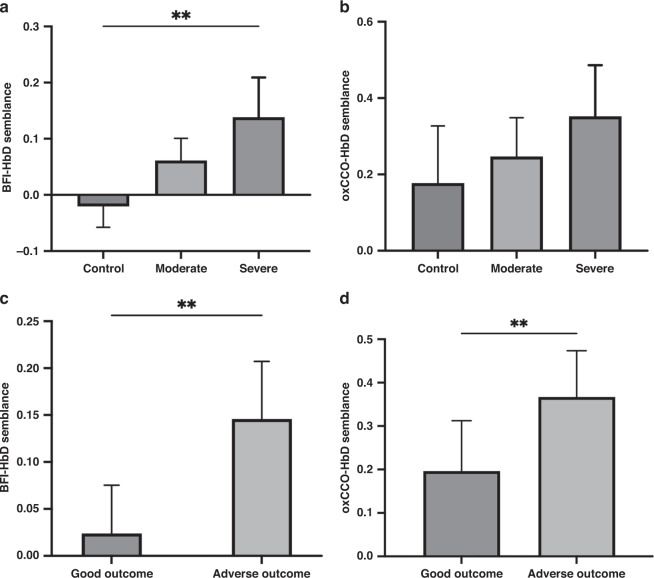
Results: CBF-HbD semblance (cerebrovascular dysfunction) correlated with BGT and white matter (WM) Lac/NAA (r2 = 0.46, p = 0.004, r2 = 0.45, p = 0.004, respectively), TUNEL cell count (r2 = 0.34, p = 0.02) and predicted both initial insult (r2 = 0.62, p = 0.002) and outcome group (r2 = 0.65 p = 0.003). oxCCO-HbD semblance (cerebral metabolic dysfunction) correlated with BGT and WM Lac/NAA (r2 = 0.34, p = 0.01 and r2 = 0.46, p = 0.002, respectively) and differentiated between outcome groups (r2 = 0.43, p = 0.01).

Conclusion: Optical markers of both cerebral metabolic and vascular dysfunction 1 h after HI predicted injury severity and subsequent outcome in a pre-clinical model.

Impact: This study highlights the possibility of using non-invasive optical biomarkers for early assessment of injury severity following neonatal encephalopathy, relating to the outcome. Continuous cot-side monitoring of these optical markers can be useful for disease stratification in the clinical population and for identifying infants who might benefit from future adjunct neuroprotective therapies beyond cooling.


Conflict of interest statement

The authors declare no competing interests.

Figures

Fig. 1
Fig. 1. Summary of the experimental protocol.
Male newborn piglets <60 h of age were randomised into control (no HI), moderate HI or severe HI groups. HI groups achieved severity levels based on the duration of HI combined with key physiological and biochemical thresholds. HI groups also underwent 15 min of baseline neuro/optical and systemic monitoring prior to the start of HI insult and all groups underwent 6 h of continuous monitoring with bNIRS/DCS, EEG and systemic monitoring whilst receiving intensive care. At 6 h, all piglets had 1H MRS imaging to attain BGT and WM Lac/NAA outcome before sacrifice and tissue collection for TUNEL histochemical staining. Wavelet analysis was then carried out on all signals over a 60 min data period commencing at 1 h following the start of HI or at the same time in controls.
Fig. 2
Fig. 2. Representative TUNEL sections of the Thalamus.
a Section from piglet in control group A. b Section from piglet in severe group C showing higher TUNEL cell count.
Fig. 3
Fig. 3. Wavelet analysis of optical signals.
Individual examples of wavelet analysis calculations for cerebrovascular (a, b) and metabolic (c, d) dysfunction indices. For each example ad, raw signals of compared parameters are shown (top), semblance analysis colour map with a colour legend –1–+1 (middle) and coherence analysis colour map with colour legend 0–1 (bottom). a Piglet in the control group with ‘good’ outcome, mean BFI-HbD semblance −0.08, coherence −0.05 and b piglet in severe insult group with ‘poor’ outcome, mean BFI-HbD semblance 0.16, coherence 0.21. c Piglet in the control group with ‘good’ outcome, mean oxCCO-HbD semblance 0.02, coherence 0.01 and d piglet in severe insult group and ‘poor‘ outcome, mean semblance 0.50, coherence 0.57.
Fig. 4
Fig. 4. aEEG activity during the study.
aEEG activity was classified according to Hellstrom-Westas et al. and scores averaged over every hour for three groups – group A (control), group B (moderate HI) and group C (severe HI). Data presented as the grouped least squared mean aEEG scores with standard error of the means (SEM). The least-square means were derived from a mixed-effect ANOVA model, with the Geisser–Greenhouse correction.
Fig. 5
Fig. 5. Relationship between the optical indices of cerebral metabolic and cerebrovascular dysfunction with Lac/NAA and TUNEL cell count.
Linear regression analysis for cerebrovascular dysfunction index BFI-HbD semblance (ac) and metabolic dysfunction index oxCCO-HbD semblance (df). BFI-HbD semblance correlated significantly with a BGT logLac/NAA (r2 = 0.46, p = 0.004), b WM logLac/NAA (r2 = 0.45, p = 0.004) and c Thalamic TUNEL cell count (r2 = 0.34, p = 0.02). oxCCO-HbD semblance correlated significantly with d BGT logLac/NAA (r2 = 0.34, p = 0.01) and e WM logLac/NAA (r2 = 0.46, p = 0.002) but not with f Thalamic TUNEL cell count (r2 = 0.17, p = 0.09).
Fig. 6
Fig. 6. Group analysis of the cerebral metabolic and cerebrovascular indices in relation to insult severity and outcome.
Group analyses of the optical indices BFI-HbD semblance and oxCCO-HbD semblance with insult severity groups (a, b) and MRS-based BGT Lac/NAA outcome groups using threshold 0.39 (c, d). a Cerebrovascular dysfunction index BFI-HbD semblance was significantly different between all three insult groups (r2 = 062, p = 0.002, one-way ANOVA); however, b metabolic dysfunction index oxCCO-HbD semblance did not significantly differentiate between insult groups (r2 = 0.26, p = 0.10 one-way ANOVA). c BFI-HbD semblance significantly predicted outcome group ‘good vs adverse’ based on BGT Lac/NAA threshold 0.39 (r2 = 0.65, two-tailed p = 0.003). d oxCCO-HbD semblance significantly predicted outcome groups ‘good vs adverse’ (r2 = 0.43, two-tailed p = 0.01).

References

    1. Lee AC, et al. Intrapartum-related neonatal encephalopathy incidence and impairment at regional and global levels for 2010 with trends from 1990. Pediatr. Res. 2013;74:50–72. doi: 10.1038/pr.2013.206. - DOI - PMC - PubMed
    1. Liu L, et al. Global, regional, and national causes of child mortality in 2000–13, with projections to inform post-2015 priorities: an updated systematic analysis. Lancet. 2015;385:430–440. doi: 10.1016/S0140-6736(14)61698-6. - DOI - PubMed
    1. Lawn JE, et al. Reducing intrapartum-related deaths and disability: can the health system deliver? Int. J. Gynaecol. Obstet. 2009;107:S123–S140, S140–S142. doi: 10.1016/j.ijgo.2009.07.021. - DOI - PubMed
    1. Azzopardi D, et al. Effects of hypothermia for perinatal asphyxia on childhood outcomes. N. Engl. J. Med. 2014;371:140–149. doi: 10.1056/NEJMoa1315788. - DOI - PubMed
    1. Edwards AD, et al. Neurological outcomes at 18 months of age after moderate hypothermia for perinatal hypoxic ischaemic encephalopathy: synthesis and meta-analysis of trial data. BMJ. 2010;340:c363. doi: 10.1136/bmj.c363. - DOI - PMC - PubMed

Publication types