. 2023 Jun;5(6):981-995.
doi: 10.1038/s42255-023-00801-2. Epub 2023 Jun 12.

Itaconic acid underpins hepatocyte lipid metabolism in non-alcoholic fatty liver disease in male mice

Affiliations

Itaconic acid underpins hepatocyte lipid metabolism in non-alcoholic fatty liver disease in male mice

Jonathan M Weiss et al. Nat Metab. 2023 Jun.

Abstract

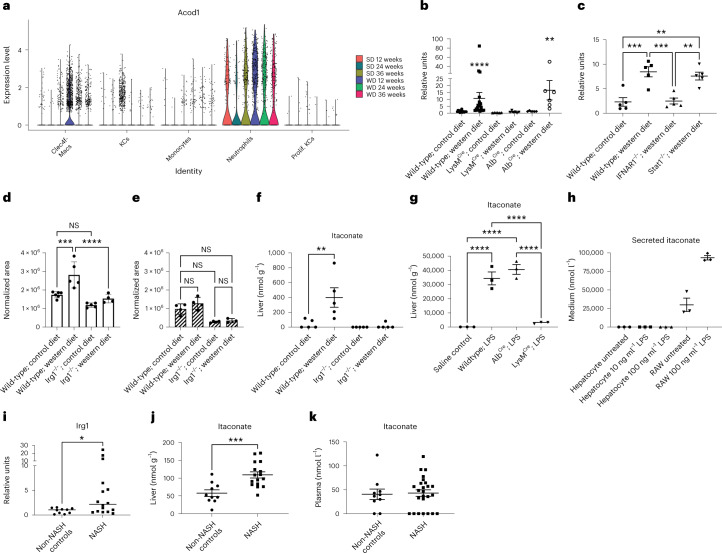
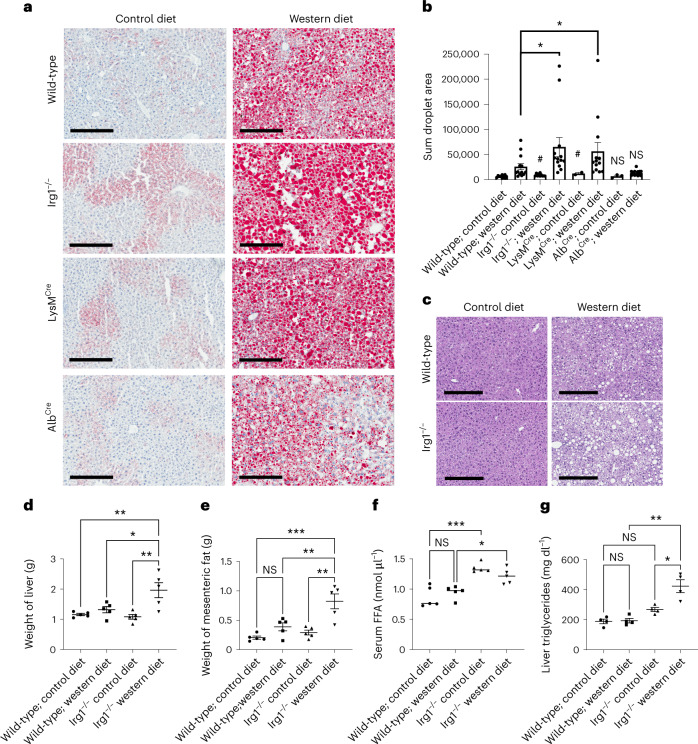
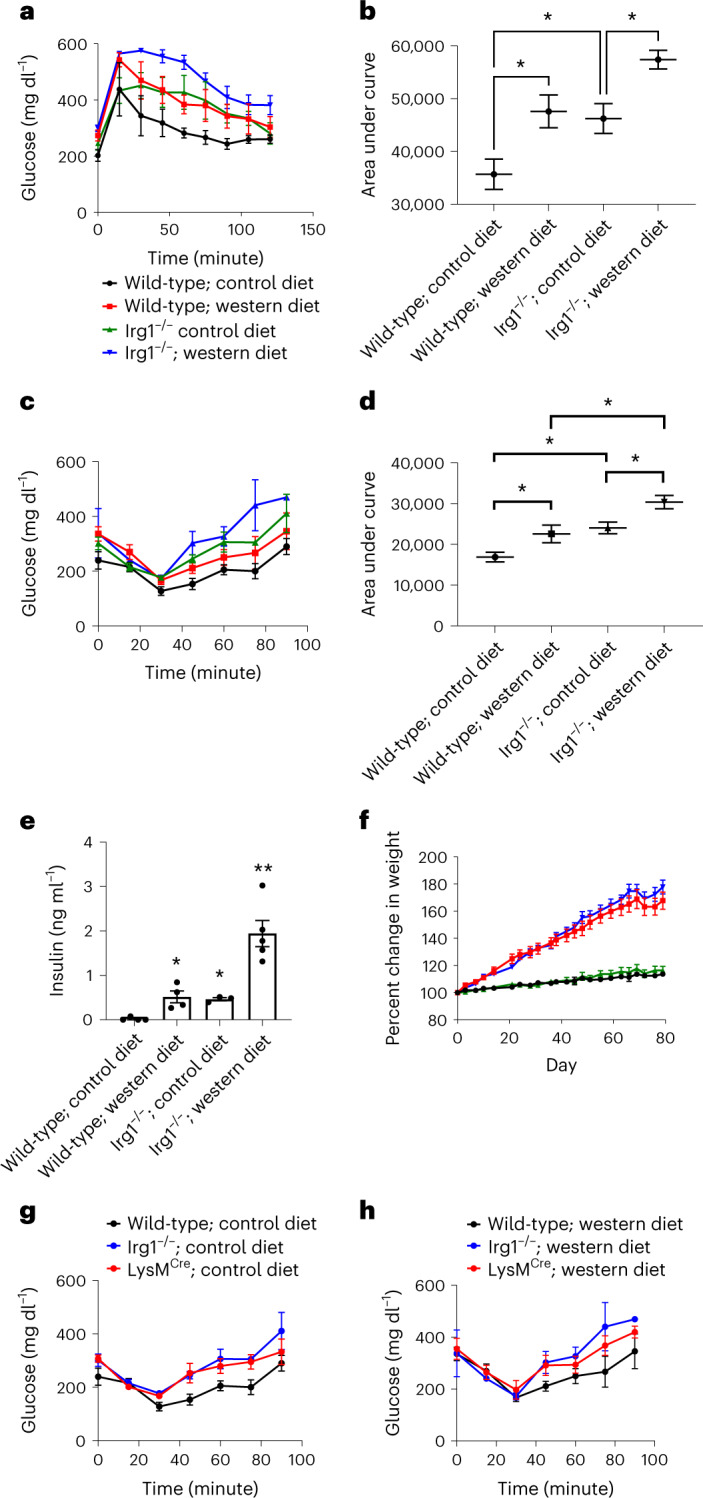
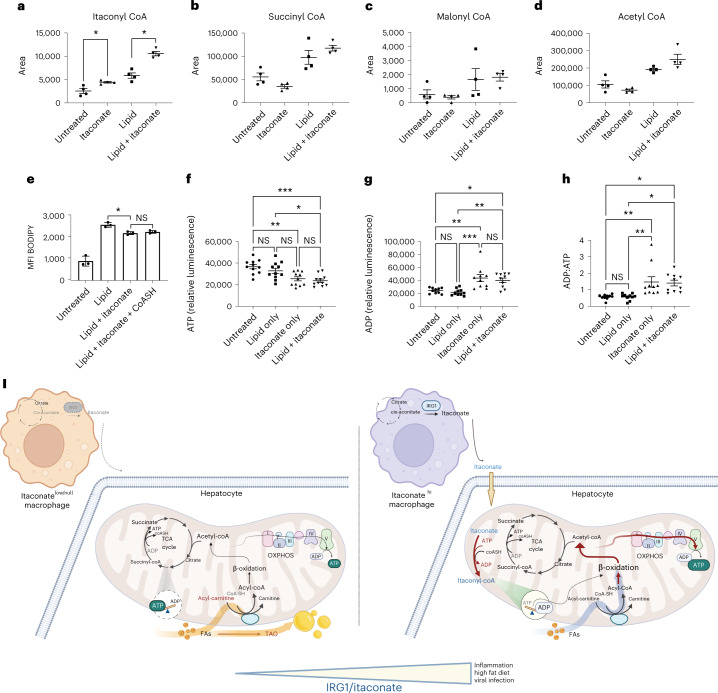
Itaconate, the product of the decarboxylation of cis-aconitate, regulates numerous biological processes. We and others have revealed itaconate as a regulator of fatty acid β-oxidation, generation of mitochondrial reactive oxygen species and the metabolic interplay between resident macrophages and tumors. In the present study, we show that itaconic acid is upregulated in human non-alcoholic steatohepatitis and a mouse model of non-alcoholic fatty liver disease. Male mice deficient in the gene responsible for itaconate production (immunoresponsive gene (Irg)-1) have exacerbated lipid accumulation in the liver, glucose and insulin intolerance and mesenteric fat deposition. Treatment of mice with the itaconate derivative, 4-octyl itaconate, reverses dyslipidemia associated with high-fat diet feeding. Mechanistically, itaconate treatment of primary hepatocytes reduces lipid accumulation and increases their oxidative phosphorylation in a manner dependent upon fatty acid oxidation. We propose a model whereby macrophage-derived itaconate acts in trans upon hepatocytes to modulate the liver's ability to metabolize fatty acids.


Conflict of interest statement

The authors declare no competing interests.

Figures

Fig. 1
Fig. 1. Dysregulated lipid metabolism in Irg1−/− macrophages.
a, BMMs from four wild-type and four Irg1−/− mice were analyzed for broad metabolomics by mass spectrometry. For each metabolite, a ratio was computed by dividing the metabolite level by the relative mean for all eight samples (four wild-type and four Irg1−/−). The heat map depicts log2-transformed ratios for metabolites significantly different; all metabolites shown are *P < 0.05 between genotypes, as determined by two-sided multiple t-tests (one per row). b, Itaconate production was confirmed in cultured BMMs by culturing cells in the presence of 50 μg ml−1 macrophage colony-stimulating factor. At the indicated times, supernatant was collected and analyzed for itaconate using mass spectrometry. The graph depicts results from triplicate bone-marrow cultures. c, Peritoneal resident macrophages were isolated from the indicated mice. Lipid staining was visualized using flow cytometric analysis of BODIPY 493/503 staining. The graph illustrates results from ten mice. Data are presented as mean ± s.e.m. A two-sided analysis of variance (ANOVA) was performed between each group and the wild-type control (**P = 0.0015; ***P = 0.0001). As a positive control, wild-type mice were treated with 50 μg LPS 24 h before the isolation of peritoneal macrophages. Source data
Fig. 2
Fig. 2. Irg1 is upregulated in hepatic macrophages in response to high-fat diet.
a, Transcriptomic analysis of Acod1/Irg1 mRNA expression on cell subsets in mice fed control/standard diet (SD) or WD for the indicated times from a single-cell RNA-seq experiment in Guilliams et al. b,c, Whole liver lobes were collected on week 12 following control or WD feeding of the indicated mice. Murine Irg1 gene expression was quantified in each sample using qPCR. For b, n = 20 wild-type mice per group; n = 6 Cre-specific mice per group (****P < 0.0001; **P = 0.002). For c, n = 5 mice per group (**P = 0.003; ***P = 0.0005). d,e, F4/80+ macrophages were isolated by magnetic selection from single-cell suspensions of liver cells. Graphs depict the relative area of itaconate production in positively selected F4/80+ macrophages (***P = 0.0002; ****P < 0.0001; NS, not significant) (d) and the flow-through non-macrophage fraction (n = 5 mice per group) (e). f, Itaconate production was quantified from homogenized livers of 12 week WD-fed mice, normalized for liver tissue weight (n = 5 mice per group; P = 0.008). g, Itaconate production was quantified from mice treated with 50 μg LPS overnight (n = 3 mice per group; P < 0.0001). h, Secreted itaconate in the supernatants of untreated and LPS-treated hepatocytes or RAW 264.7 cells as a positive control (n = 3 per group). A two-sided ANOVA with multiple comparisons was used for statistical analyses (bg). i,j, Human Irg1 expression (*P = 0.03) (i) and itaconate production (j) (***P = 0.017) in human NASH livers. Human liver samples from 10 non-NASH controls (consisting of hemangioma, focal nodular hyperplasia, hepatic adenoma, hepatocellular carcinoma and benign cases) and 16 NASH cases were analyzed for itaconate expression using mass spectrometry. Results for Irg1 are shown as the relative fold change over non-NASH controls. Results for itaconate were normalized per mg liver tissue. A two-sided Mann–Whitney U-test was used for statistical analysis of human NASH samples (i,j). k, Itaconate levels in the plasma of non-NASH controls and NASH cases. Data are presented as mean ± s.e.m. Source data
Fig. 3
Fig. 3. Exacerbated fatty liver disease in Irg1−/− mice after WD diet feeding.
a, ORO staining of frozen liver tissue sections. Each image is representative of ten non-overlapping fields from five mice per group and repeated in two separate experiments; scale bar, 300 μm). b, The sum areas of ORO staining were quantified using ImageJ software (*P = 0.02 for the indicated comparisons; #P = 0.01 compared to the wild-type/control diet sample; n = 10). c, Representative H&E staining of liver tissues. The image depicted is representative of five non-overlapping fields from three mice. Scale bar, 300 μM; ×10 magnification. d, Liver weights of five mice per group (*P = 0.036; **P = 0.009). e, Mesenteric fat weights (five mice per group; **P = 0.009; ***P = 0.0006; NS, not significant). f, Serum levels of free fatty acids (n = 5 per group; *P = 0.043; ***P = 0.0006; NS, not significant). g, Liver triglycerides (n = 4 per group; *P = 0.013; **P = 0.001; NS, not significant). Data are presented as mean ± s.e.m. A two-sided ANOVA with multiple comparisons was used for statistical analyses. Source data
Fig. 4
Fig. 4. Treatment of mice with 4-OI reverses the exacerbated fatty liver disease in Irg1−/− mice.
Mice on WD were treated with 50 mg kg−1 4-OI in 40% cyclodextrin/PBS or vehicle control (40% cyclodextrin/PBS) for 12 weeks. a,b, Itaconate levels in the plasma (a) and liver (b) were quantified at the indicated times (n = 5 mice per group). c, ORO staining of control diet- (top) and WD- (bottom) fed mice. The images are each representative of 20 non-overlapping images from five different mice per group. d, The sum areas of ORO staining were quantified using ImageJ software (*P = 0.015; ****P < 0.0001 for the indicated comparisons; n = 20). e, Quantitation of ORO (average droplet size) was obtained by dividing the sums of droplet area (d) by the number of droplets/image (**P = 0.002; ****P < 0.0001; n = 20). f, Mesenteric fat weight (five mice per group; P = 0.014 for the indicated group, as compared to all other groups). Data are presented as mean ± s.e.m. A two-sided ANOVA with multiple comparisons was used for statistical analyses. Source data
Fig. 5
Fig. 5. Glucose and insulin intolerance in Irg1−/− and Irg1fl/fl × LysMCre mice after WD feeding.
a, Blood glucose levels following a single dose challenge of 2 g kg−1 glucose of the indicated mice. The graph depicts n = 5 mice from one experiment, representative of three total experiments. b, Area under the curve for the glucose tolerance test (*P = 0.04; n = 5). c, Blood glucose levels following a single dose challenge of 0.5 U kg−1 insulin of the indicated mice (n = 5 mice per group). d, Area under the curve for the insulin tolerance test (*P = 0.031; n = 5). e, Serum insulin levels at 12 weeks (*P = 0.03; **P = 0.001; n = 5 mice per group). f, Mouse weight measurements, as percentage of day 0 starting weight, during the 12 weeks of control or WD feeding. g,h, Insulin intolerance in Irg1fl/fl × LysMCre mice was determined by feeding mice control (g) or WD (h) for 12 weeks and blood glucose levels were monitored over time following a single-dose challenge of insulin of the indicated mice. The graphs depict n = 5 mice per experiment, representative of three similar experiments. Data are presented as mean ± s.e.m. A two-sided ANOVA with multiple comparisons was used for statistical analyses. Source data
Fig. 6
Fig. 6. Loss of hepatic and adipose macrophages in global and myeloid-deficient Irg1 mice fed WD.
a, Macrophage (F4/80) staining of formalin-fixed liver tissues, visualized using DAB chromogen. Each image is representative of ten non-overlapping fields from five mice per group and repeated in two separate experiments; scale bar, 300 μm). b, The F4/80-stained areas of 14 images per group were quantitated using ImageJ software (*P = 0.015; ***P = 0.0002). c, Reduction of hepatic crown-like structures (CLSs); F4/80+ macrophages forming a ring-like structure. The number of CLSs were manually counted on 14 images per group (****P < 0.0001). d, Macrophage (F4/80) staining of formalin-fixed adipose tissue, visualized using alkaline phosphatase chromogen (scale bar, 500 μM). Each image is representative of five non-overlapping fields from five mice per group. e, Quantitation of CLSs in adipose tissue (n = 25 images; **P = 0.002). CLSs in adipose tissue surround dying adipocytes in a crown-like pattern. Data are presented as mean ± s.e.m. A two-sided ANOVA with multiple comparisons was used for statistical analyses. Source data
Fig. 7
Fig. 7. Itaconate reduces lipid accumulation by hepatocytes and enhances their oxidative phosphorylation.
Targeted lipidomics showing triglycerides (a) and acyl carnitines (b) between untreated and itaconate-treated hepatocytes. For each metabolite, a ratio was computed by dividing the metabolite level by the relative mean for all six samples (three wild-type and three Irg1−/−). The heat map depicts log2-transformed ratios for metabolites. Significance was determined by two-sided multiple t-tests (one per row between genotypes) and is denoted on the side of the heat maps. c, Primary cultures of hepatocytes were treated with the indicated doses of itaconate and/or the indicated dilution of chemically defined lipid mixture. After 24 h, the treated hepatocytes were collected and analyzed for BODIPY staining. The graph depicts hepatocytes treated with itaconate and/or lipid (n = 3 from one experiment shown representative of seven similar experiments; *P = 0.028; **P = 0.005). d,e, Hepatocytes seeded in 96-well plates were treated with 10 mM itaconate and/or 1:100 lipid. The next day, cells were washed and analyzed using a Seahorse Bioanalyzer. d,e, The OCR (d) and extracellular acidification rate (ECAR) (e) is shown for one experiment (four replicate wells). Similar results were obtained in five similar experiments. At the indicated times, drugs were injected as (1) medium only or 40 μM etomoxir; (2) 1 μg ml−1 oligomycin; (3) 1 μM FCCP; (4) 100 nM rotenone + 1 μM antimycin A. fh, The basal (f), maximal (g) and ATP OCR (h) are graphed (n = 4 for each; *P < 0.05; **P = 0.003). A two-sided ANOVA with multiple comparisons was used for statistical analyses in c,fh. il, For detection of fatty acid carbon utilization into TCA-cycle intermediates hepatocytes were cultured overnight in 1:10 lipid mix ± 10 mM itaconate. Uniformly (U-13C16) labeled palmitate was added for the final 4 h and intracellular levels of labeled TCA intermediates were measured by mass spectrometry. Open bars depict the mean ± s.e.m. for M + 2 isotopologs and dark bars depict the mean ± s.e.m. of M + 4 isotopologs (*P = 0.04; **P = 0.006). No M + 4 was detected for aspartate. Statistical differences for (il) were determined by two sample t-test (n = 3 per group). Source data
Fig. 8
Fig. 8. Itaconate suppression substrate-level phosphorylation could lead to compensatory β-oxidation.
ad, Hepatocytes were treated with 10 mM itaconate and/or 1:100 lipid. Levels of itaconyl-CoA (a) (*P = 0.049), succinyl-CoA (b), malonyl CoA (c) and acetyl-CoA (d) were measured by mass spectroscopy. The graphs depict triplicate wells from one experiment, representative of three experiments. e, BODIPY lipid staining in treated hepatocytes (n = 3). Some hepatocytes were treated in the presence of 0.5 mM CoASH (*P = 0.02; NS, not significant). f,g, Relative ATP (f) and ADP (g) levels were measured in treated hepatocytes (n = 11; *P = 0.011; **P = 0.003; ***P = 0.0003). h, ADP:ATP ratios in treated hepatocytes were calculated (n = 11; *P = 0.014; **P = 0.007). Data are presented as mean ± s.e.m. A two-sided ANOVA with multiple comparisons was used for statistical analyses. i, Schematic depicting net rebalancing of ADP:ATP levels in cells following metabolism of itaconate to itaconyl-CoA. Higher levels of itaconate result in a net loss of ATP due to itaconyl-CoA metabolism. Increases in ADP lead to a compensatory increase in β-oxidation, glycolysis and oxidative phosphorylation to restore cellular ATP levels that in turn reduces excess lipid levels. The image in i was created using BioRender.com under a full license to the National Cancer Institute (NCI). Source data

References

    1. Wong RJ, et al. Nonalcoholic steatohepatitis is the second leading etiology of liver disease among adults awaiting liver transplantation in the United States. Gastroenterology. 2015;148:547–555. doi: 10.1053/j.gastro.2014.11.039. - DOI - PubMed
    1. Reddy JK, Rao MS. Lipid metabolism and liver inflammation. II. Fatty liver disease and fatty acid oxidation. Am. J. Physiol. Gastrointest. Liver Physiol. 2006;290:G852–G858. doi: 10.1152/ajpgi.00521.2005. - DOI - PubMed
    1. Alves-Bezerra M, Cohen DE. Triglyceride metabolism in the liver. Compr. Physiol. 2017;8:1–8. - PMC - PubMed
    1. Yki-Jarvinen H. Non-alcoholic fatty liver disease as a cause and a consequence of metabolic syndrome. Lancet Diabetes Endocrinol. 2014;2:901–910. doi: 10.1016/S2213-8587(14)70032-4. - DOI - PubMed
    1. Strelko CL, et al. Itaconic acid is a mammalian metabolite induced during macrophage activation. J. Am. Chem. Soc. 2011;133:16386–16389. doi: 10.1021/ja2070889. - DOI - PMC - PubMed

Publication types