. 2023 Jul;55(7):1138-1148.
doi: 10.1038/s41588-023-01417-8. Epub 2023 Jun 12.

Rare coding variants in CHRNB2 reduce the likelihood of smoking

Collaborators, Affiliations

Rare coding variants in CHRNB2 reduce the likelihood of smoking

Veera M Rajagopal et al. Nat Genet. 2023 Jul.

Abstract

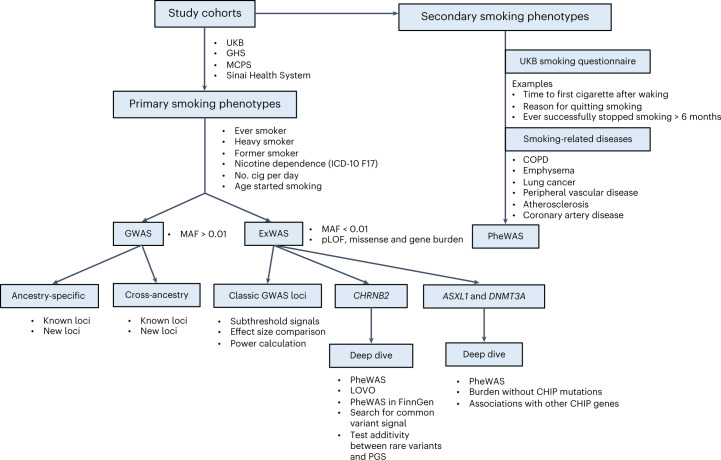
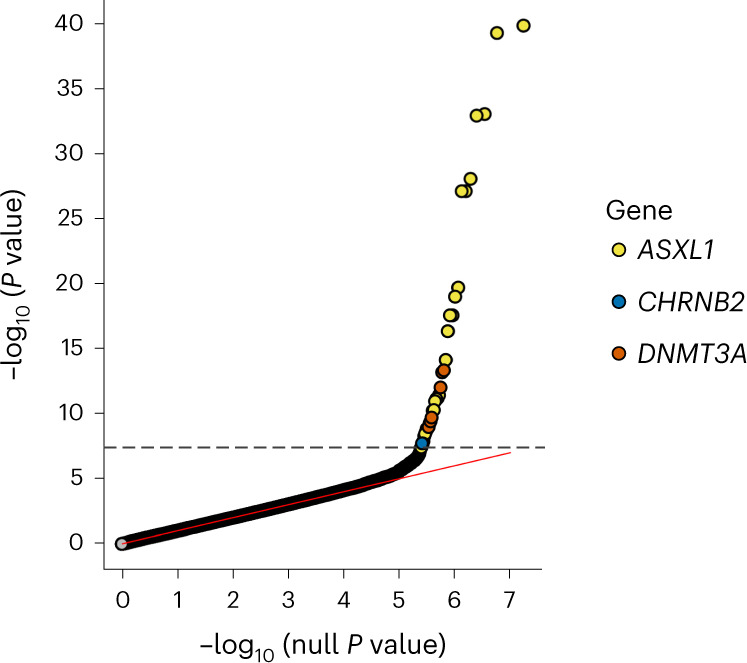
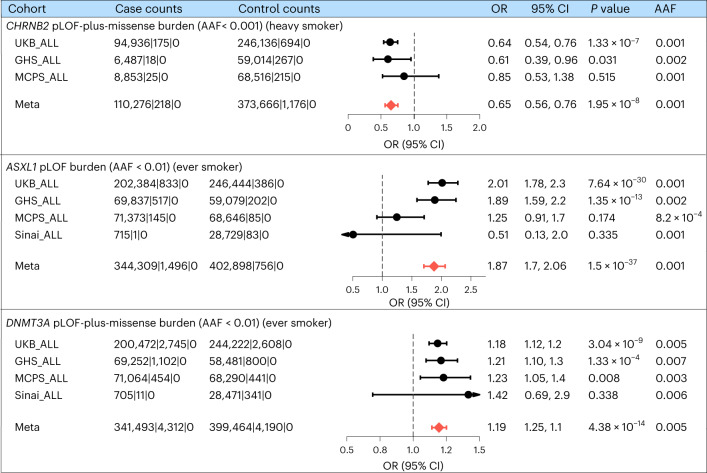
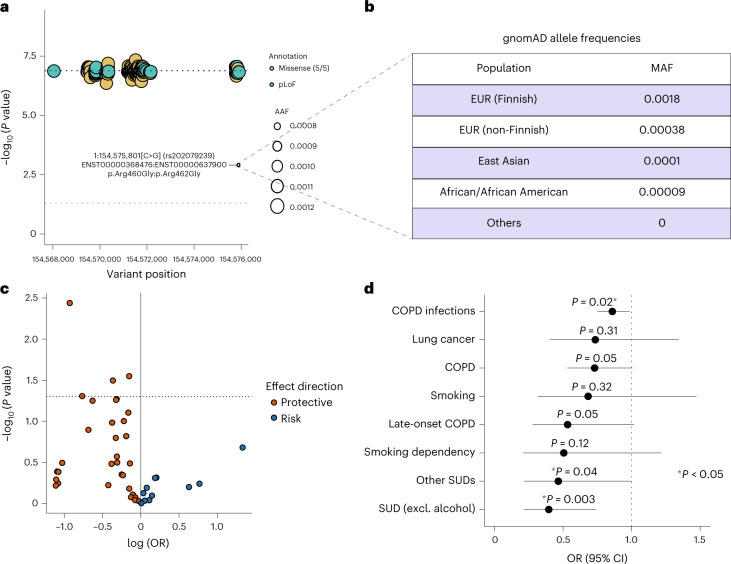
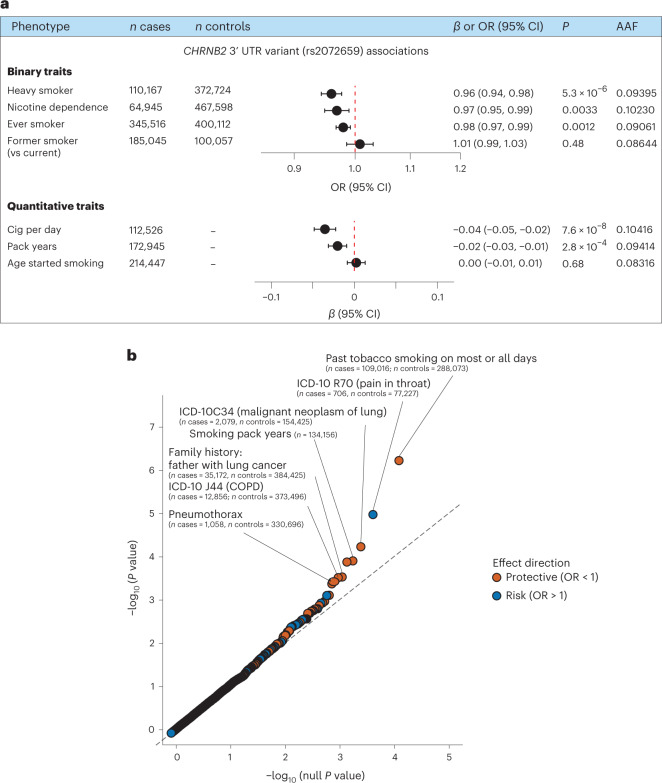
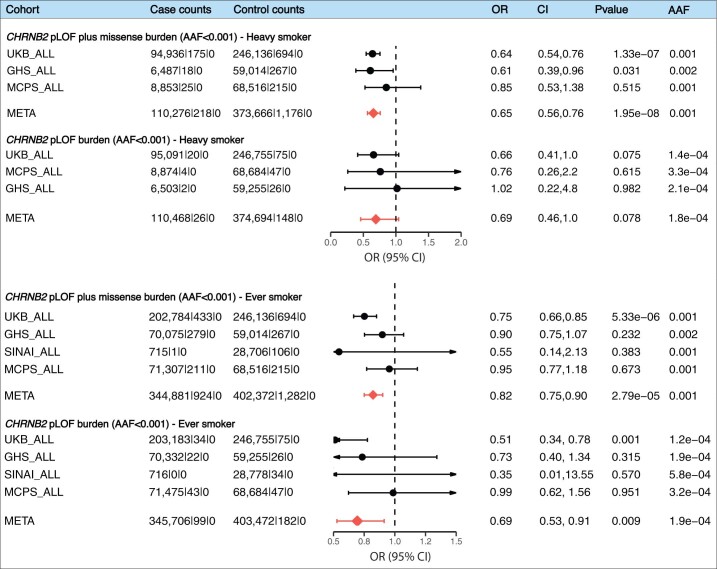
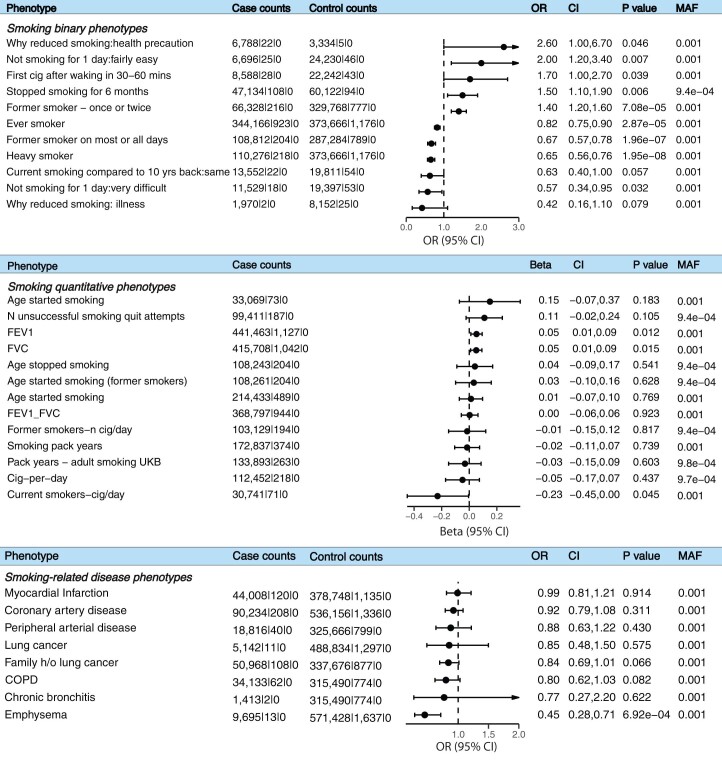
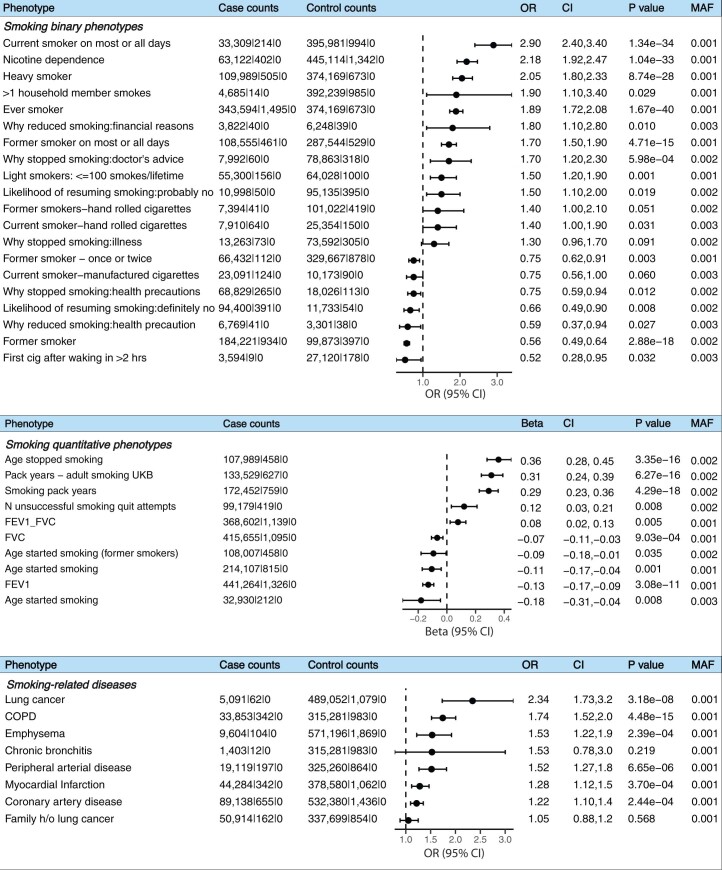
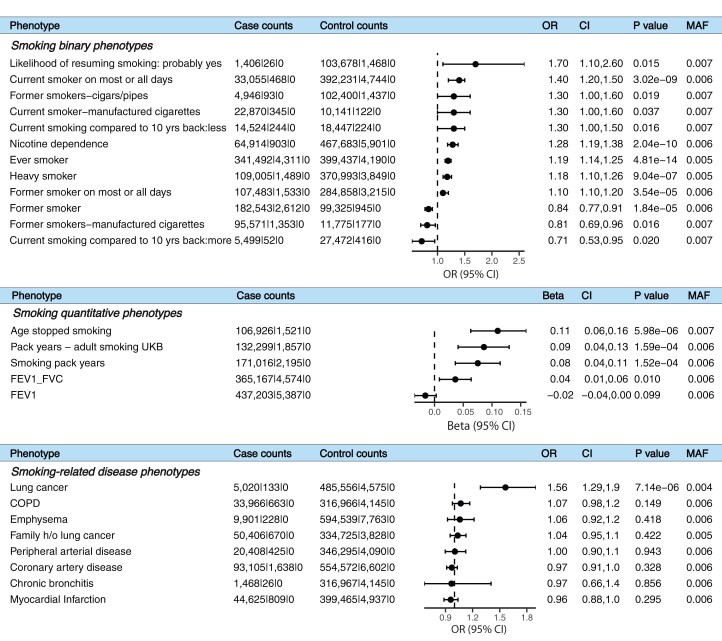
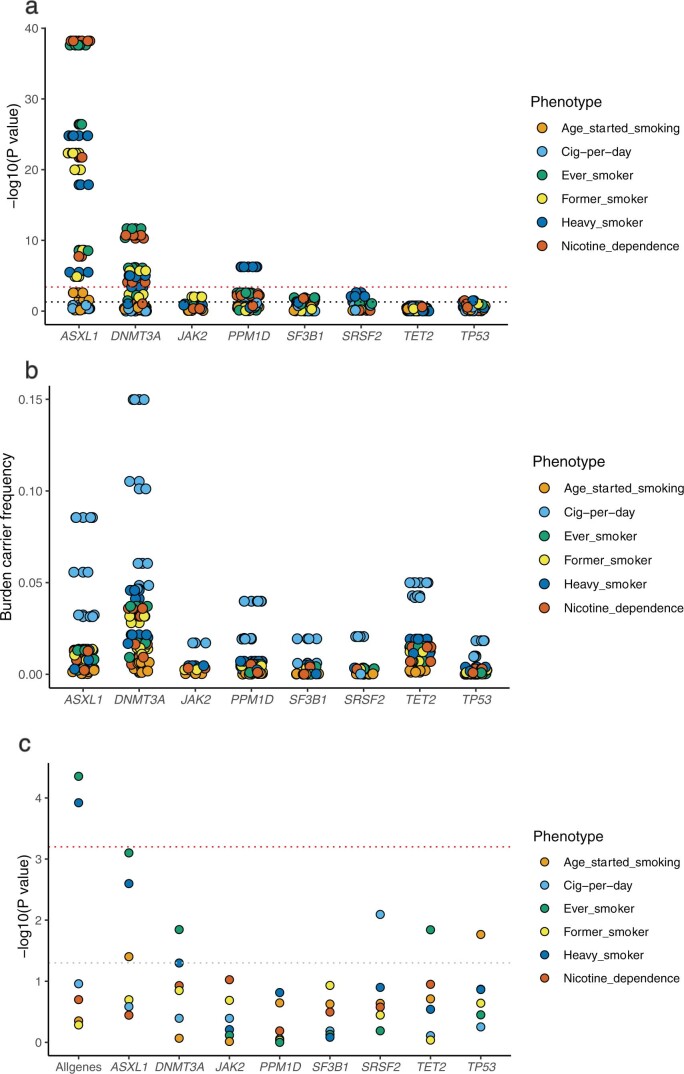
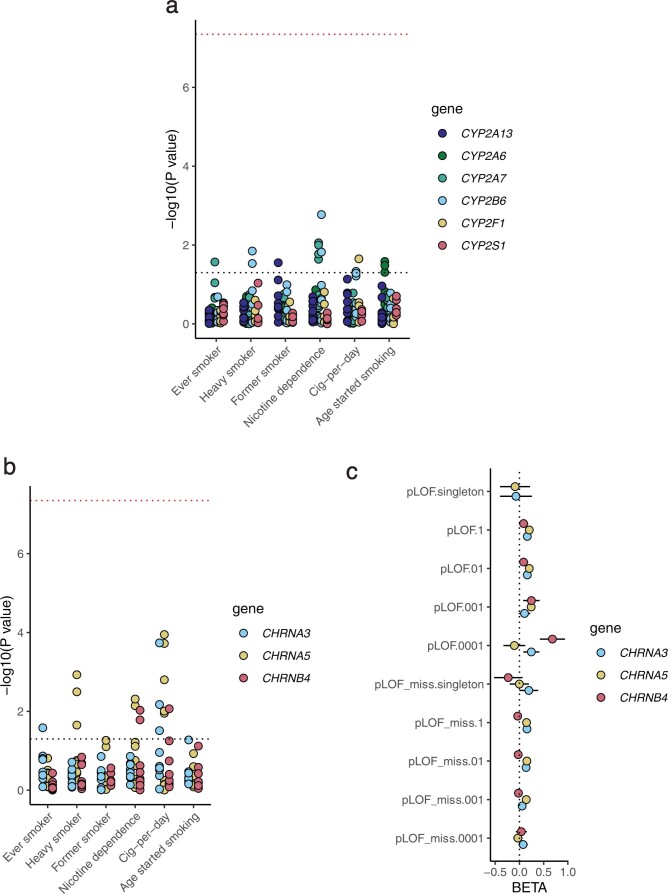
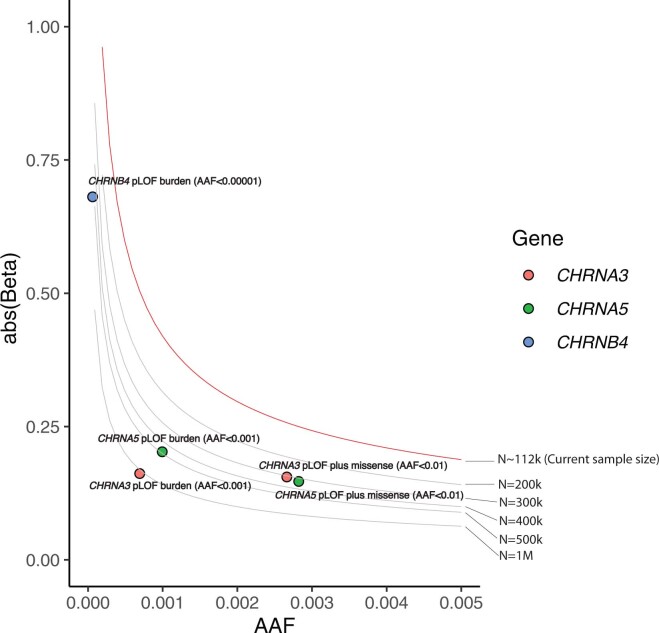
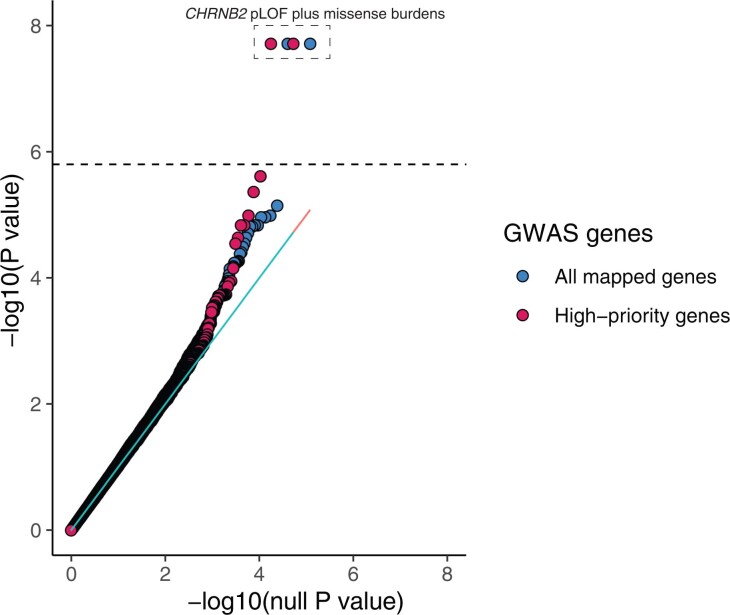
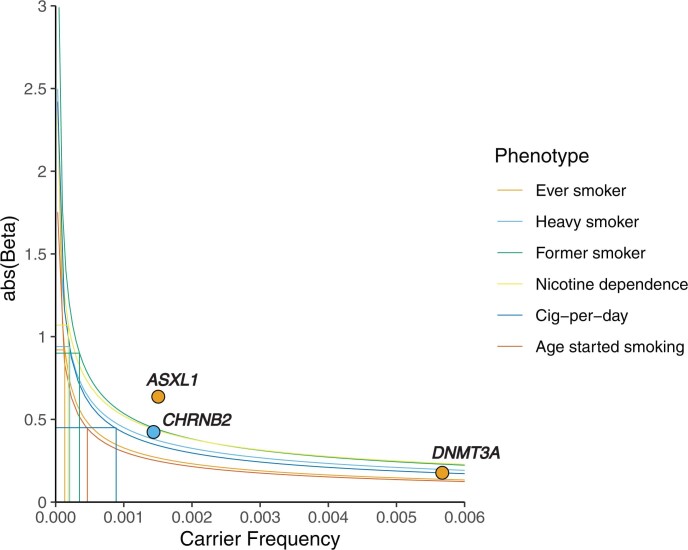
Human genetic studies of smoking behavior have been thus far largely limited to common variants. Studying rare coding variants has the potential to identify drug targets. We performed an exome-wide association study of smoking phenotypes in up to 749,459 individuals and discovered a protective association in CHRNB2, encoding the β2 subunit of the α4β2 nicotine acetylcholine receptor. Rare predicted loss-of-function and likely deleterious missense variants in CHRNB2 in aggregate were associated with a 35% decreased odds for smoking heavily (odds ratio (OR) = 0.65, confidence interval (CI) = 0.56-0.76, P = 1.9 × 10⁻⁸). An independent common variant association in the protective direction ( rs2072659 ; OR = 0.96; CI = 0.94-0.98; P = 5.3 × 10⁻⁶) was also evident, suggesting an allelic series. Our findings in humans align with decades-old experimental observations in mice that β2 loss abolishes nicotine-mediated neuronal responses and attenuates nicotine self-administration. Our genetic discovery will inspire future drug designs targeting CHRNB2 in the brain for the treatment of nicotine addiction.


Conflict of interest statement

V. M. Rajagopal, K.W., J. Mbatchou, A. Ayer, P.Q., D.S., M.D.K., K. Praveen, S. Gelfman, N. Parikshak, J.M.O., S. Bao, S.M.C., E.P., A. Avbersek, M. Kapoor, E.C., M.B.J., M. Leblanc, A.R.S., S. Balasubramanian, G.R.A., H.M.K., J. Marchini, E.A.S., E.J., R. Sanchez, W.L., M.A., M.C., D. Lederer, A. Baras and G.C. are current or former employees and/or stockholders of Regeneron Pharmaceuticals. The other authors declare no competing interests.

Figures

Fig. 1
Fig. 1. Study design.
The flow chart summarizes the overall study design in terms of cohorts, phenotypes and types of genetic analyses performed. ICD, International Classification of Diseases.
Fig. 2
Fig. 2. Discovery of rare variants associated with smoking phenotypes.
Quantile–quantile (QQ) plot of the rare variant associations (both variant and burden associations) with six smoking phenotypes (ever smoker, heavy smoker, former smoker, nicotine dependence, cig per day and age started smoking). The dashed line corresponds to the exome-wide significant threshold, 4.5 × 10−8, determined based on a 1% FDR correction applied across all the associations (n tests = 8,417,987).
Fig. 3
Fig. 3. Forest plots of the top burden–trait associations of the significant genes.
Cohort-level and meta-analysis summary statistics of the most significant burden–trait associations for each of the three exome-wide significant genes are summarized using forest plots. The ORs and 95% CIs are plotted. The columns ‘case counts’ and ‘control counts’ show the case and control sample sizes, respectively, broken down to the number of carriers of the homozygous reference, heterozygous and homozygous alternative genotypes. For burden definitions, refer to Supplementary Table 2. ALL, all ancestries; AAF, alternative allele frequency (combined frequency of all the variants aggregated in the burden mask).
Fig. 4
Fig. 4. A Finnish-enriched missense variant contributes most to the CHRNB2 burden association.
a, Results from LOVO analysis (Methods) of the CHRNB2 pLOF-plus-missense burden (AAF < 0.001) in the UKB. The LOVO P values are plotted against the variant positions. The dashed blue line corresponds to the P value of the full burden association. The dashed gray line corresponds to P = 0.05. b, MAFs of Arg460Gly (rs202079239) in different populations in the gnomAD database. EUR, European ancestry. c, Volcano plot showing the PheWAS associations of Arg460Gly with smoking-related phenotypes in the FinnGen database. The dashed line corresponds to P = 0.05. d, ORs and 95% CIs of selected phenotype associations of Arg460Gly in the FinnGen database are displayed. Excl., excluding, SUD, substance use disorder.
Fig. 5
Fig. 5. Association of a common 3′ UTR variant with smoking.
a, Forest plots of associations of the CHRNB2 3′ UTR variant (rs2072659) with the major smoking phenotypes based on cross-ancestry meta-analyses (Methods); either ORs (if binary traits) or β estimates (in s.d. units) and their 95% CIs are plotted. b, QQ plot of the PheWAS associations of rs2072659 in the UKB and the GHS cohorts.
Fig. 6
Fig. 6. Association of ASXL1 and DNMT3A CHIP mutations with smoking.
We constructed pLOF-only and pLOF-plus-missense burden masks at five allele frequency thresholds using all variants (wCHIP) and excluding CHIP variants (woCHIP) in the UKB and the GHS cohorts and tested their associations with the six major smoking phenotypes using REGENIE (Methods). The burden association P values are plotted, and the summary statistics including sample sizes are provided in Supplementary Table 8. The dashed line corresponds to the significance threshold after adjusting for multiple testing (1% FDR correction).
Fig. 7
Fig. 7. Additive effects between CHRNB2 rare variants and smoking PGS.
Prevalence estimates of heavy smokers among CHRNB2 rare variant carriers and non-carriers within each of the five PGS quintiles in the UKB are plotted. Standard errors of the prevalence estimates, displayed as error bars, were calculated using the formula √(pq/n), where n is the number of individuals in each group, p is the prevalence of heavy smoker in the group and q is 1 − p. The PGS was based on a GWAS meta-analysis of the ever smoker phenotype (Methods). CHRNB2 rare variants are those that were aggregated into the CHRNB2 pLOF-plus-missense (AAF < 0.001) burden mask. Statistical differences in the prevalence between carriers and non-carriers were tested using a logistic regression analysis within each quintile; ORs, 95% CIs and P values are shown.
Extended Data Fig. 1
Extended Data Fig. 1. Forest plots of CHRNB2 burden associations with heavy-smoker and ever-smoker.
The forest plot displays the cohort-level and meta-analysis associations of the CHRNB2 pLOF-only (AAF<0.001) and pLOF plus missense (AAF<0.001) burden masks with heavy-smoker and ever-smoker tested using REGENIE (Methods). The odds ratios and 95% confidence intervals are plotted. The columns ‘case counts’ and ‘control counts’ show the case and control sample sizes, respectively, broken down to the number of carriers of the homozygous reference, heterozygous and homozygous alternative genotypes.
Extended Data Fig. 2
Extended Data Fig. 2. Forest plots of CHRNB2 burden associations with secondary smoking phenotypes.
The forest plots display the cohort-level or meta-analysis associations of CHRNB2 pLOF plus missense (AAF<0.001) burden mask with binary (P<0.1) and quantitative smoking phenotypes (major smoking phenotypes and phenotypes derived based on UKB lifestyle questionnaire) and smoking-related diseases tested using REGENIE (Methods). The odds ratios (or Beta estimates) and 95% confidence intervals are plotted. The columns ‘case counts’ and ‘control counts’ show the case and control sample sizes, respectively, broken down to the number of carriers of the homozygous reference, heterozygous and homozygous alternative genotypes. FEV1 – Forced expiratory volume in 1 sec; FVC – Forced vital capacity; FEV1_FVC – FEV1:FVC ratio; COPD – Chronic obstructive pulmonary disease.
Extended Data Fig. 3
Extended Data Fig. 3. Forest plots of ASXL1 burden associations with secondary smoking phenotypes.
The forest plots display the cohort-level or meta-analysis associations of ASXL1 pLOF only burden mask (AAF<0.01) with binary and quantitative smoking phenotypes (major smoking phenotypes and phenotypes derived based on UKB lifestyle questionnaire with P<0.1) and smoking-related diseases tested using REGENIE (Methods). The odds ratios (or beta estimates) and 95% confidence intervals are plotted. The columns ‘case counts’ and ‘control counts’ show the case and control sample sizes, respectively, broken down to the number of carriers of the homozygous reference, heterozygous and homozygous alternative genotypes.
Extended Data Fig. 4
Extended Data Fig. 4. Forest plots of DNMT3A burden associations with secondary smoking phenotypes.
The forest plots display the cohort-level or meta-analysis associations of DNMT3A pLOF plus missense burden mask (AAF<0.01) with binary and quantitative smoking phenotypes (major smoking phenotypes and phenotypes derived based on the UKB lifestyle questionnaire) and smoking-related diseases tested using REGENIE (Methods). The odds ratios (or beta estimates) and 95% confidence intervals are plotted. The columns ‘case counts’ and ‘control counts’ show the case and control sample sizes, respectively, broken down to the number of carriers of the homozygous reference, heterozygous and homozygous alternative genotypes.
Extended Data Fig. 5
Extended Data Fig. 5. Associations of CHIP mutations with smoking.
a. pLOF only and pLOF plus missense burden masks for eight recurrent CHIP genes were created in the UKB and GHS cohorts by aggregating only high-confident CHIP mutations (Methods) and tested for their associations with the six smoking phenotypes. The results were meta-analyzed between the GHS and UKB cohorts and the resulting P values are plotted. The dotted red line corresponds to FDR 1% P value threshold and the black dotted line corresponds to P = 0.05. b. The alternative allele frequencies (AAF) of the burden masks (combined AAF of all the variants aggregated in a mask) are plotted. c. Variant allele fractions (VAF) of CHIP mutations in the eight most recurrent CHIP genes were aggregated gene-wise and all together in the CHIP carriers in the UKB and GHS cohorts (when the same individual carried more than one CHIP mutation, we took the average of the VAF) and tested for associations with the six smoking phenotypes. The UKB and GHS combined association P values are plotted. The red dotted line corresponds to FDR 1% P value and the black dotted line corresponds to P = 0.05.
Extended Data Fig. 6
Extended Data Fig. 6. Rare variant associations at the classic CYP2A6 and CHRNA5 GWAS loci.
a. P values of the pLOF only and pLOF plus missense burden associations of cytochrome gene cluster at the CYP2A6 GWAS locus with the six smoking phenotypes are plotted. The red dotted line corresponds to FDR 1% P value and the black dotted line corresponds to P = 0.05. b. P values of the pLOF only and pLOF plus missense burden associations of nicotine acetylcholine receptor (nAChR) genes at the CHRNA5 GWAS locus with the six smoking phenotypes are plotted. The red dotted line corresponds to FDR 1% P value and the black dotted line corresponds to P = 0.05. c. The beta estimates (in SD units) and 95% confidence intervals of the nAChR burden associations with cig-per-day (N = 112,670) are plotted. The sample sizes of the associations shown in panels a, b, and c are provided in Supplementary Table 11.
Extended Data Fig. 7
Extended Data Fig. 7. Power calculations for rare variant discovery at the CHRNA5 GWAS locus.
Assuming an 80% power and P value of 5e-8, detectable effect sizes at various minor allele frequency values were calculated for the current sample size of cig-per-day (the smoking trait most associated with CHRNA5 locus) as well for a series of sample sizes up to 1 million. The observed effect sizes for pLOF only burden and pLOF and missense burden associations of CHRNA5, CHRNA3 and CHRNB4 are plotted; all the points lay below the red line, which marks the detection limit of our current sample size, suggesting that we are underpowered. Based on the intersections of the grey lines with the points marking the observed effect sizes, we can approximately guess what sample size will be required to detect these burden signals at P value 5e-8.
Extended Data Fig. 8
Extended Data Fig. 8. Association of rare variant burden in genes at the GWAS loci associated with smoking behavior.
Rare pLOF only and pLOF and missense burden associations were tested focusing only on the genes located at the known GWAS loci identified by the recent largest GWAS of smoking to date. We studied two gene lists prioritized by Saunders et al.: a list of genes mapped to all the identified GWAS loci and a list of ‘high-priority genes’ mapped to GWAS loci with less than five fine-mapped variants. QQ plots of the meta-analysis P values of burden associations are shown. The dashed line corresponds to FDR 1% P value threshold.
Extended Data Fig. 9
Extended Data Fig. 9. Power calculations for gene discovery using the current sample size.
Assuming an 80% power, P value threshold of 4e-8 (exome-wide significant threshold of the current study based on FDR 1%), effect sizes (that is, beta values) were computed for a range of minor allele frequencies (combined allele frequency in case of burden masks) for a given sample size (varies across phenotypes). The computed effect sizes (absolute values of beta estimates) are plotted against minor allele frequencies (carrier frequency) for six smoking phenotypes. The carrier frequency corresponding to 100 carriers, calculated for each of the phenotype based on the corresponding sample size, in the X axis and the corresponding effect size in the Y axis are marked with straight lines. The top association of the three genes identified as exome-wide significant are plotted with the color corresponding to the associated phenotype. Based on these power curves, we had 80% power to detect any variant or burden associations with ever-smoker, heavy-smoker and /former-smoker/ with odds ratio ~2.5 or higher (0.4 or lower) when there are at least 100 carriers. And we had 80% power to detect any variant or burden associations with cig-per-day and age started smoking with beta 0.45 (equivalent to 4.7 extra cigarettes for cig-per-day and 1.9 yr earlier age for age started smoking) when there are at least 100 carriers. These calculations assume that there is no heterogeneity in the effect sizes across the cohorts, which is never the case for complex traits such as smoking. Hence, these estimates should be considered arbitrary. Importantly, the effect sizes for protective associations with binary phenotypes are likely overestimated due to imbalances in the case-control ratios.

Similar articles

Cited by

References

    1. Reitsma MB, et al. Spatial, temporal, and demographic patterns in prevalence of smoking tobacco use and attributable disease burden in 204 countries and territories, 1990–2019: a systematic analysis from the Global Burden of Disease Study 2019. Lancet. 2021;397:2337–2360. doi: 10.1016/S0140-6736(21)01169-7. - DOI - PMC - PubMed
    1. Rigotti NA, Kruse GR, Livingstone-Banks J, Hartmann-Boyce J. Treatment of tobacco smoking: a review. JAMA. 2022;327:566–577. doi: 10.1001/jama.2022.0395. - DOI - PubMed
    1. Jordan CJ, Xi Z-X. Discovery and development of varenicline for smoking cessation. Expert Opin. Drug Discov. 2018;13:671–683. doi: 10.1080/17460441.2018.1458090. - DOI - PMC - PubMed
    1. Tong EK, Carmody TP, Simon JA. Bupropion for smoking cessation: a review. Compr. Ther. 2006;32:26–33. doi: 10.1385/COMP:32:1:26. - DOI - PubMed
    1. US Preventive Services Task Force et al. Interventions for tobacco smoking cessation in adults, including pregnant persons: US Preventive Services Task Force Recommendation Statement. JAMA. 2021;325:265–279. doi: 10.1001/jama.2020.25019. - DOI - PubMed

Publication types