

Homocysteine promotes atherosclerosis through macrophage pyroptosis via endoplasmic reticulum stress and calcium disorder
- PMID: 37308812
- PMCID: PMC10262416
- DOI: 10.1186/s10020-023-00656-z
Homocysteine promotes atherosclerosis through macrophage pyroptosis via endoplasmic reticulum stress and calcium disorder
Abstract
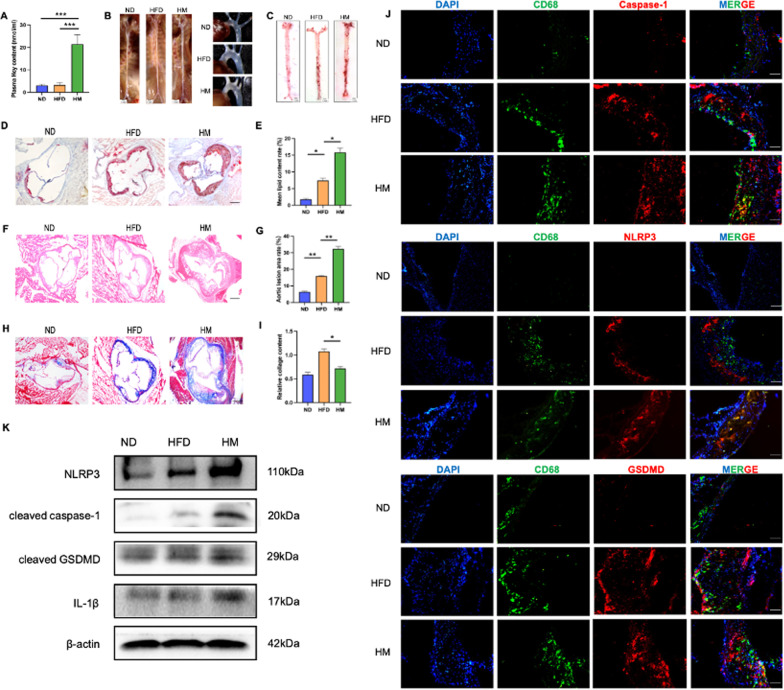
Background: Elevated plasma homocysteine levels, known as hyperhomocysteinemia, have been identified as an independent risk factor for atherosclerosis and related cardiovascular diseases. Macrophage pyroptosis-mediated inflammation is crucial in the development of atherosclerosis, but the underlying mechanisms remain unclear.
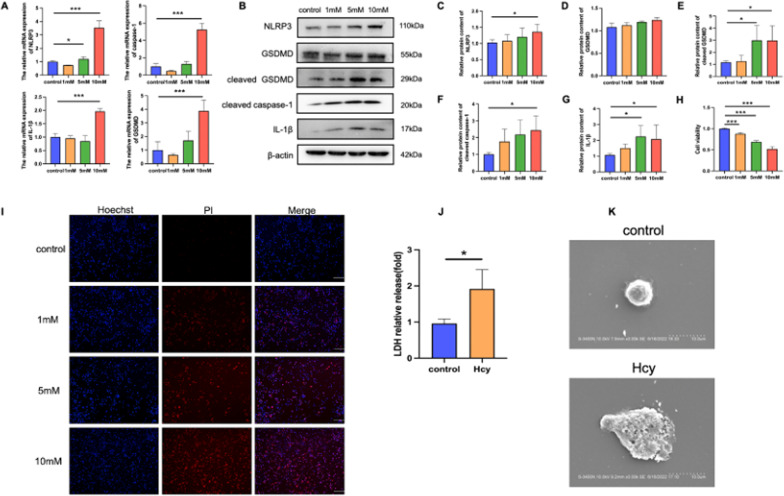
Methods: A hyperhomocysteinemia atherosclerotic model with ApoE-/- mice fed with a high-methionine diet was constructed to investigate the role of plasma homocysteine in atherosclerosis. THP-1-derived macrophages were used to investigate the mechanisms by which Hcy regulates pyroptosis.
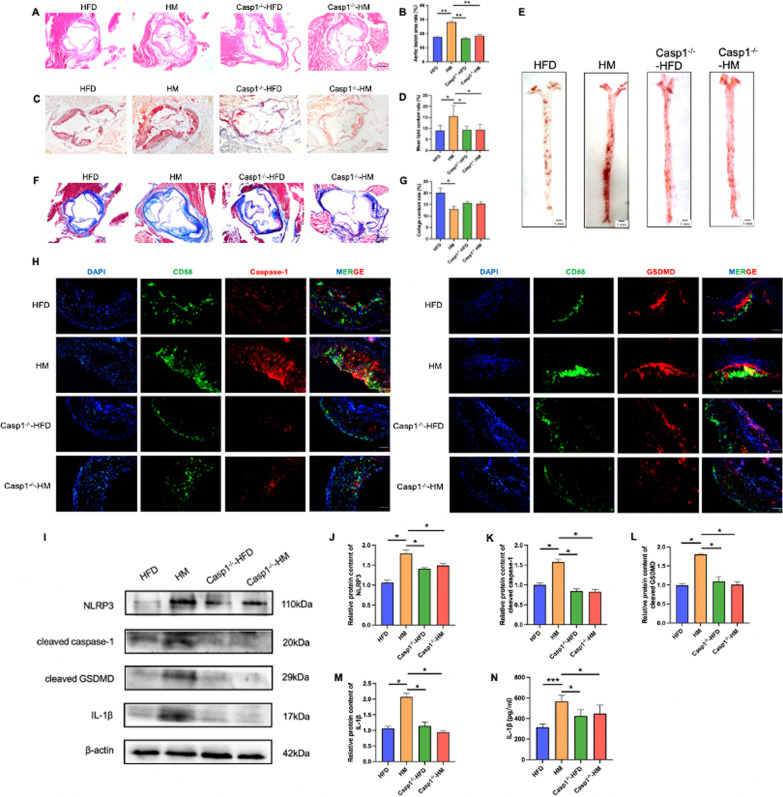
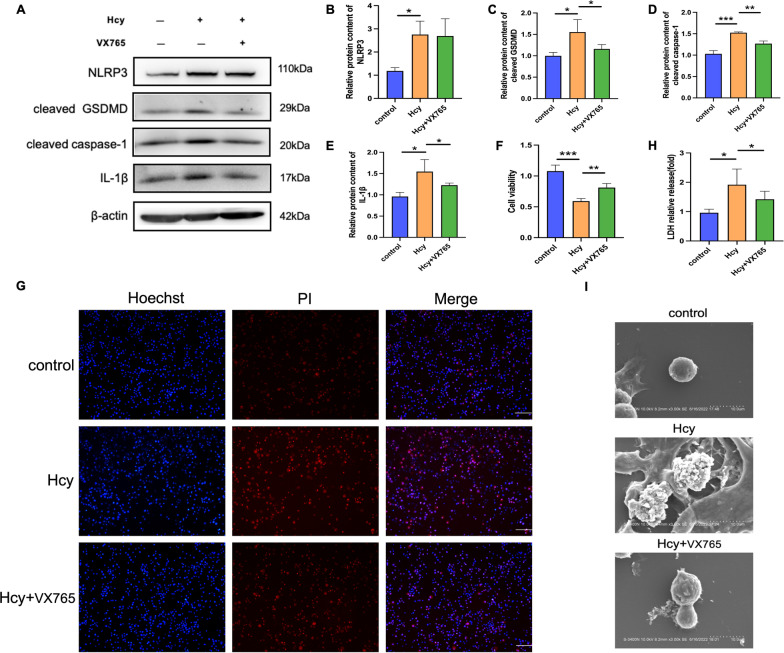
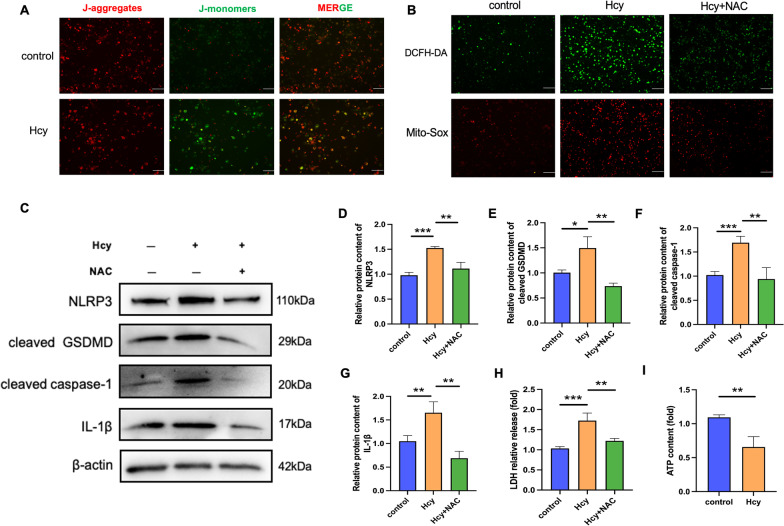
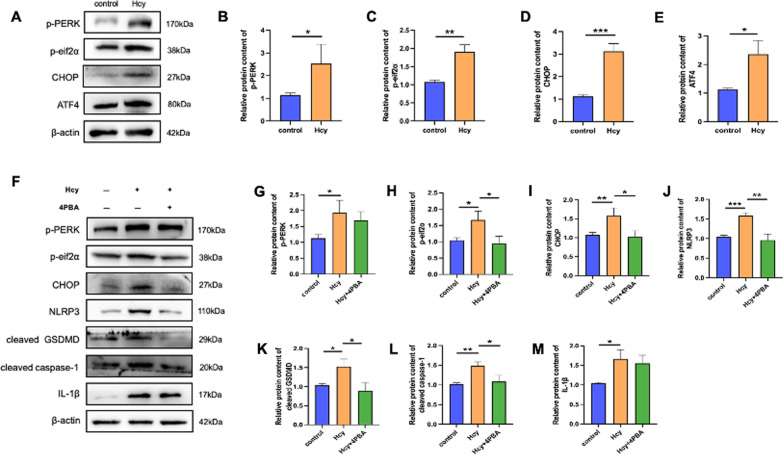
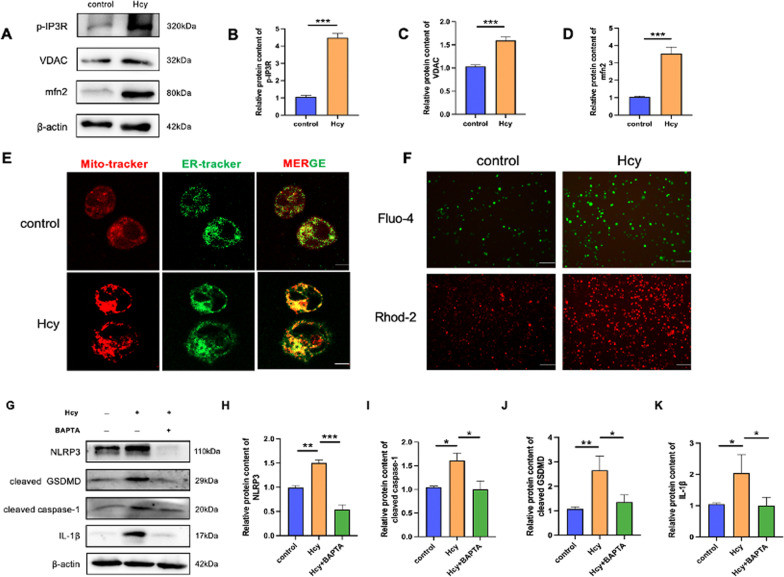
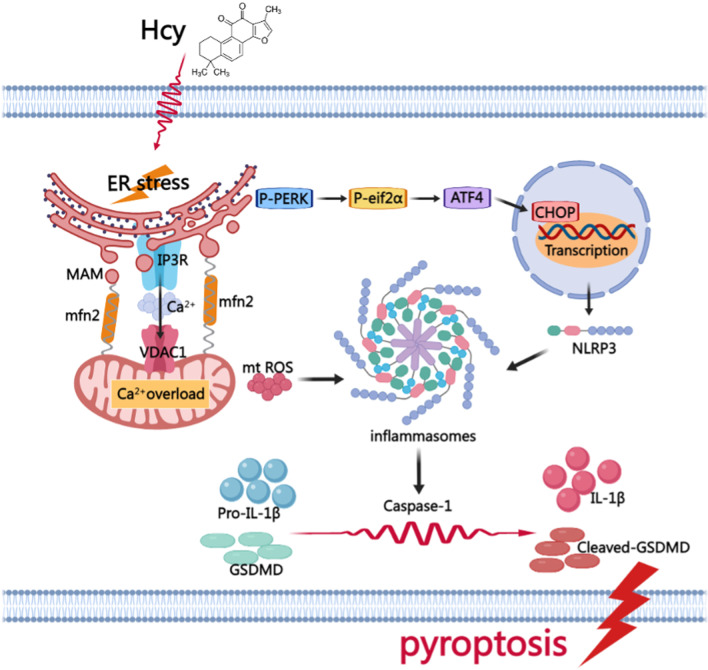
Results: We found that hyperhomocysteinemia resulted in larger atherosclerotic plaques and more secretion of inflammatory cytokines, while these effects were attenuated in Caspase-1 knockdown mice. Likewise, in vitro experiments demonstrated that treatment of macrophages with homocysteine resulted in NLRP3 inflammasome activation and pyroptosis, as evidenced by cleavage of Caspase-1, production of downstream IL-1β, elevation of lactate dehydrogenase activity, and extensive propidium iodide-positive staining of cells. These were all inhibited by Caspase-1 inhibitor. In addition, excessive generation of reactive oxygen species was associated with mitochondrial dysfunction, characterized by loss of mitochondrial membrane potential and ATP synthesis. Moreover, further experiments revealed that homocysteine induced endoplasmic reticulum stress, enhanced communication between the endoplasmic reticulum and mitochondria, and consequently contributed to calcium disorder. Furthermore, the endoplasmic reticulum stress inhibitor, 4PBA, the calcium chelator, BAPTA, and calcium channel inhibitor, 2-APB significantly improved macrophage pyroptosis.
Conclusion: Homocysteine accelerates atherosclerosis progression by enhancing macrophages pyroptosis via promoting endoplasmic reticulum stress, endoplasmic reticulum-mitochondria coupling, and disturbing of calcium disorder.
Keywords: Atherosclerosis; Calcium disorder; Homocysteine; Hyperhomocysteinemia; Inflammasome; Pyroptosis; Risk factor.
© 2023. The Author(s).
Conflict of interest statement
The authors declare that they have no competing interests.
Figures
Similar articles
-
Activation of NLRP3 inflammasomes contributes to hyperhomocysteinemia-aggravated inflammation and atherosclerosis in apoE-deficient mice.Lab Invest. 2017 Aug;97(8):922-934. doi: 10.1038/labinvest.2017.30. Epub 2017 Apr 10. Lab Invest. 2017. PMID: 28394319 Free PMC article.
-
Caspase-1 Inflammasome Activation Mediates Homocysteine-Induced Pyrop-Apoptosis in Endothelial Cells.Circ Res. 2016 May 13;118(10):1525-39. doi: 10.1161/CIRCRESAHA.116.308501. Epub 2016 Mar 22. Circ Res. 2016. PMID: 27006445 Free PMC article.
-
Nicotine promotes atherosclerosis via ROS-NLRP3-mediated endothelial cell pyroptosis.Cell Death Dis. 2018 Feb 7;9(2):171. doi: 10.1038/s41419-017-0257-3. Cell Death Dis. 2018. PMID: 29416034 Free PMC article.
-
NLRP3 inflammasome: Its regulation and involvement in atherosclerosis.J Cell Physiol. 2018 Mar;233(3):2116-2132. doi: 10.1002/jcp.25930. Epub 2017 May 23. J Cell Physiol. 2018. PMID: 28345767 Review.
-
Mechanisms of homocysteine-induced atherothrombosis.J Thromb Haemost. 2005 Aug;3(8):1646-54. doi: 10.1111/j.1538-7836.2005.01364.x. J Thromb Haemost. 2005. PMID: 16102030 Review.
Cited by
-
Tyrosine Kinase Inhibitor Lenvatinib Causes Cardiotoxicity by Inducing Endoplasmic Reticulum Stress and Apoptosis through Activating ATF6, IRE1α and PERK Signaling Pathways.Recent Pat Anticancer Drug Discov. 2025;20(2):168-184. doi: 10.2174/0115748928265981231204044653. Recent Pat Anticancer Drug Discov. 2025. PMID: 38994620
-
TRIM21 Promotes Endothelial Cell Activation via Accelerating SOCS3 Ubiquitination Degradation in Atherosclerosis.Cardiovasc Toxicol. 2025 Mar;25(3):395-410. doi: 10.1007/s12012-025-09965-7. Epub 2025 Feb 8. Cardiovasc Toxicol. 2025. PMID: 39921798
-
The serum lipid profiles in immune thrombocytopenia: Mendelian randomization analysis and a retrospective study.Thromb J. 2023 Oct 13;21(1):107. doi: 10.1186/s12959-023-00551-x. Thromb J. 2023. PMID: 37833799 Free PMC article.
-
Autophagy and Its Association with Macrophages in Clonal Hematopoiesis Leading to Atherosclerosis.Int J Mol Sci. 2025 Apr 1;26(7):3252. doi: 10.3390/ijms26073252. Int J Mol Sci. 2025. PMID: 40244103 Free PMC article. Review.
-
WTAP Promotes Atherosclerosis by Inducing Macrophage Pyroptosis and M1 Polarization through Upregulating NLRP3.Appl Biochem Biotechnol. 2025 Apr;197(4):2397-2416. doi: 10.1007/s12010-024-05106-y. Epub 2025 Jan 2. Appl Biochem Biotechnol. 2025. PMID: 39747738
References
-
- Espitia-Corredor JA, Boza P, Espinoza-Perez C, Lillo JM, Rimassa-Tare C, Machuca V, et al. Angiotensin II triggers NLRP3 inflammasome activation by a Ca(2+) signaling-dependent pathway in rat cardiac fibroblast Ang-II by a Ca(2+)-dependent mechanism triggers NLRP3 inflammasome in CF. Inflammation. 2022;45(6):2498–2512. doi: 10.1007/s10753-022-01707-z. - DOI - PubMed
Publication types
MeSH terms
Substances
LinkOut - more resources
Full Text Sources
Medical
Miscellaneous
