. 2023 Jun 12;30(1):39.
doi: 10.1186/s12929-023-00937-z.

Krüppel-like factor 10 modulates stem cell phenotypes of pancreatic adenocarcinoma by transcriptionally regulating notch receptors

Affiliations

Krüppel-like factor 10 modulates stem cell phenotypes of pancreatic adenocarcinoma by transcriptionally regulating notch receptors

Yi-Chih Tsai et al. J Biomed Sci. .

Abstract

Background: Pancreatic adenocarcinoma (PDAC) is well known for its rapid distant metastasis and local destructive behavior. Loss of Krüppel-like factor 10 (KLF10) contributes to distant migration of PDAC. The role of KLF10 in modulating tumorigenesis and stem cell phenotypes of PDAC is unclear.

Methods: Additional depletion of KLF10 in KC (LSL: KrasG12D; Pdx1-Cre) mice, a spontaneous murine PDAC model, was established to evaluate tumorigenesis. Tumor specimens of PDAC patients were immune-stained of KLF10 to correlate with local recurrence after curative resection. Conditional overexpressing KLF10 in MiaPaCa and stably depleting KLF10 in Panc-1 (Panc-1-pLKO-shKLF10) cells were established for evaluating sphere formation, stem cell markers expression and tumor growth. The signal pathways modulated by KLF10 for PDAC stem cell phenotypes were disclosed by microarray analysis and validated by western blot, qRT-PCR, luciferase reporter assay. Candidate targets to reverse PDAC tumor growth were demonstrated in murine model.

Results: KLF10, deficient in two-thirds of 105 patients with resected pancreatic PDAC, was associated with rapid local recurrence and large tumor size. Additional KLF10 depletion in KC mice accelerated progression from pancreatic intraepithelial neoplasia to PDAC. Increased sphere formation, expression of stem cell markers, and tumor growth were observed in Panc-1-pLKO-shKLF10 compared with vector control. Genetically or pharmacologically overexpression of KLF10 reversed the stem cell phenotypes induced by KLF10 depletion. Ingenuity pathway analysis and gene set enrichment analysis showed that Notch signaling molecules, including Notch receptors 3 and 4, were over-expressed in Panc-1-pLKO-shKLF10. KLF10 transcriptionally suppressed Notch-3 and -4 by competing with E74-like ETS transcription factor 3, a positive regulator, for promoter binding. Downregulation of Notch signaling, either genetically or pharmacologically, ameliorated the stem cell phenotypes of Panc-1-pLKO-shKLF10. The combination of metformin, which upregulated KLF10 expression via phosphorylating AMPK, and evodiamine, a non-toxic Notch-3 methylation stimulator, delayed tumor growth of PDAC with KLF10 deficiency in mice without prominent toxicity.

Conclusions: These results demonstrated a novel signaling pathway by which KLF10 modulates stem cell phenotypes in PDAC through transcriptionally regulating Notch signaling pathway. The elevation of KLF10 and suppression of Notch signaling may jointly reduce PDAC tumorigenesis and malignant progression.

Keywords: ELF3; Krüppel-like factor 10; Notch signaling; Notch-3/4; Pancreatic adenocarcinoma.


Conflict of interest statement

The authors declare no competing interests.

Figures
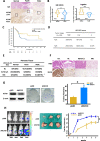
Fig. 1
Fig. 1
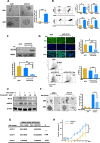
KLF10 deficiency correlated with accelerated pancreatic tumor growth. A Representative H&E (upper panel) and KLF10 immunostaining (middle and lower panel) of human pancreatic normal tissues (left panel), intraepithelial pancreatic neoplasm (PanIN, middle panel), and invasive pancreatic adenocarcinoma (PDAC, right panel). Original magnification: ×100 (mid-panel), ×400 (lower panel). B Violin plots of KLF10 transcript levels of pancreatic normal (yellow) versus tumor (blue) tissues from two representative databases of Gene Expression Omnibus 16515 (n = 52) and Oncomine Logsdon n = 20). *p < 0.05 and **p < 0.01, respectively. C Local recurrence-free survival curves of 105 patients of resected PDAC with low (n = 66) versus high (n = 39) expression of KLF10 immunostaining as described in “Materials and methods” (HR: 1.70, p = 0.092). D Tumor stage (T1/2 versus T3/4) of 105 patients of resected PDAC with high and low expression of KLF10 immunostaining as described in “Materials and methods”. For T3/4, p = 0.076. E Malignant progression to PanIN or PDAC of pancreas tissue in 18 to 24 week-old transgenic mice including Pdx-1-Cre/LSL-K-RasG12D (KC), Pdx-1-Cre/LSL-KLF10 (KLF10 L/L) and Pdx-1-Cre/LSL-KrasG12D/LSL-KLF10 (KKC) mice. *p < 0.05. F Representative H&E (upper panel) and KLF10 staining (lower panel) of pancreas tissue from KC, KLF10 L/L and KKC mice of 18 to 24 week-old. G Representative immunoblots (left panel) and colony formation (middle panel) of Panc-1 cells with vector control (pLKO) or KLF10mRNA silencing (shKLF10). Quantitative bar graphs (right panel) represent cumulated data from three independent experiments of colony formation assay. *p < 0.05. H Representative images of IVIS during 2–6 weeks after tumor implantation (left panel) and resected tumors at 6th week (middle panel) from orthotopic murine model of Panc-1 pLKO (yellow) and Panc-1-pLKO-shKLF10 (blue) as described in “Materials and methods”. Cumulated IVIS signal (right panel) of at least six mice in each experimental group that were injected with Panc-1-pLKO and Panc-1-pLKO-shKLF10 as indicated. Each point represents mean ± standard error (SE). *p < 0.05
Fig. 2
Fig. 2
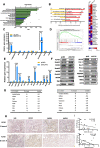
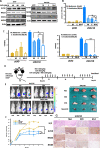
KLF10 modulated stem cell phenotypes of PDAC. A Representative pictures of sphere formation (left panel) of Panc-1-pLKO and Pan-1-pLKO-shKLF10 cells. Original magnification: (left upper panels) 1 × 100, (left lower panels) 1 × 400. Quantitative bar plots (right panel) represent mean ± SE of cumulated data from three independent experiments. **p < 0.01. B Representative flow cytometry (left panel) of stem cell markers including CD44, CD24, c-MET and CD326 of Panc-1-pLKO and Panc-1-pLKO-shKLF10. Quantitative bar plots (right panel) represent mean ± SE of cumulated data from three independent experiments of flow cytometry measuring each stem cell markers. *p < 0.05 and **p < 0.01, respectively. C (Upper panel) immunoblots of KLF10 expression in MiaPaCa cells with conditional overexpression of KLF10 (pLVX-KLF10) as described in “Materials and methods”. Dox represents doxycylin. β-Actin was used as internal control. (Lower panel) Quantitative bar plots of sphere formation from three independent data of MiaPaCa cells with pLVX vector control or MiaPaCa-pLVX-KLF10 treated without or with Dox. **p < 0.01. D (Left upper panels) immunofluorescence staining of CD47 (green) in MiaPaCa-pLVX or MiaPaCa-pLVX-KLF10 without or with Dox. Nuclei were counterstained with DAPI. Quantitative bar plots (right upper panel) represent mean ± SE from three independent experiments. *p < 0.05 and **p < 0.01, respectively. (Lower left panels) representative flow cytometry of CD24 expression of MiaPaCa-pLVX, and MiaPaCa-pLVX-KLF10 without or with Dox treatment. (Lower right panel) quantitative bar plots represent mean ± SE from three independent experiments. **p < 0.01. E Representative immunoblots of KLF10 and phospho-AMPK in Panc-1 cells treated without or with 2 mM metformin and 0–30 µM Compound C as described in “Materials and methods”. F Representative images, ×100 (left upper panels) and ×400 (left lower panel), of sphere formation from Panc-1-pLKO and Panc-1-pLKO-shKLF10 treated without or with 2 mM metformin as described in “Materials and methods”. Quantitative bar plots (right panel) of mean ± SE from cumulated data of three independent experiments. *p < 0.05. G In vivo limiting dilution assay. Number of mice with tumor growth after implanted subcutaneously with Panc-1-pLKO and Panc-1-LKO-shKLF10 cells of various cell number indicated as described in “Materials and methods”. H Tumor growth curves of mice after 1 × 104 cells of Panc-1-pLKO and Panc-1-pLKO-shKLF10 implanted. Each point represents mean ± SE of cumulated data from at least six mice. *p < 0.05
Fig. 3
Fig. 3
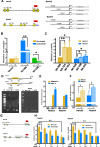
KLF10 deficiency facilitated the Notch signal pathway. A The most differentially expressed “cancer signaling pathways” associated with KLF10 depletion in Panc-1 cells by IPA. Graphs in green or blue show category scores as − log [p-value]. Ratio (black dot) indicates the molecules from the data set that map to the pathway listed divided by the total number of molecules that map to the pathway from within the IPA database. B The most enriched pathways associated with Panc-1-pLKO-shKLF10 cells by GSEA analysis. Red indicates positive and yellow indicates negative normalized enrichment score. C Quantitative RT-PCR of candidate signal pathways molecules related to stem cell phenotypes were measured in Panc-1-pLKO (yellow) and Panc-1-pLKO-shKLF10 (blue) cells. Data were presented in mean ± SE from cumulated results of three independent experiments. ***p < 0.005. D GSEA analysis of Panc-1-pLKO-shKLF10 versus Panc-1-pLKO showing upregulated HALLMARK_NOTCH_SIGNALING (left panel). Heat map of Notch signal pathway molecules expression of Panc-1-pLKO and Panc-1-pLKO-shKLF10 cells in GSEA analysis (right panel). E Quantitative RT-PCR of candidate molecules of Notch signal pathway in Panc-1-pLKO (yellow) and Panc-1-pLKO-shKLF10 (blue) cells. Data were presented in mean ± SE from cumulated results of three independent experiments. **p < 0.01 and ***0.005, respectively. F Representative immunoblots of Notch signal pathway molecules in Panc-1-pLKO and Panc-1-pLKO-shKLF10 cells. β-Actin was used as internal control. G Representative databases from Oncomine showing mild to moderate inverse correlation between the transcript levels of KLF10 versus Notch-3 (left panel); and KLF10 versus Notch-4 (right panel). H (Left panel) representative IHC staining of KLF10, NICD-3 and -4 in tumor tissues from two patients of PDAC showing low (upper panel, EI score = 4) and high (lower panel, EI score = 9) KLF10 expression. (Right panel) correlation of KLF10 versus NICD-3 (upper panel, n = 31) and KLF10 versus NICD-4 (lower panel, n = 29) expression on IHC in pancreatic tumors tissues from the cohort mentioned in “Materials and methods”. The correlation coefficients R were − 0.16 and − 0.3 with p = 0.05 and 0.04, respectively
Fig. 4
Fig. 4
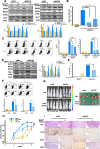
KLF10 competed with ELF3 and transcriptionally suppressed Notch-3 and -4. A Primer maps with predicted SP-1/KLF10 binding sites (left panel, predicted p < 0.001) and various designed deletion (right panel) of promoter regions of Notch-3 and -4 for luciferase reporter assay. B Luciferase activity of Panc-1 cells transfected with vector control (yellow), Notch-3(blue), and Notch-4(green) gene promoter plasmids without (filled) or with (diagonal stripe) hemagglutinin (HA) tagged-KLF10 transfection (OE). The bar graphs were mean ± SE from cumulated data of three independent experiments. *p < 0.05 and **p < 0.01, respectively. C Luciferase activity of Panc-1 cells, transfected with Notch-3 (yellow) or Notch-4 (blue) gene promoter plasmids with full length (filled) or with various deletion (diagonal stripe, diagonal check) indicated. The bar graphs were mean ± SE from cumulated data of three independent experiments. *p < 0.05 and **p < 0.01, respectively. D (Upper panel) primer maps of Notch-3/4 gene promoters for CHIP-PCR assay. (Lower panel) CHIP assay. DNA fragments of Panc-1 cells were immune-precipitated with KLF10, IgG or positive control (P) followed by PCR amplification of the Notch-3/4 gene promoter region that contains KLF10 binding sites (input), as described in “Materials and methods” section. E Quantitative PCR of the Notch-3/4 gene promoter region using samples from MiaPaCa (yellow) or Panc-1 (blue) cells prepared as described in D. The bar graphs were mean ± SE from cumulated data of three independent experiments. F MiaPaCa cells with conditional over-expression of KLF10 under Dox treatment were immuno-precipitated with KLF10 antibody and quantitative PCR of the Notch-3 (yellow) and Notch-4 (blue) gene promoter regions. The bar graphs were mean ± SE from cumulated data of three independent experiments. *p < 0.05. G Primer maps of predicted ELF3 binding sites on the promoter regions of Notch-3 (upper panel) and Notch-4 (left panel) genes. H Luciferase reporter assays of Notch-3 (left panel) and Notch-4 (right panel) under conditions of various combination of HA-KLF10 and ELF3 (yellow) and ELF3-mutant (ELF3-S68A, blue) as indicated. The bar graphs were mean ± SE from cumulated data of three independent experiments. **p < 0.01
Fig. 5
Fig. 5
Inhibition of Notch signal reversed stem cell phenotypes induced by KLF10 depletion. A (Upper panels) representative immunoblots of KLF10 and Notch signal pathway molecules as indicated in Panc-1-pLKO or Panc-1-pLKO-shKLF10 cells without or with Notch-3 (left panel) or Notch-4 (right panel) genes silencing. β-Actin was used as internal control. (Lower panels) the bar graphs were mean ± SE from cumulated data of three independent experiments. Levels of signal molecule expression in Panc-1-pLKO (yellow) or Panc-1-pLKO-shKLF10 (blue) cells without (filled) or with Notch 3/4 (shN3/4, diagonal stripe) receptor mRNA silencing were measured. *p < 0.05. B Sphere formation of Panc-1-pLKO (yellow) or Panc-1-pLKO-shKLF10 (blue) cells without (filled) or with Notch 3 (shN3, diagonal stripe) or Notch 4 (shN4, diagonal check) receptor mRNA silencing. The bar graphs were mean ± SE from cumulated data of three independent experiments. *p < 0.05 and **p < 0.01, respectively. C (Left panels) representative flow cytometry of CD24 and c-Met on Panc-1-pLKO (upper panels) and Panc-1-pLKO-shKLF10 (lower panels) cells without or with Notch-3/4 mRNA silencing as indicated. (right panels) Expression of CD24 (left panel) and c-Met (right panel) on Panc-1-pLKO (yellow) or Panc-1-pLKO-shKLF10 (blue) cells without (filled) or with Notch-3 (sN3, diagonal stripe) or Notch-4 (sN4, diagonal check) mRNA silencing. The bar graphs were mean ± SE from cumulated data of three independent experiments. **p < 0.01 and ***p < 0.005, respectively. D (Left panel) representative immunoblots of KLF10 and Notch signal molecules in Panc-1-pLKO or Panc-1-pLKO-shKLF10 cells without or with 20 µM DAPT treatment. β-Actin was used as internal control. (Right panel) the bar graphs were mean ± SE from cumulated data of three independent experiments. Levels of signal molecule expression in Panc-1-pLKO (yellow) or Panc-1-pLKO-shKLF10 (blue) cells without (filled) or with DAPT (diagonal stripe) treatment were measured. *p < 0.05. E Sphere formation of Panc-1-pLKO (yellow) or Panc-1-pLKO- shKLF10 (blue) cells without (filled) or with (diagonal stripe) 20 µM DAPT treatment. The bar graphs were mean ± SE from cumulated data of three independent experiments. *p < 0.05. F (Upper panels) representative flow cytometry of CD24 and c-Met on Panc-1-pLKO (left panels) and Panc-1-pLKO-shKLF10 (right panels) cells without or with DAPT treatment as indicated. (Lower panels) expression of CD24 (left panel) and c-Met (right panel) on Panc-1-pLKO (yellow) or Panc-1-pLKO-shKLF10 (blue) cells without (filled) or with (diagonal stripe) 20 µM DAPT treatment. The bar graphs were mean ± SE from cumulated data of three independent experiments. *p < 0.05. G Representative IVIS images of mice at 2–6 weeks after implanting orthotopically with Panc-1-pLKO or Panc-1-pLKO-shKLF10 cells without or with DAPT 15 mg/kg intra-peritoneally for 3 weeks as described in “Materials and methods” (left panel). Representative photos of tumors resected from mice experiments mentioned above (right panel). H Cumulated IVIS signal of at least six mice in each experimental group that were implanted with Panc-1-pLKO (yellow) and Panc-1-pLKO-shKLF10 (blue) without (solid) or with (dashed line) DAPT treatment for 3 weeks as indicated. Each point represents mean ± SE. *p < 0.05. I Representative H&E (upper panel) and IHC staining, as described in “Materials and methods”, of KLF10, NICD-3 and -4, as indicated, in tumors resected from mice experiments of G
Fig. 6
Fig. 6
Metformin and evodiamine cooperatively reduced stem cell phenotypes and tumor growth of PDAC. A Representative immunoblots of KLF10 and NICD-1, -3, and -4 in Panc-1 cells treated with various dosage of evodiamine (EVO) as indicated. β-Actin was used as internal control (left panel). Representative immunoblots of KLF10 and NICD-3 and -4 in Panc-1-shKLF10 treated with combination of 2 mM metformin (M) and/or 80 µM evodiamine (E) (right panel). B Sphere formation of Panc-1-pLKO (yellow) and Panc-1-pLKO-shKLF10 (blue) without treatment (filled) or treated with metformin alone (diagonal stripe) evodiamine alone (diagonal check) or with combination treatment (unfilled). The bar graphs were mean ± SE from cumulated data of three independent experiments. *p < 0.05. C Expression of CD24 (left panel) and c-MET (right panel) on Panc-1-pLKO (yellow) and Panc-1-pLKO-shKLF10 (blue) without treatment (filled), treated with metformin alone (diagonal stripe), with evodiamine alone (diagonal check), or with combination treatment (unfilled). The bar graphs were mean ± SE from cumulated data of three independent experiments. *p < 0.05 and **p < 0.001 respectively. D Schema of orthotopic murine model treated with metformin (120 mg/kg) and/or evodiamine (15 or 30 mg/kg). E (Left panel) representative IVIS images of mice bearing Panc-1-shKLF10 and treated with metformin (Met) and/or evodiamine (EVO). (Right panel) representative photos of tumors resected from murine experiments mentioned above. F Cumulated IVIS signal of at least six mice in each experimental group that were implanted with Panc-1-shKLF10 and received PBS (dashed yellow), metformin alone (solid yellow), evodiamine alone (dashed blue), or combination (solid blue) for 3 weeks, as indicated. Each point represents mean ± SE. *p < 0.05 and **p < 0.01. G Representative H&E (upper panel) and IHC staining, as described in “Materials and methods”, of KLF10, NICD-3 and NICD-4, as indicated, in tumors resected from mice experiments of E
Fig. 7
Fig. 7
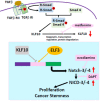
KLF10/Notch signal pathway in modulating proliferation and stemness of PDAC. Loss of KLF10, due to epigenetic, transcriptional regulation or protein degradation in PDAC, interferes the balance of ELF3 and KLF10 competing for activation and suppression, respectively, of the Notch-3 and -4 promoter activity which modulates cancer cell proliferation and stemness phenotypes. Elevating KLF10 expression level by metformin, upregulating Notch 3 transcription by evodiamine or NICD by DAPT, ameliorates PDAC progression induced by KLF10 deficiency

Similar articles

Cited by

References

    1. Ercan G, Karlitepe A, Ozpolat B. Pancreatic cancer stem cells and therapeutic approaches. Anticancer Res. 2017;37(6):2761–2775. - PubMed
    1. Hwang YC, Yang CH, Lin CH, Ch'ang HJ, Chang VHS, Yu WCY. Destabilization of KLF10, a tumor suppressor, relies on thr93 phosphorylation and isomerase association. Biochim Biophys Acta. 2013;1833(12):3035–3045. doi: 10.1016/j.bbamcr.2013.08.010. - DOI - PubMed
    1. Chang VH, Chu PY, Peng SL, Mao TL, Shan YS, Hsu CF, Lin CY, Tsai KK, Yu WC, Ch'ang HJ. Kruppel-like factor 10 expression as a prognostic indicator for pancreatic adenocarcinoma. Am J Pathol. 2012;181(2):423–430. doi: 10.1016/j.ajpath.2012.04.025. - DOI - PubMed
    1. Tachibana I, Imoto M, Adjei PN, Gores GJ, Subramaniam M, Spelsberg TC, Urrutia R. Overexpression of the TGFbeta-regulated zinc finger encoding gene, TIEG, induces apoptosis in pancreatic epithelial cells. J Clin Invest. 1997;99(10):2365–2374. doi: 10.1172/JCI119418. - DOI - PMC - PubMed
    1. Weng CC, Hawse JR, Subramaniam M, Chang VHS, Yu WCY, Hung WC, Chen LT, Cheng KH. KLF10 loss in the pancreas provokes activation of SDF-1 and induces distant metastases of pancreatic ductal adenocarcinoma in the Kras(G12D) p53(flox/flox) model. Oncogene. 2017;36(39):5532–5543. doi: 10.1038/onc.2017.155. - DOI - PubMed

Substances