. 2023 Jun 12;11(1):92.
doi: 10.1186/s40478-023-01583-0.

Mass cytometric analysis of the immune cell landscape after traumatic brain injury elucidates the role of complement and complement receptors in neurologic outcomes

Affiliations

Mass cytometric analysis of the immune cell landscape after traumatic brain injury elucidates the role of complement and complement receptors in neurologic outcomes

Amer Toutonji et al. Acta Neuropathol Commun. .

Abstract

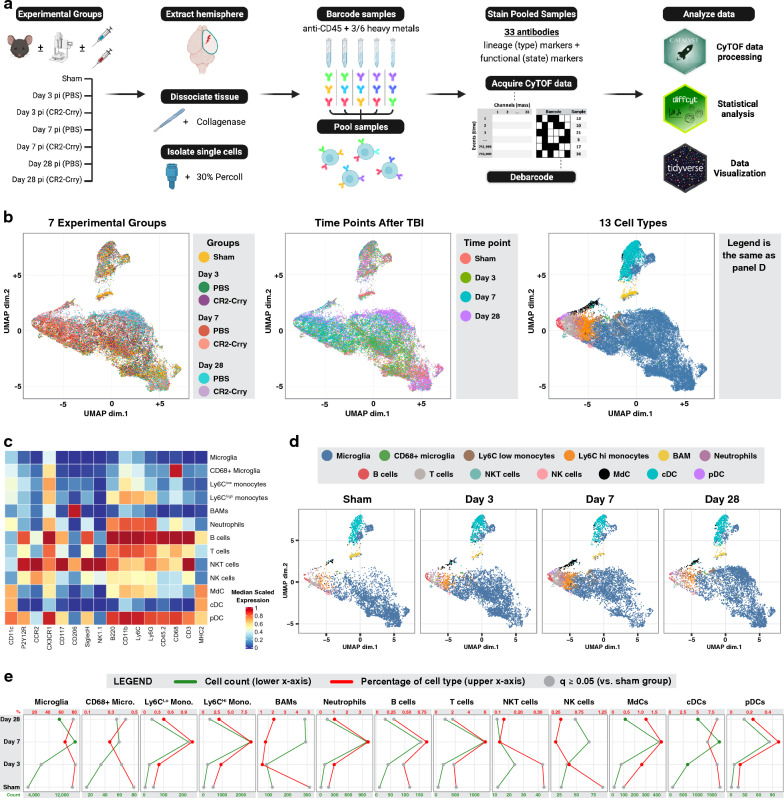
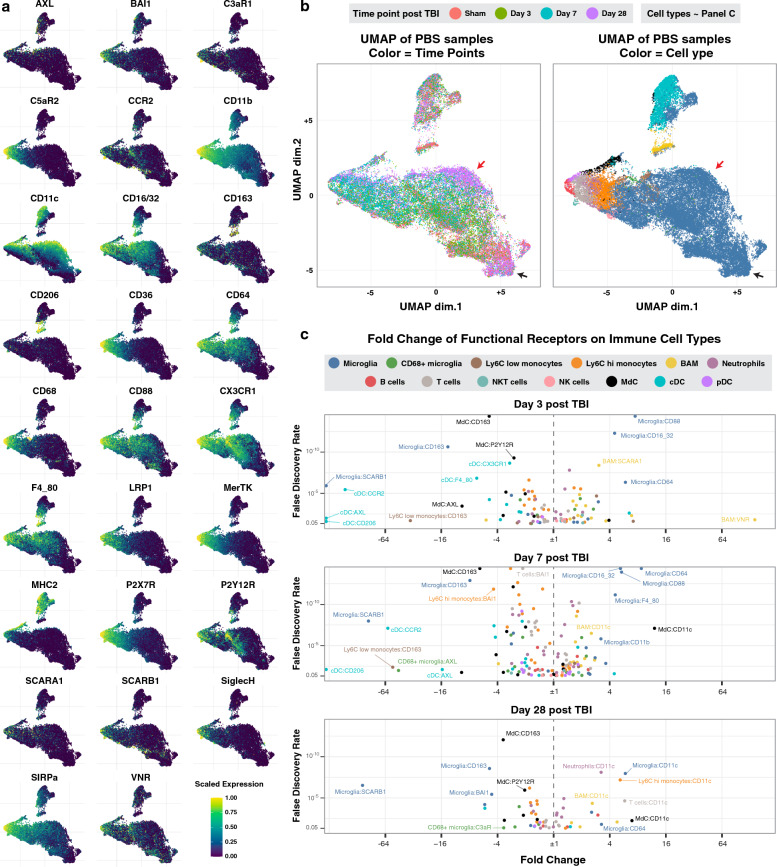
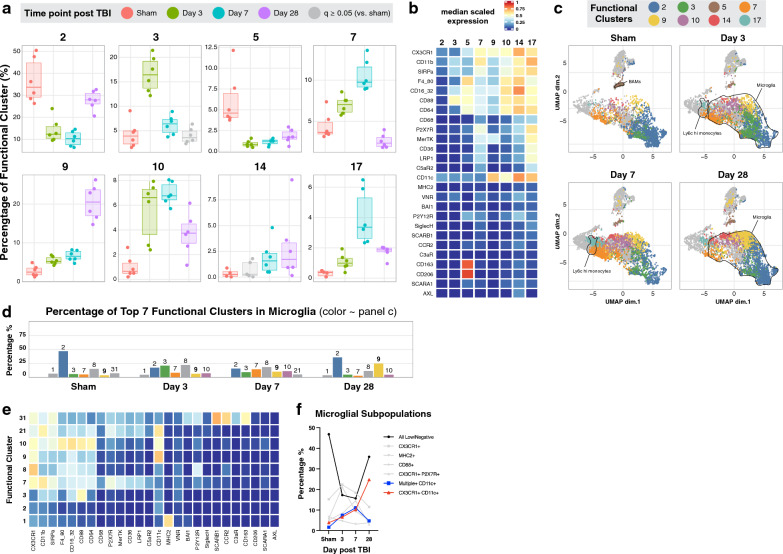
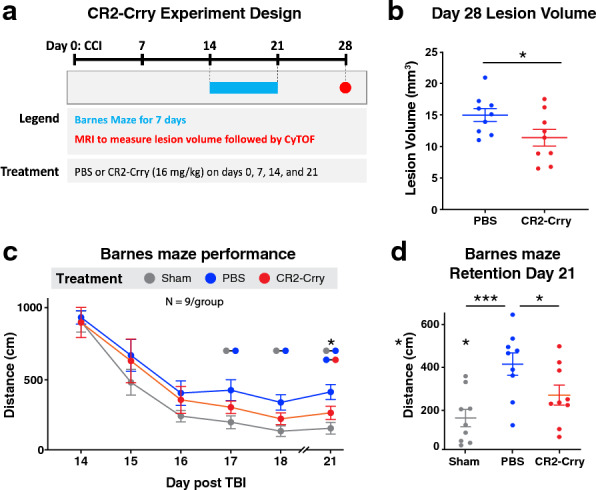
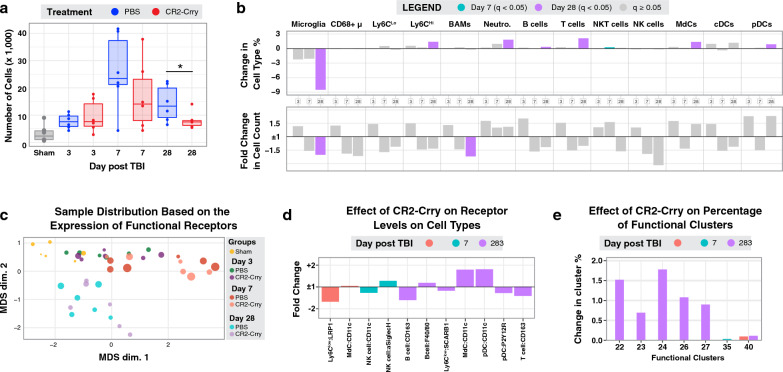
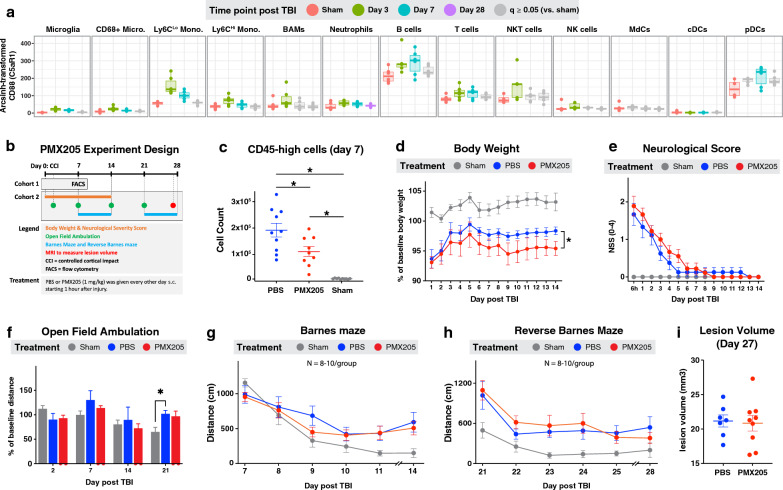
Following traumatic brain injury (TBI), a neuroinflammatory response can persist for years and contribute to the development of chronic neurological manifestations. Complement plays a central role in post-TBI neuroinflammation, and C3 opsonins and the anaphylatoxins (C3a and C5a) have been implicated in promoting secondary injury. We used single cell mass cytometry to characterize the immune cell landscape of the brain at different time points after TBI. To specifically investigate how complement shapes the post-TBI immune cell landscape, we analyzed TBI brains in the context of CR2-Crry treatment, an inhibitor of C3 activation. We analyzed 13 immune cell types, including peripheral and brain resident cells, and assessed expression of various receptors. TBI modulated the expression of phagocytic and complement receptors on both brain resident and infiltrating peripheral immune cells, and distinct functional clusters were identified within same cell populations that emerge at different phases after TBI. In particular, a CD11c+ (CR4) microglia subpopulation continued to expand over 28 days after injury, and was the only receptor to show continuous increase over time. Complement inhibition affected the abundance of brain resident immune cells in the injured hemisphere and impacted the expression of functional receptors on infiltrating cells. A role for C5a has also been indicated in models of brain injury, and we found significant upregulation of C5aR1 on many immune cell types after TBI. However, we demonstrated experimentally that while C5aR1 is involved in the infiltration of peripheral immune cells into the brain after injury, it does not alone affect histological or behavioral outcomes. However, CR2-Crry improved post-TBI outcomes and reduced resident immune cell populations, as well as complement and phagocytic receptor expression, indicating that its neuroprotective effects are mediated upstream of C5a generation, likely via modulating C3 opsonization and complement receptor expression.

Keywords: Complement; Complement inhibition; Mass cytometry; Microglia; Neuroinflammation; Traumatic brain injury.


Conflict of interest statement

The authors declare no competing interests.

Figures

Fig. 1
Fig. 1
Temporal analysis of resident and infiltrating peripheral immune cells in the brain after TBI. A Graphical workflow of the mass cytometry experiment including the isolation of immune cells from the brains of 7 experimental groups, the staining and processing of the cells, and the R packages used to analyze the data. B A lineage UMAP showing a total of 42,000 cells (1000 per sample) plotted based on the expression of lineage markers. Four versions are shown color-coded respectively by the experimental group, the time point after traumatic brain injury, the 40 lineage clusters returned by the FlowSOM algorithm, and the 13 immune cell types derived from the manual annotation of the 40 lineage clusters (see also Additional file 1: Fig. S1). C Heatmap showing lineage marker expression of the 13 identified cell types. D Lineage UMAP depicting cells from the sham and PBS-treated groups at days 3, 7, and 28 in separate subpanels, color-coded by the immune cell type. E Quantification of the cell count (green) and the percentage (red) of each of the 13 immune cell types in the sham and PBS-treated groups at days 3, 7, and 28. Data are represented as mean. Significant changes compared to the sham group are in green and red dots; non-significant changes are in gray. N = 6 per group. False discovery rate was used to adjust the p-value. Abbreviations: cDC = conventional dendritic cell, pDC = plasmacytoid dendritic cell, MdC = monocyte-derived cell
Fig. 2
Fig. 2
TBI modulates the expression of phagocytic and complement receptors on brain resident and infiltrating peripheral immune cells. A Lineage UMAPs of sham and PBS-treated experimental groups showing the relative expression of 26 functional markers. B The same lineage UMAPs color-coded by time point after TBI and immune cell types. Overlay visually with the UMAPs in panel A for an easier understanding of the dynamic expression of the functional markers by time point and cell type. C Volcano plots quantifying the fold change in immune cell expression of the functional markers at all time points in the PBS-treated group compared to the sham group (see also Additional file 1: Fig. S2). Each data point represents the mean in fold change for a receptor-cell type combination. N = 6 per group. False discovery rate was used to adjust the p-value. Abbreviations: cDC = conventional dendritic cell, pDC = plasmacytoid dendritic cell, MdC = monocyte-derived cell
Fig. 3
Fig. 3
The expression of functional markers identifies distinct subpopulations of immune cells that emerge at different phases after TBI. A FlowSOM clustering based on the expression of functional markers identified 40 functional clusters (see also Additional file 1: Fig. S3). In this panel, 8 functional clusters with high differential abundance at different time points are shown here. B Heatmap of the 8 functional clusters showing their median scaled expression of 26 functional markers. C Lineage UMAP color-coded by the 8 functional clusters to show their distribution amongst the 13 immune cell types. The percentage D and heatmap E (same scale as panel B) of the 7 most abundant microglial functional clusters per time point. F Summary of the abundance of distinct microglial functional clusters labeled by the most highly expressed functional markers. Data are shown as mean in panels D and F. A–F N = 6 per group. False discovery rate was used to adjust the p-value in panel A. Abbreviations: cDC = conventional dendritic cell, pDC = plasmacytoid dendritic cell, MdC = monocyte-derived cell
Fig. 4
Fig. 4
Complement inhibition improves histological and cognitive outcomes. A Brain lesion volume at day 28 after TBI in PBS vs CR2-Crry treated groups measured using MRI. B Barnes maze performance in week 3 after TBI in PBS vs CR2-Crry treated groups. C Performance on the retention day of the Barnes maze showing individual data points. Data are shown as mean ± SEM. N = 9 per group. Tissue samples were taken from 6 randomly chosen animals for the CyTOF analysis. Significance was calculated in A using unpaired t-test and in B-C using 1-way Anova with Bonferroni post-test (*p < 0.05, ***p < 0.001)
Fig. 5
Fig. 5
Complement inhibition affects the abundance of brain resident immune cells and the expression of functional receptors on infiltrating cells in the injured hemisphere. A Number of immune cells per experimental group and sample as identified by the expression of CD45 in the CyTOF panel. Data was acquired from ~ 62,000 cells from the injured hemisphere. The number of immune cells shown is normalized by the total number of isolated cells (see methods). B Summary of the change in percentage and the fold change in cell count of each immune cell type at days 3, 7 and 28 after TBI compared to the sham group. Non-significant changes are in gray. C MDS plot summarizing the differences in functional receptor expression among all 42 samples. The circle size is proportional to the number of immune cells in the sample. D, E Summary of all the significant changes in the expression of functional receptors by immune cell types D and percentage of functional clusters E upon treatment with CR2-Crry. Data are shown as mean and color-coded for statistical significance in panels B, D and E. N = 6 per group. *p < 0.05. Bonferroni correction was used for multiple comparisons in panel A. False discovery rate was used to adjust the p-value in the other panels. Abbreviations: cDC = conventional dendritic cell, pDC = plasmacytoid dendritic cell, MdC = monocyte-derived cell
Fig. 6
Fig. 6
C5aR1 antagonist PMX205 reduces immune cell recruitment to injured hemisphere but has no impact on neurological outcomes following TBI. A Summary of C5aR1 expression by the 13 immune cell types identified by CyTOF. Non-significant changes (compared to the sham group) are in gray. B Graphical summary of the PMX205 experiment. Injured groups received PBS or PMX205. Sham (control) group was included. C Total number of CD45high cells (immune cells) extracted from the injured brain hemispheres in cohort 1 and quantified by flow cytometry. N = 9–10 per group. DI Summary of the behavioral outcomes and lesion volume over 28 days after TBI. N = 8–10 per group. CI Data are shown as mean ± SEM. *p < 0.05. False discovery rate was used to adjust the p-value in panel A. Repeated measures ANOVA was used in panel D. Bonferroni correction was used for multiple comparisons in the panels. Abbreviations: cDC = conventional dendritic cell, pDC = plasmacytoid dendritic cell, MdC = monocyte-derived cell

Similar articles

Cited by

References

    1. Johnson VE, et al. Inflammation and white matter degeneration persist for years after a single traumatic brain injury. Brain. 2013;136(Pt 1):28–42. doi: 10.1093/brain/aws322. - DOI - PMC - PubMed
    1. Mendez MF. What is the relationship of traumatic brain injury to dementia? J Alzheimers Dis. 2017;57(3):667–681. doi: 10.3233/JAD-161002. - DOI - PubMed
    1. Lozano D, et al. Neuroinflammatory responses to traumatic brain injury: etiology, clinical consequences, and therapeutic opportunities. Neuropsychiatr Dis Treat. 2015;11:97–106. - PMC - PubMed
    1. Stahel PF, et al. Intrathecal levels of complement-derived soluble membrane attack complex (sC5b-9) correlate with blood-brain barrier dysfunction in patients with traumatic brain injury. J Neurotrauma. 2001;18(8):773–781. doi: 10.1089/089771501316919139. - DOI - PubMed
    1. Bao W, et al. Complement cascade on severe traumatic brain injury patients at the chronic unconscious stage: implication for pathogenesis. Expert Rev Mol Diagn. 2018;18(8):761–766. doi: 10.1080/14737159.2018.1471985. - DOI - PubMed

Publication types

Substances