

Pyramiding wheat pre-harvest sprouting resistance genes in triticale breeding
- PMID: 37309488
- PMCID: PMC10248708
- DOI: 10.1007/s11032-022-01327-3
Pyramiding wheat pre-harvest sprouting resistance genes in triticale breeding
Abstract
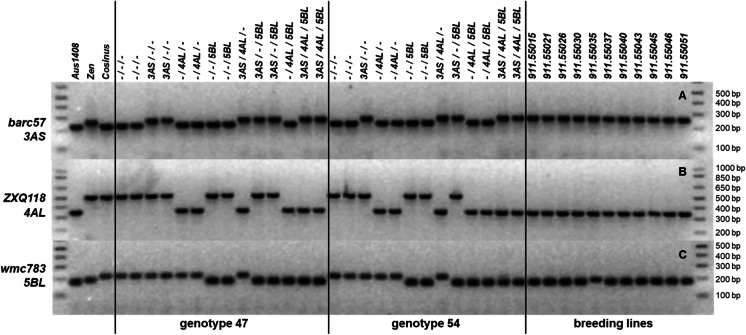
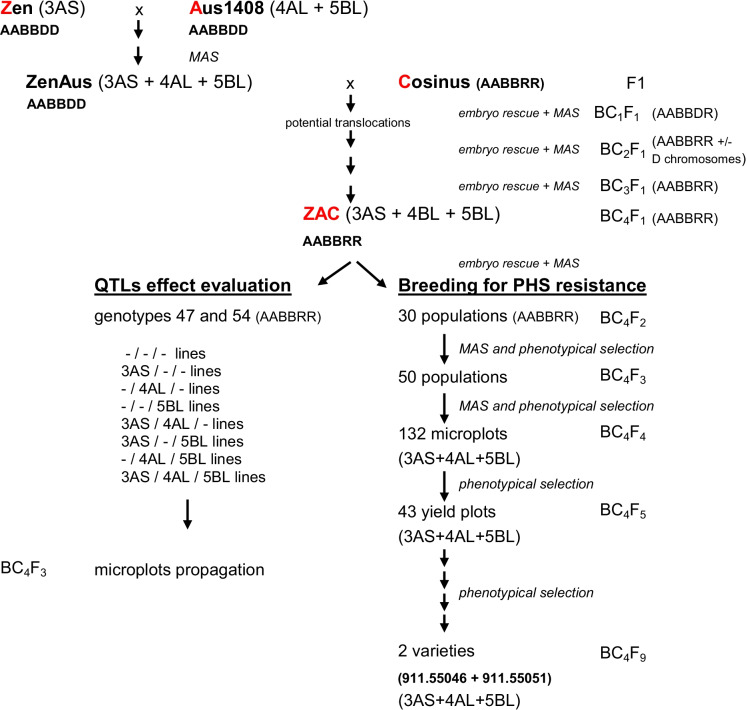
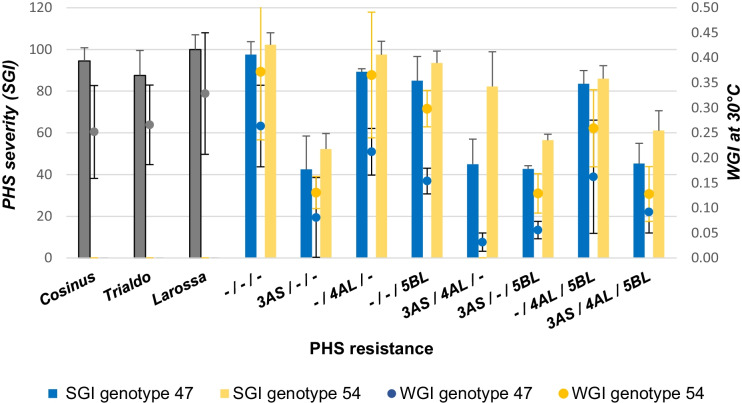
Pre -harvest sprouting (PHS) is an important problem in cereal production reducing yield and grain quality. After decades of improvement, triticale remains particularly susceptible to PHS but no resistance genes or QTLs were identified so far in this species. As wheat shares the A and B genomes with triticale, wheat PHS resistance genes can be introgressed into triticale genome by recombination after interspecific crosses. In this project, three PHS resistance genes have been transferred from wheat to triticale by marker-assisted interspecific crosses, followed by four backcrosses. The gene TaPHS1 from the 3AS chromosome of cultivar Zenkoujikomugi (Zen) and the TaMKK3 and TaQsd1, respectively located on the 4AL and 5BL chromosomes derived both from cultivar Aus1408, were pyramided in the triticale cultivar Cosinus. Only the TaPHS1 gene increases consistently the PHS resistance in triticale. The lack of efficacy of the other two genes, especially TaQsd1, could be the result of an imperfect linkage between the marker and the gene of interest. The introduction of PHS resistance genes did not alter agronomic nor disease resistance performances of triticale. This approach leads to two new, agronomically performant and PHS-resistant triticale cultivars. Today, two breeding triticale lines are ready to enter the official registration process.
Keywords: Breeding; Pre-harvest sprouting; TaMKK3; TaPHS1; TaQsd1; Triticale.
© The Author(s) 2022.
Conflict of interest statement
Conflict of interestThe authors declare no competing interests.
Figures


Similar articles
-
QTL mapping of pre-harvest sprouting resistance in a white wheat cultivar Danby.Theor Appl Genet. 2018 Aug;131(8):1683-1697. doi: 10.1007/s00122-018-3107-5. Epub 2018 Jun 2. Theor Appl Genet. 2018. PMID: 29860625
-
Genome-wide association analysis on pre-harvest sprouting resistance and grain color in U.S. winter wheat.BMC Genomics. 2016 Oct 12;17(1):794. doi: 10.1186/s12864-016-3148-6. BMC Genomics. 2016. PMID: 27729004 Free PMC article.
-
Haplotype Analysis of the Pre-harvest Sprouting Resistance Locus Phs-A1 Reveals a Causal Role of TaMKK3-A in Global Germplasm.Front Plant Sci. 2017 Sep 13;8:1555. doi: 10.3389/fpls.2017.01555. eCollection 2017. Front Plant Sci. 2017. PMID: 28955352 Free PMC article.
-
Review: Revealing the genetic mechanisms of pre-harvest sprouting in hexaploid wheat (Triticum aestivum L.).Plant Sci. 2019 Apr;281:180-185. doi: 10.1016/j.plantsci.2019.01.004. Epub 2019 Jan 9. Plant Sci. 2019. PMID: 30824050 Review.
-
Genetic Improvement of Wheat with Pre-Harvest Sprouting Resistance in China.Genes (Basel). 2023 Mar 30;14(4):837. doi: 10.3390/genes14040837. Genes (Basel). 2023. PMID: 37107595 Free PMC article. Review.
Cited by
-
The molybdenum cofactor biosynthesis gene, OsCNX1, is essential for seedling development and seed germination in rice.Mol Breed. 2023 Oct 26;43(11):77. doi: 10.1007/s11032-023-01424-x. eCollection 2023 Nov. Mol Breed. 2023. PMID: 37916037 Free PMC article.
-
Evaluation of TaMFT-3A and TaMKK3-4A alleles on wheat pre-harvest sprouting.Front Plant Sci. 2025 May 14;16:1594385. doi: 10.3389/fpls.2025.1594385. eCollection 2025. Front Plant Sci. 2025. PMID: 40438738 Free PMC article.
References
-
- Alaru M, Laur Ü, Lauringson E. Pre-harvest sprouting tolerance of different winter triticale cultivars in the Baltic Sea area. Acta Agric Scand Sect B Soil Plant Sci. 2008;58:11–16. doi: 10.1080/09064710601079575. - DOI
-
- Ali A, Cao J, Jiang H, Chang C, Zhang H-P, Sheikh SW, Shah L, Ma C. Unraveling molecular and genetic studies of wheat (Triticum aestivum L.) resistance against factors causing pre-harvest sprouting. Agronomy. 2019;9:117. doi: 10.3390/agronomy9030117. - DOI
-
- Barnard A, Smith MF. Determination of the influence of climate on falling number of winter wheat in the dryland production areas of the Free State Province of South Africa. Euphytica. 2012;188:15–24. doi: 10.1007/s10681-012-0673-5. - DOI
-
- Baskin JM, Baskin CC. A classification system for seed dormancy. Seed Sci Res. 2004;14:1–16. doi: 10.1079/SSR2003150. - DOI
LinkOut - more resources
Full Text Sources
Research Materials
