. 2023 Aug 3;11(8):1137-1155.
doi: 10.1158/2326-6066.CIR-22-0644.

β-Catenin Drives Butyrophilin-like Molecule Loss and γδ T-cell Exclusion in Colon Cancer

Affiliations

β-Catenin Drives Butyrophilin-like Molecule Loss and γδ T-cell Exclusion in Colon Cancer

Toshiyasu Suzuki et al. Cancer Immunol Res. .

Abstract

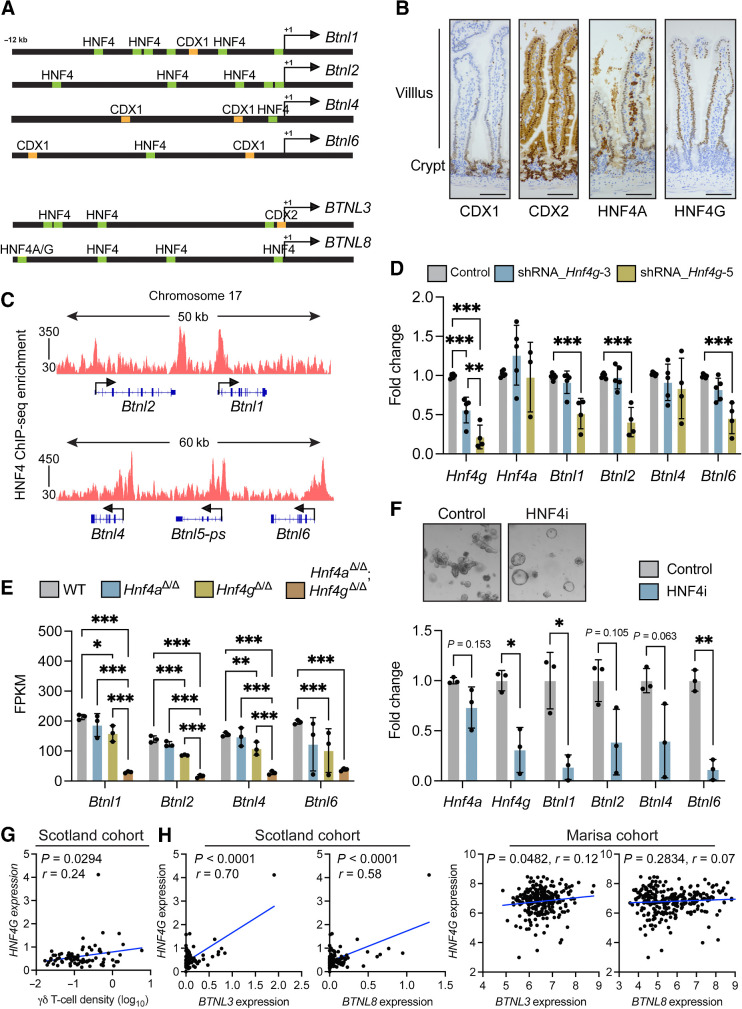
Intraepithelial lymphocytes (IEL) expressing γδ T-cell receptors (γδTCR) play key roles in elimination of colon cancer. However, the precise mechanisms by which progressing cancer cells evade immunosurveillance by these innate T cells are unknown. Here, we investigated how loss of the Apc tumor suppressor in gut tissue could enable nascent cancer cells to escape immunosurveillance by cytotoxic γδIELs. In contrast with healthy intestinal or colonic tissue, we found that γδIELs were largely absent from the microenvironment of both mouse and human tumors, and that butyrophilin-like (BTNL) molecules, which can critically regulate γδIEL through direct γδTCR interactions, were also downregulated in tumors. We then demonstrated that β-catenin activation through loss of Apc rapidly suppressed expression of the mRNA encoding the HNF4A and HNF4G transcription factors, preventing their binding to promoter regions of Btnl genes. Reexpression of BTNL1 and BTNL6 in cancer cells increased γδIEL survival and activation in coculture assays but failed to augment their cancer-killing ability in vitro or their recruitment to orthotopic tumors. However, inhibition of β-catenin signaling via genetic deletion of Bcl9/Bcl9L in either Apc-deficient or mutant β-catenin mouse models restored Hnf4a, Hnf4g, and Btnl gene expression and γδ T-cell infiltration into tumors. These observations highlight an immune-evasion mechanism specific to WNT-driven colon cancer cells that disrupts γδIEL immunosurveillance and furthers cancer progression.


Figures

Figure 1. Loss of Btnl1 increases adenoma formation in Apc-deficient mouse models. A, Images of SI from VA and VA;Btnl1—/— mice stained for Btnl1 mRNA representative of 4/group; scale bar, 100 μm. B, Images of SI from VA and VA;Btnl1—/— mice stained for Trdc mRNA; scale bar, 500 μm. γδ T-cell numbers in SI of indicated models. Each dot represents one mouse (n = 3). C, Kaplan–Meier survival analysis of VA (n = 15) and VA;Btnl1—/— (n = 6) mice. D, Tumor number and tumor burden (mm2) in SI and colon of VA and VA;Btnl1—/— mice. Each dot represents one mouse (n = 15 VA, 6 VA;Btnl1—/— mice). Data are presented as mean ± SD. *, P < 0.05; ***, P < 0.001 (unpaired t test).
Figure 1.
Loss of Btnl1 increases adenoma formation in Apc-deficient mouse models. A, Images of SI from VA and VA;Btnl1—/— mice stained for Btnl1 mRNA representative of 4/group; scale bar, 100 μm. B, Images of SI from VA and VA;Btnl1—/— mice stained for Trdc mRNA; scale bar, 500 μm. γδ T-cell numbers in SI of indicated models. Each dot represents one mouse (n = 3). C, Kaplan–Meier survival analysis of VA (n = 15) and VA;Btnl1—/— (n = 6) mice. D, Tumor number and tumor burden (mm2) in SI and colon of VA and VA;Btnl1—/— mice. Each dot represents one mouse (n = 15 VA, 6 VA;Btnl1—/— mice). Data are presented as mean ± SD. *, P < 0.05; ***, P < 0.001 (unpaired t test).
Figure 2. γδ T cells are excluded from mouse and human gut tumors. A, Images of SI tissue from 4 WT (Cre-negative), tumor-bearing Villin-CreERT2;ApcF/+ (VA) and tumor-bearing Villin-CreERT2;ApcF/+;KrasG12D (VAK) mice stained for Trdc mRNA; scale bar, 500 μm. B, γδ T-cell numbers in SI tissue of indicated models. Each dot represents one mouse (n = 11 WT, 3 VA, 3 VAK). C, Representative flow cytometry plot of CD8α and γδTCR expressions on total CD3+ cells in the small intestine of WT mice. CD8α+ γδ T-cell frequency in SI of indicated models. Each dot represents one mouse (n = 9 WT, 4 VA, 5 VAK). D, Images of SI from indicated models (n = 4/group) stained for Trdc mRNA; scale bar, 500 μm. E, γδ T-cell numbers in SI of indicated models. Each dot represents one mouse (n = 3 WT, 4 VAF/F, 4 VAF/FK). F, Image of γδ T-cell staining in tumor adjacent tissue and tumor tissue from human colon cancer sections (Scotland cohort, n = 141) where arrows indicate positively stained cells; scale bar, 500 μm. G, Density of γδ T cells in human colon cancer sections in three different patient cohorts: Scotland (n = 141), Norway (n = 71), and Thailand (n = 122). γδ T cells identified by IHC in full sections were quantified in tumor adjacent tissue or tumor tissue using Visiopharm. Data are presented as median ± min/max. H, Expressions of TRGV4 and TRGV9 mRNA in human colon cancer samples (n = 82) from the Scotland cohort determined by TempO-Seq. Data are presented as mean ± SD. *, P < 0.05; **, P < 0.01; ***, P < 0.001 (paired t test or one-way ANOVA followed by Dunnett post hoc test).
Figure 2.
γδ T cells are excluded from mouse and human gut tumors. A, Images of SI tissue from 4 WT (Cre-negative), tumor-bearing Villin-CreERT2;ApcF/+ (VA) and tumor-bearing Villin-CreERT2;ApcF/+;KrasG12D (VAK) mice stained for Trdc mRNA; scale bar, 500 μm. B, γδ T-cell numbers in SI tissue of indicated models. Each dot represents one mouse (n = 11 WT, 3 VA, 3 VAK). C, Representative flow cytometry plot of CD8α and γδTCR expressions on total CD3+ cells in the small intestine of WT mice. CD8α+ γδ T-cell frequency in SI of indicated models. Each dot represents one mouse (n = 9 WT, 4 VA, 5 VAK). D, Images of SI from indicated models (n = 4/group) stained for Trdc mRNA; scale bar, 500 μm. E, γδ T-cell numbers in SI of indicated models. Each dot represents one mouse (n = 3 WT, 4 VAF/F, 4 VAF/FK). F, Image of γδ T-cell staining in tumor adjacent tissue and tumor tissue from human colon cancer sections (Scotland cohort, n = 141) where arrows indicate positively stained cells; scale bar, 500 μm. G, Density of γδ T cells in human colon cancer sections in three different patient cohorts: Scotland (n = 141), Norway (n = 71), and Thailand (n = 122). γδ T cells identified by IHC in full sections were quantified in tumor adjacent tissue or tumor tissue using Visiopharm. Data are presented as median ± min/max. H, Expressions of TRGV4 and TRGV9 mRNA in human colon cancer samples (n = 82) from the Scotland cohort determined by TempO-Seq. Data are presented as mean ± SD. *, P < 0.05; **, P < 0.01; ***, P < 0.001 (paired t test or one-way ANOVA followed by Dunnett post hoc test).
Figure 3. Expression of butyrophilin-like molecules is reduced in gut tumors. A, Images of intestinal tissue from indicated models (n = 4) stained for Btnl1 mRNA. T, tumor; scale bar, 100 μm. B, Images of intestinal tissue from indicated models (n = 4) stained for Btnl1 mRNA; scale bar, 100 μm. C, Butyrophilin-like mRNA expression shown by bar graph generated from RNA-seq data from WT (n = 9), VAF/F (n = 36), and VAF/FK (n = 17) mice. Data are presented as mean ± SD. D, Expressions of BTNL3 and BTNL8 in normal human colonic tissue and tumor tissue from TCGA (n = 19 normal, 101 tumor; ref. 9) and Skrypczak (n = 24 normal, 45 tumor; ref. 27) datasets. Data are presented as median ± min/max. E–G, Correlation between indicated molecules as determined by TempO-Seq and γδ T-cell density determined by IHC in the Scotland cohort from 77 matched pairs. Units on axes are normalized read counts x 103. Each dot represents one tumor. P and r values determined by Pearson correlation. *, P < 0.05; **, P < 0.01; ***, P < 0.001 (Mann–Whitney U test or one-way ANOVA followed by Tukey post hoc test).
Figure 3.
Expression of butyrophilin-like molecules is reduced in gut tumors. A, Images of intestinal tissue from indicated models (n = 4) stained for Btnl1 mRNA. T, tumor; scale bar, 100 μm. B, Images of intestinal tissue from indicated models (n = 4) stained for Btnl1 mRNA; scale bar, 100 μm. C, Butyrophilin-like mRNA expression shown by bar graph generated from RNA-seq data from WT (n = 9), VAF/F (n = 36), and VAF/FK (n = 17) mice. Data are presented as mean ± SD. D, Expressions of BTNL3 and BTNL8 in normal human colonic tissue and tumor tissue from TCGA (n = 19 normal, 101 tumor; ref. 9) and Skrypczak (n = 24 normal, 45 tumor; ref. 27) datasets. Data are presented as median ± min/max. E–G, Correlation between indicated molecules as determined by TempO-Seq and γδ T-cell density determined by IHC in the Scotland cohort from 77 matched pairs. Units on axes are normalized read counts x 103. Each dot represents one tumor. P and r values determined by Pearson correlation. *, P < 0.05; **, P < 0.01; ***, P < 0.001 (Mann–Whitney U test or one-way ANOVA followed by Tukey post hoc test).
Figure 4. Activation of β-catenin decreases butyrophilin-like molecule expression. A and B, Correlation between indicated genes as determined by TempO-seq and γδ T-cell density determined by IHC in the Scotland cohort. Units on axes are normalized read counts × 103. Each dot represents one tumor (n = 77 left and 82 right). P and r values determined by Pearson correlation. C, Correlation between CTNNB1 or SOX9 expression and BTNL3 or BTNL8 expression in the Marisa cohort (28). Units on axes are normalized counts × 103. Each dot represents one tumor (n = 258). P and r values determined by Pearson correlation. D, Images of organoids derived from indicated mouse models taken 4 days after tamoxifen treatment. E, Fold change in expression levels of indicated genes in organoids from various genotypes measured at indicated days after tamoxifen treatment. Each dot represents one organoid derived from one mouse (n = 3). F, Fold change in expression levels of indicated genes in WT organoids treated with 3 or 10 μmol/L CHIR-99021 for indicated days. Each dot represents one organoid derived from one mouse (n = 3). Data are presented as mean ± SD. *, P < 0.05; **, P < 0.01; ***, P < 0.001 (one-way ANOVA followed by Dunnett post hoc test).
Figure 4.
Activation of β-catenin decreases butyrophilin-like molecule expression. A and B, Correlation between indicated genes as determined by TempO-seq and γδ T-cell density determined by IHC in the Scotland cohort. Units on axes are normalized read counts × 103. Each dot represents one tumor (n = 77 left and 82 right). P and r values determined by Pearson correlation. C, Correlation between CTNNB1 or SOX9 expression and BTNL3 or BTNL8 expression in the Marisa cohort (28). Units on axes are normalized counts × 103. Each dot represents one tumor (n = 258). P and r values determined by Pearson correlation. D, Images of organoids derived from indicated mouse models taken 4 days after tamoxifen treatment. E, Fold change in expression levels of indicated genes in organoids from various genotypes measured at indicated days after tamoxifen treatment. Each dot represents one organoid derived from one mouse (n = 3). F, Fold change in expression levels of indicated genes in WT organoids treated with 3 or 10 μmol/L CHIR-99021 for indicated days. Each dot represents one organoid derived from one mouse (n = 3). Data are presented as mean ± SD. *, P < 0.05; **, P < 0.01; ***, P < 0.001 (one-way ANOVA followed by Dunnett post hoc test).
Figure 5. HNF4A and HNF4G regulate butyrophilin-like molecule expression in normal gut tissue. A, Schematic of mouse and human promoter regions of indicated genes. Putative HNF4A/G-binding sites are shown in green; CDX1 and CDX2 binding sites are shown in orange. B, Images of CDX1, CDX2, HNF4A and HNF4G protein expressions in SI of WT mice (n = 4); scale bar, 500 μm. C, Integrative Genomics Viewer analysis of HNF4A/HNF4G ChIP-seq data at mouse Btnl gene loci. D, Fold change in expression levels of indicated genes in WT organoids transduced with shRNA constructs targeting Hnf4 g transcripts. Each dot represents one organoid from one mouse (n = 4). Data are presented as mean ± SD. E, Butyrophilin-like molecule expression determined by RNA-seq analysis of SI in indicated mouse models. Each dot represents one mouse (n = 3). Data are presented as mean ± SD. F, Images of organoids from WT mice treated with DMSO control or HNF4A/G inhibitor (HNF4i) representative of 3/group. Fold change in expression levels of indicated genes. Each dot represents one organoid from one mouse (n = 3). Data are presented as mean ± SD. G, Correlation between HNF4G expression as determined by TempO-seq and γδ T-cell density determined by IHC in the Scotland cohort. Units on axes are normalized counts x 103. Each dot represents one tumor (n = 77). P and r values determined by Pearson correlation. H, Correlation between BTNL3 or BTNL8 expression and HNF4G expression units on axes are normalized counts x 103. Each dot represents one tumor (n = 82 Scotland cohort, 258 Marisa cohort). P and r values determined by Pearson correlation. *, P < 0.05; **, P < 0.01; ***, P < 0.001 (unpaired t test or one-way ANOVA followed by Tukey post hoc test).
Figure 5.
HNF4A and HNF4G regulate butyrophilin-like molecule expression in normal gut tissue. A, Schematic of mouse and human promoter regions of indicated genes. Putative HNF4A/G-binding sites are shown in green; CDX1 and CDX2 binding sites are shown in orange. B, Images of CDX1, CDX2, HNF4A and HNF4G protein expressions in SI of WT mice (n = 4); scale bar, 500 μm. C, Integrative Genomics Viewer analysis of HNF4A/HNF4G ChIP-seq data at mouse Btnl gene loci. D, Fold change in expression levels of indicated genes in WT organoids transduced with shRNA constructs targeting Hnf4 g transcripts. Each dot represents one organoid from one mouse (n = 4). Data are presented as mean ± SD. E, Butyrophilin-like molecule expression determined by RNA-seq analysis of SI in indicated mouse models. Each dot represents one mouse (n = 3). Data are presented as mean ± SD. F, Images of organoids from WT mice treated with DMSO control or HNF4A/G inhibitor (HNF4i) representative of 3/group. Fold change in expression levels of indicated genes. Each dot represents one organoid from one mouse (n = 3). Data are presented as mean ± SD. G, Correlation between HNF4G expression as determined by TempO-seq and γδ T-cell density determined by IHC in the Scotland cohort. Units on axes are normalized counts x 103. Each dot represents one tumor (n = 77). P and r values determined by Pearson correlation. H, Correlation between BTNL3 or BTNL8 expression and HNF4G expression units on axes are normalized counts x 103. Each dot represents one tumor (n = 82 Scotland cohort, 258 Marisa cohort). P and r values determined by Pearson correlation. *, P < 0.05; **, P < 0.01; ***, P < 0.001 (unpaired t test or one-way ANOVA followed by Tukey post hoc test).
Figure 6. Activation of β-catenin decreases Hnf4a and Hnf4g expressions. A, Expressions of HNF4A and HNF4G in normal human colonic tissue and tumor tissue from TCGA (n = 19 normal, 101 tumor) and Skrypczak (n = 24 normal, 45 tumor) datasets. Data are presented as median ± minimum/maximum. *, P < 0.05 (Mann–Whitney U test). B, Hnf4a and Hnf4g expressions are determined by RNA-seq analysis of SI in WT (n = 9), VAF/F (n = 36), and VAF/FK (n = 17) mice. Each dot represents one mouse. C, Images of HNF4A and HNF4G protein expressions in SI of indicated models (n = 4); scale bar, 500 μm. D, Images of intestinal tissue from tumor-bearing VA mice stained for indicated proteins; scale bar, 500 μm. E, Fold change in expression levels of Hnf4a and Hnf4g in organoids from various genotypes measured at indicated days after tamoxifen treatment. Each dot represents one organoid from one mouse (n = 3). F, Fold change in expression levels of Hnf4a and Hnf4g in WT organoids treated with 3 or 10 μmol/L CHIR-99021 for indicated days. Each dot represents one organoid from one mouse (n = 3). Data are presented as mean ± SD. **, P < 0.01; ***, P < 0.001 (one-way ANOVA followed by Dunnett post hoc test).
Figure 6.
Activation of β-catenin decreases Hnf4a and Hnf4g expressions. A, Expressions of HNF4A and HNF4G in normal human colonic tissue and tumor tissue from TCGA (n = 19 normal, 101 tumor) and Skrypczak (n = 24 normal, 45 tumor) datasets. Data are presented as median ± minimum/maximum. *, P < 0.05 (Mann–Whitney U test). B,Hnf4a and Hnf4g expressions are determined by RNA-seq analysis of SI in WT (n = 9), VAF/F (n = 36), and VAF/FK (n = 17) mice. Each dot represents one mouse. C, Images of HNF4A and HNF4G protein expressions in SI of indicated models (n = 4); scale bar, 500 μm. D, Images of intestinal tissue from tumor-bearing VA mice stained for indicated proteins; scale bar, 500 μm. E, Fold change in expression levels of Hnf4a and Hnf4g in organoids from various genotypes measured at indicated days after tamoxifen treatment. Each dot represents one organoid from one mouse (n = 3). F, Fold change in expression levels of Hnf4a and Hnf4g in WT organoids treated with 3 or 10 μmol/L CHIR-99021 for indicated days. Each dot represents one organoid from one mouse (n = 3). Data are presented as mean ± SD. **, P < 0.01; ***, P < 0.001 (one-way ANOVA followed by Dunnett post hoc test).
Figure 7. Inhibition of β-catenin transcriptional activity increases expression of HNF4A, HNF4G, and butyrophilin-like molecules. A, Vγ7+ cell viability in cocultures with CT26 or CT26-B1/6 cells. Each dot represents one paired biological replicate (n = 4). B, CD25 expression by Vγ7+ cells in cocultures with CT26 or CT26-B1/6 cells. Each dot represents one paired biological replicate (n = 4). C, CT26 and CT26-B1/6 cancer cell death using flow cytometry after coculture with Vγ7+ cell as indicated. Each dot represents one biological replicate (n = 4). D, Kaplan–Meier survival analysis of doxycycline-treated CT26 and CT26-B1/6 tumor-bearing mice (n = 4 CT26, 5 CT26-B1/6) using the log-rank test. E, γδ T-cell numbers in tumors from doxycycline-treated CT26 and CT26-B1/6 tumor-bearing mice. Each dot represents one mouse (n = 4 CT26, 5 CT26-B1/6). F and H, Images taken from serially stained sections of indicated protein in tumors from indicated mouse models (n = 3–4; scale bar, 500 μm. G and I, Images of Trdc expression in tumors from indicated mouse models; scale bar, 500 μm. γδ T-cell numbers in tumors. Each dot represents one mouse. Data are presented as mean ± SD. *, P < 0.05; **, P < 0.01 (paired t test or unpaired t test or one-way ANOVA followed by Tukey post hoc test).
Figure 7.
Inhibition of β-catenin transcriptional activity increases expression of HNF4A, HNF4G, and butyrophilin-like molecules. A, Vγ7+ cell viability in cocultures with CT26 or CT26-B1/6 cells. Each dot represents one paired biological replicate (n = 4). B, CD25 expression by Vγ7+ cells in cocultures with CT26 or CT26-B1/6 cells. Each dot represents one paired biological replicate (n = 4). C, CT26 and CT26-B1/6 cancer cell death using flow cytometry after coculture with Vγ7+ cell as indicated. Each dot represents one biological replicate (n = 4). D, Kaplan–Meier survival analysis of doxycycline-treated CT26 and CT26-B1/6 tumor-bearing mice (n = 4 CT26, 5 CT26-B1/6) using the log-rank test. E, γδ T-cell numbers in tumors from doxycycline-treated CT26 and CT26-B1/6 tumor-bearing mice. Each dot represents one mouse (n = 4 CT26, 5 CT26-B1/6). F and H, Images taken from serially stained sections of indicated protein in tumors from indicated mouse models (n = 3–4; scale bar, 500 μm. G and I, Images of Trdc expression in tumors from indicated mouse models; scale bar, 500 μm. γδ T-cell numbers in tumors. Each dot represents one mouse. Data are presented as mean ± SD. *, P < 0.05; **, P < 0.01 (paired t test or unpaired t test or one-way ANOVA followed by Tukey post hoc test).

References

    1. Morikawa R, Nemoto Y, Yonemoto Y, Tanaka S, Takei Y, Oshima S, et al. . Intraepithelial lymphocytes suppress intestinal tumor growth by cell-to-cell contact via CD103/E-cadherin signal. Cell Mol Gastroenterol Hepatol 2021;11:1483–503. - PMC - PubMed
    1. Reis BS, Darcy PW, Khan IZ, Moon CS, Kornberg AE, Schneider VS, et al. . TCR-vgammadelta usage distinguishes protumor from antitumor intestinal gammadelta T-cell subsets. Science 2022;377:276–84. - PMC - PubMed
    1. Lebrero-Fernandez C, Bergstrom JH, Pelaseyed T, Bas-Forsberg A. Murine butyrophilin-like 1 and Btnl6 form heteromeric complexes in small intestinal epithelial cells and promote proliferation of local T lymphocytes. Front Immunol 2016;7:1. - PMC - PubMed
    1. Bas A, Swamy M, Abeler-Dorner L, Williams G, Pang DJ, Barbee SD, et al. . Butyrophilin-like 1 encodes an enterocyte protein that selectively regulates functional interactions with T lymphocytes. Proc Natl Acad Sci U S A 2011;108:4376–81. - PMC - PubMed
    1. Di Marco Barros R, Roberts NA, Dart RJ, Vantourout P, Jandke A, Nussbaumer O, et al. . Epithelia use butyrophilin-like molecules to shape organ-specific gammadelta T-cell compartments. Cell 2016;167:203–18. - PMC - PubMed

Publication types

MeSH terms