

Detecting GPCR Signals With Optical Biosensors of Gα-GTP in Cell Lines and Primary Cell Cultures
- PMID: 37310083
- PMCID: PMC10266833
- DOI: 10.1002/cpz1.796
Detecting GPCR Signals With Optical Biosensors of Gα-GTP in Cell Lines and Primary Cell Cultures
Abstract
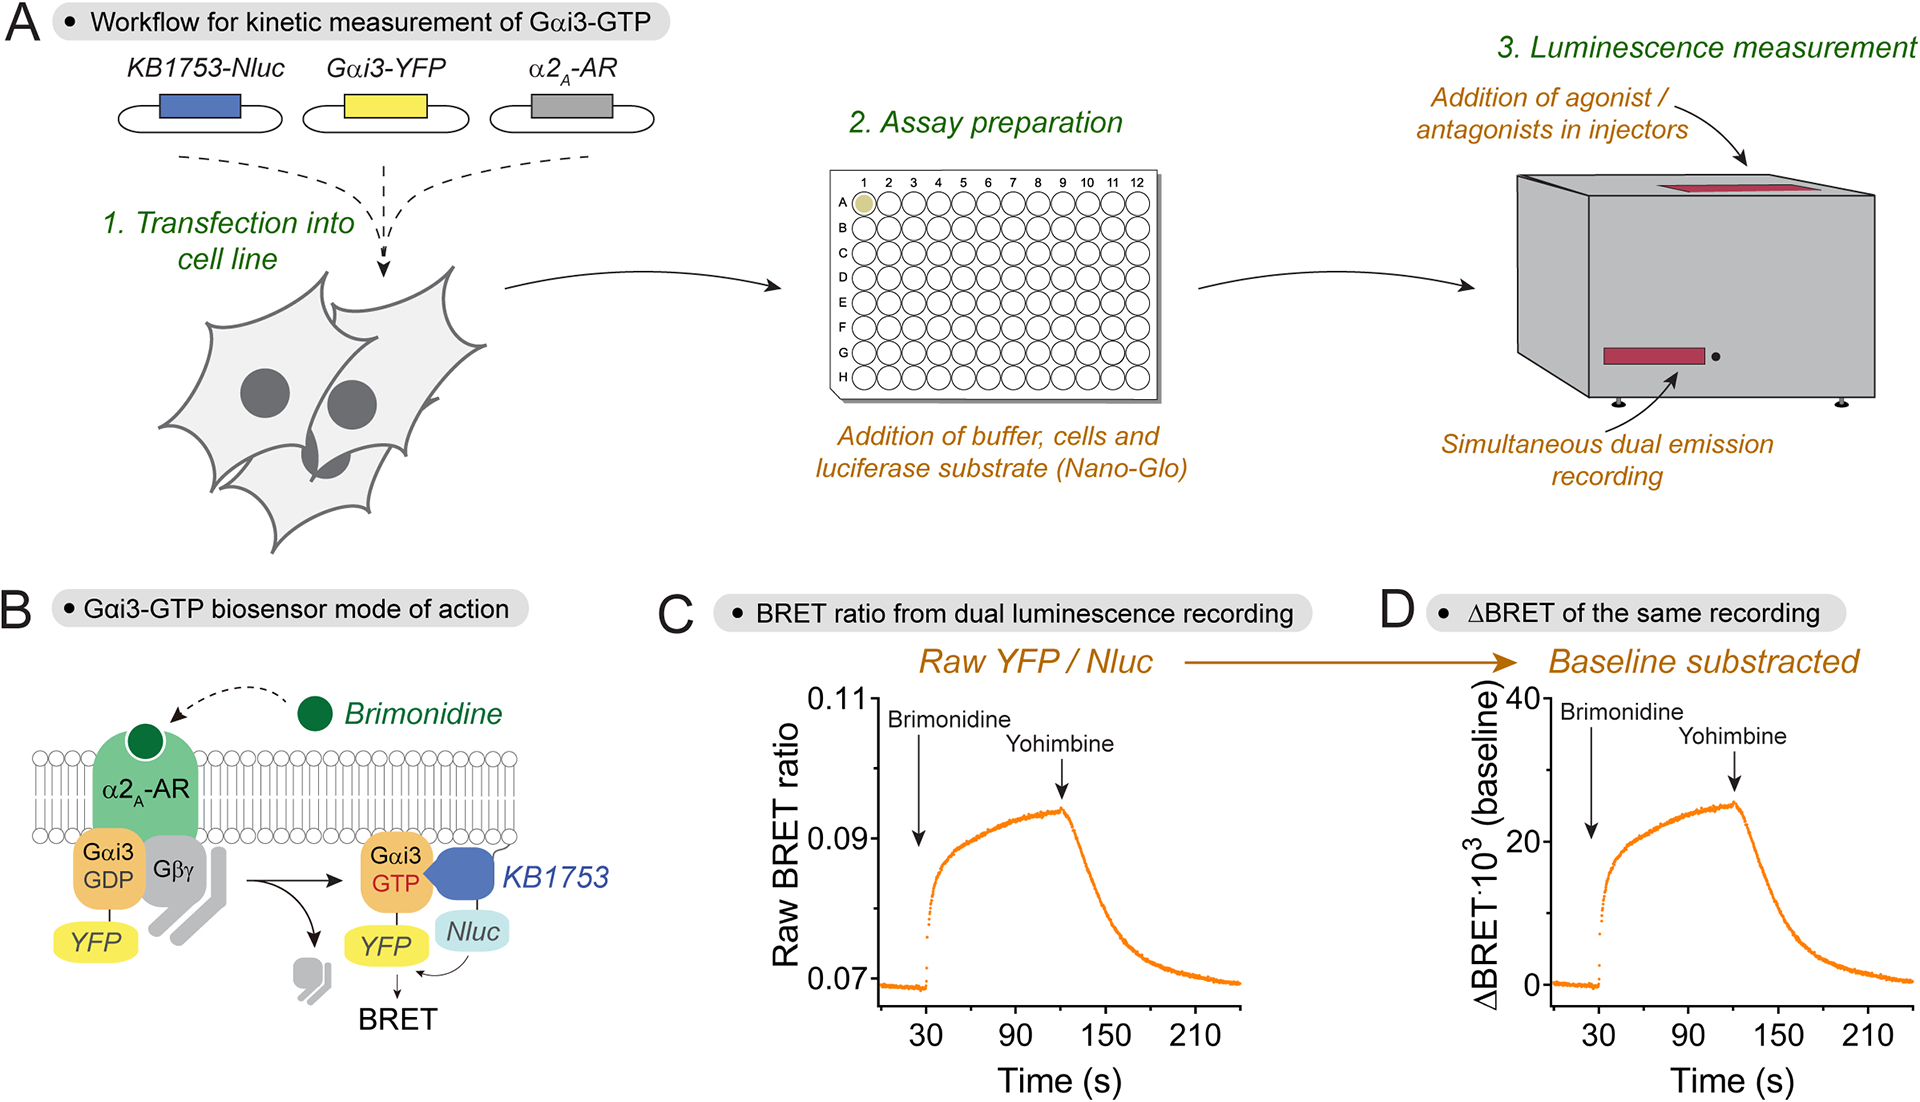
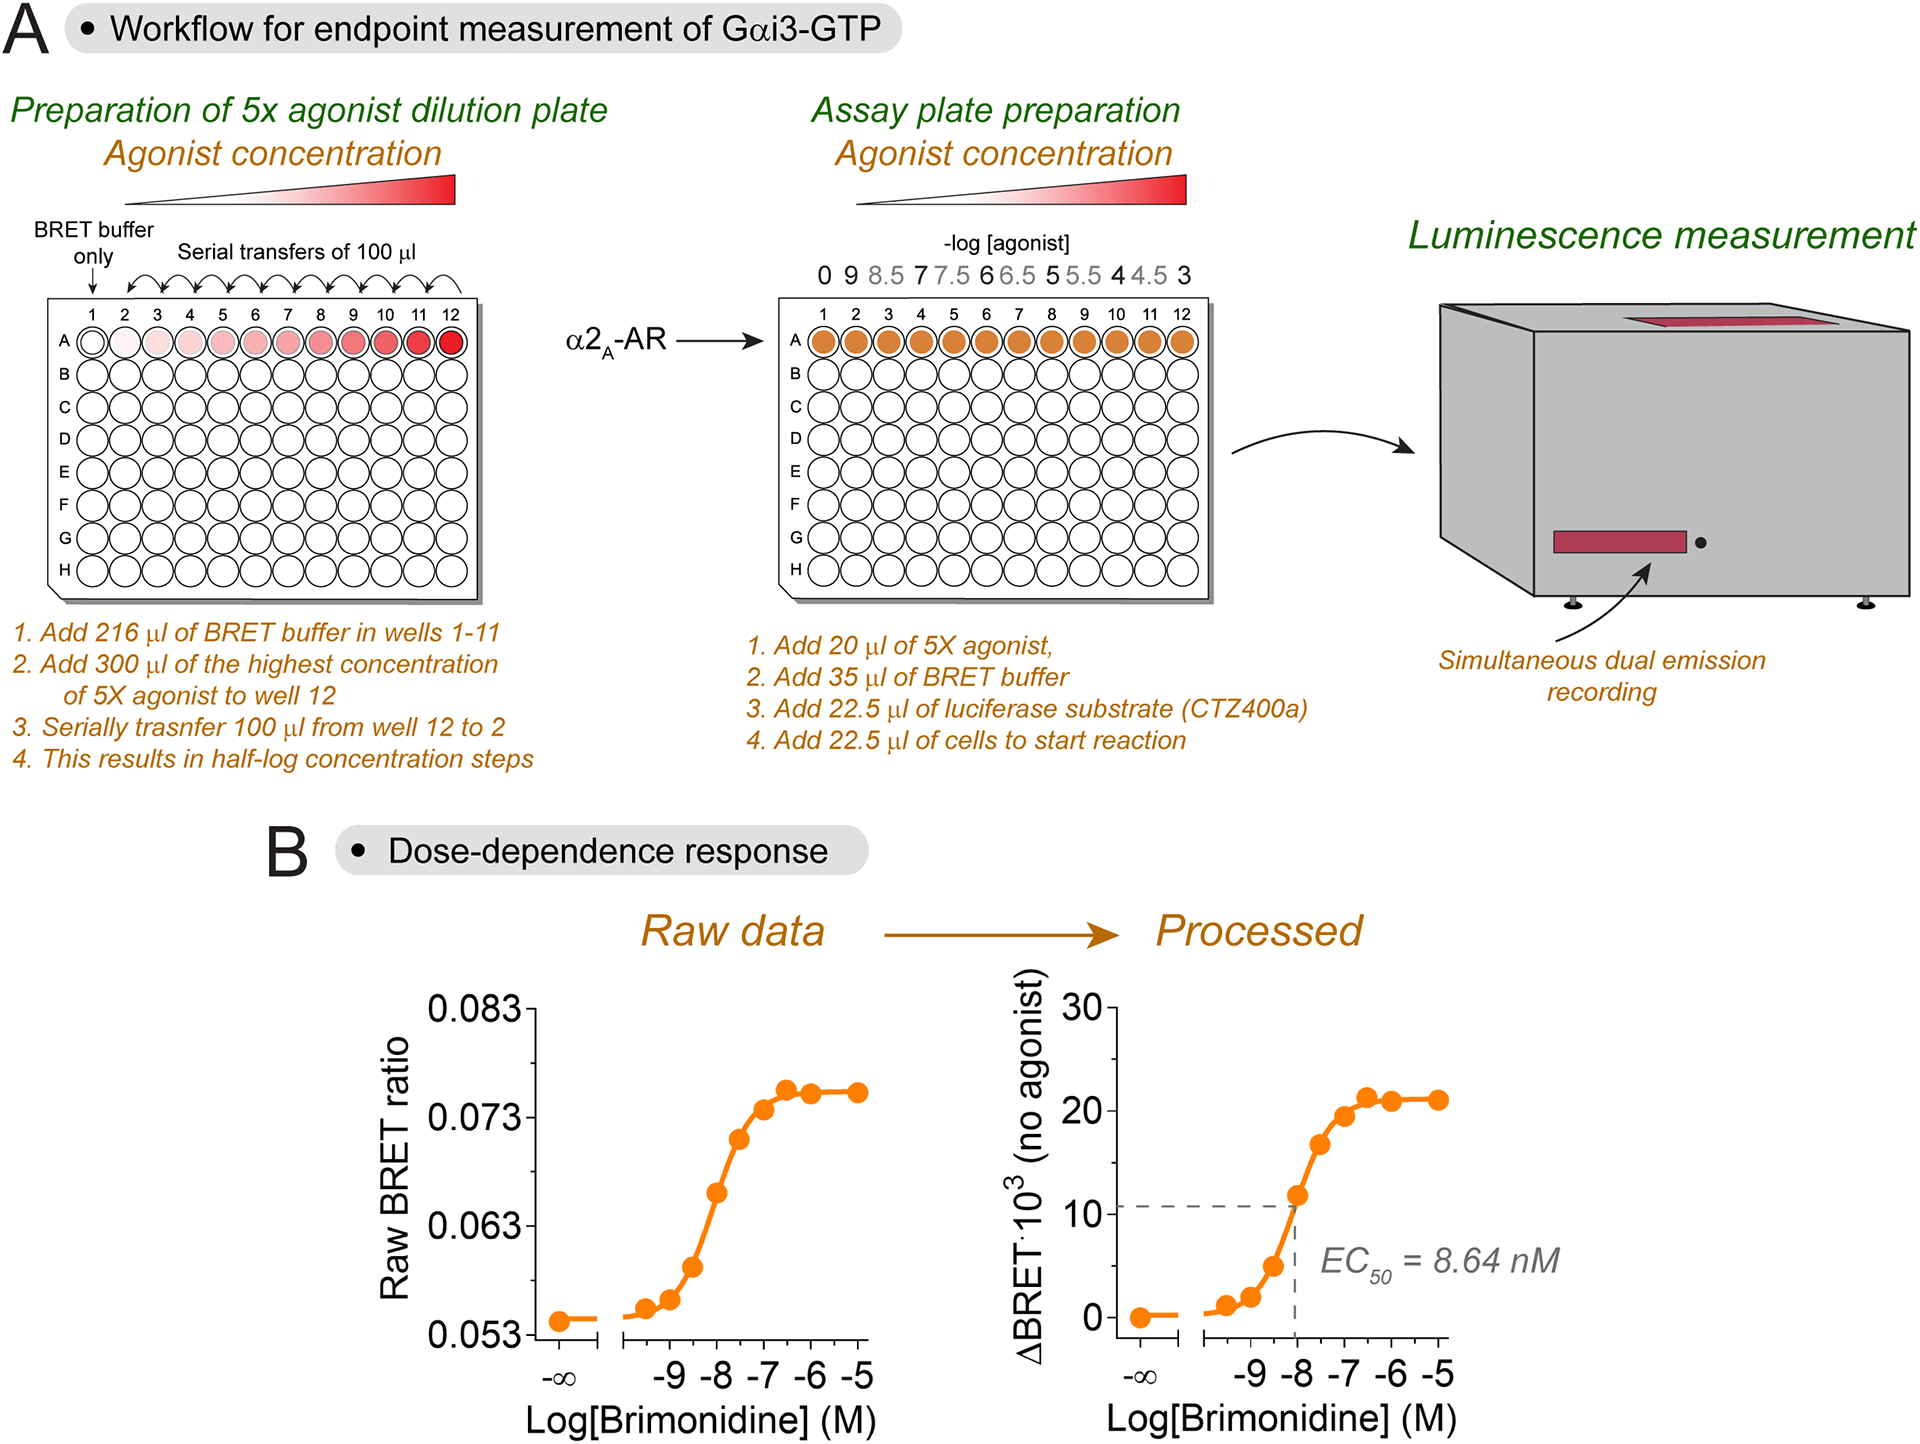
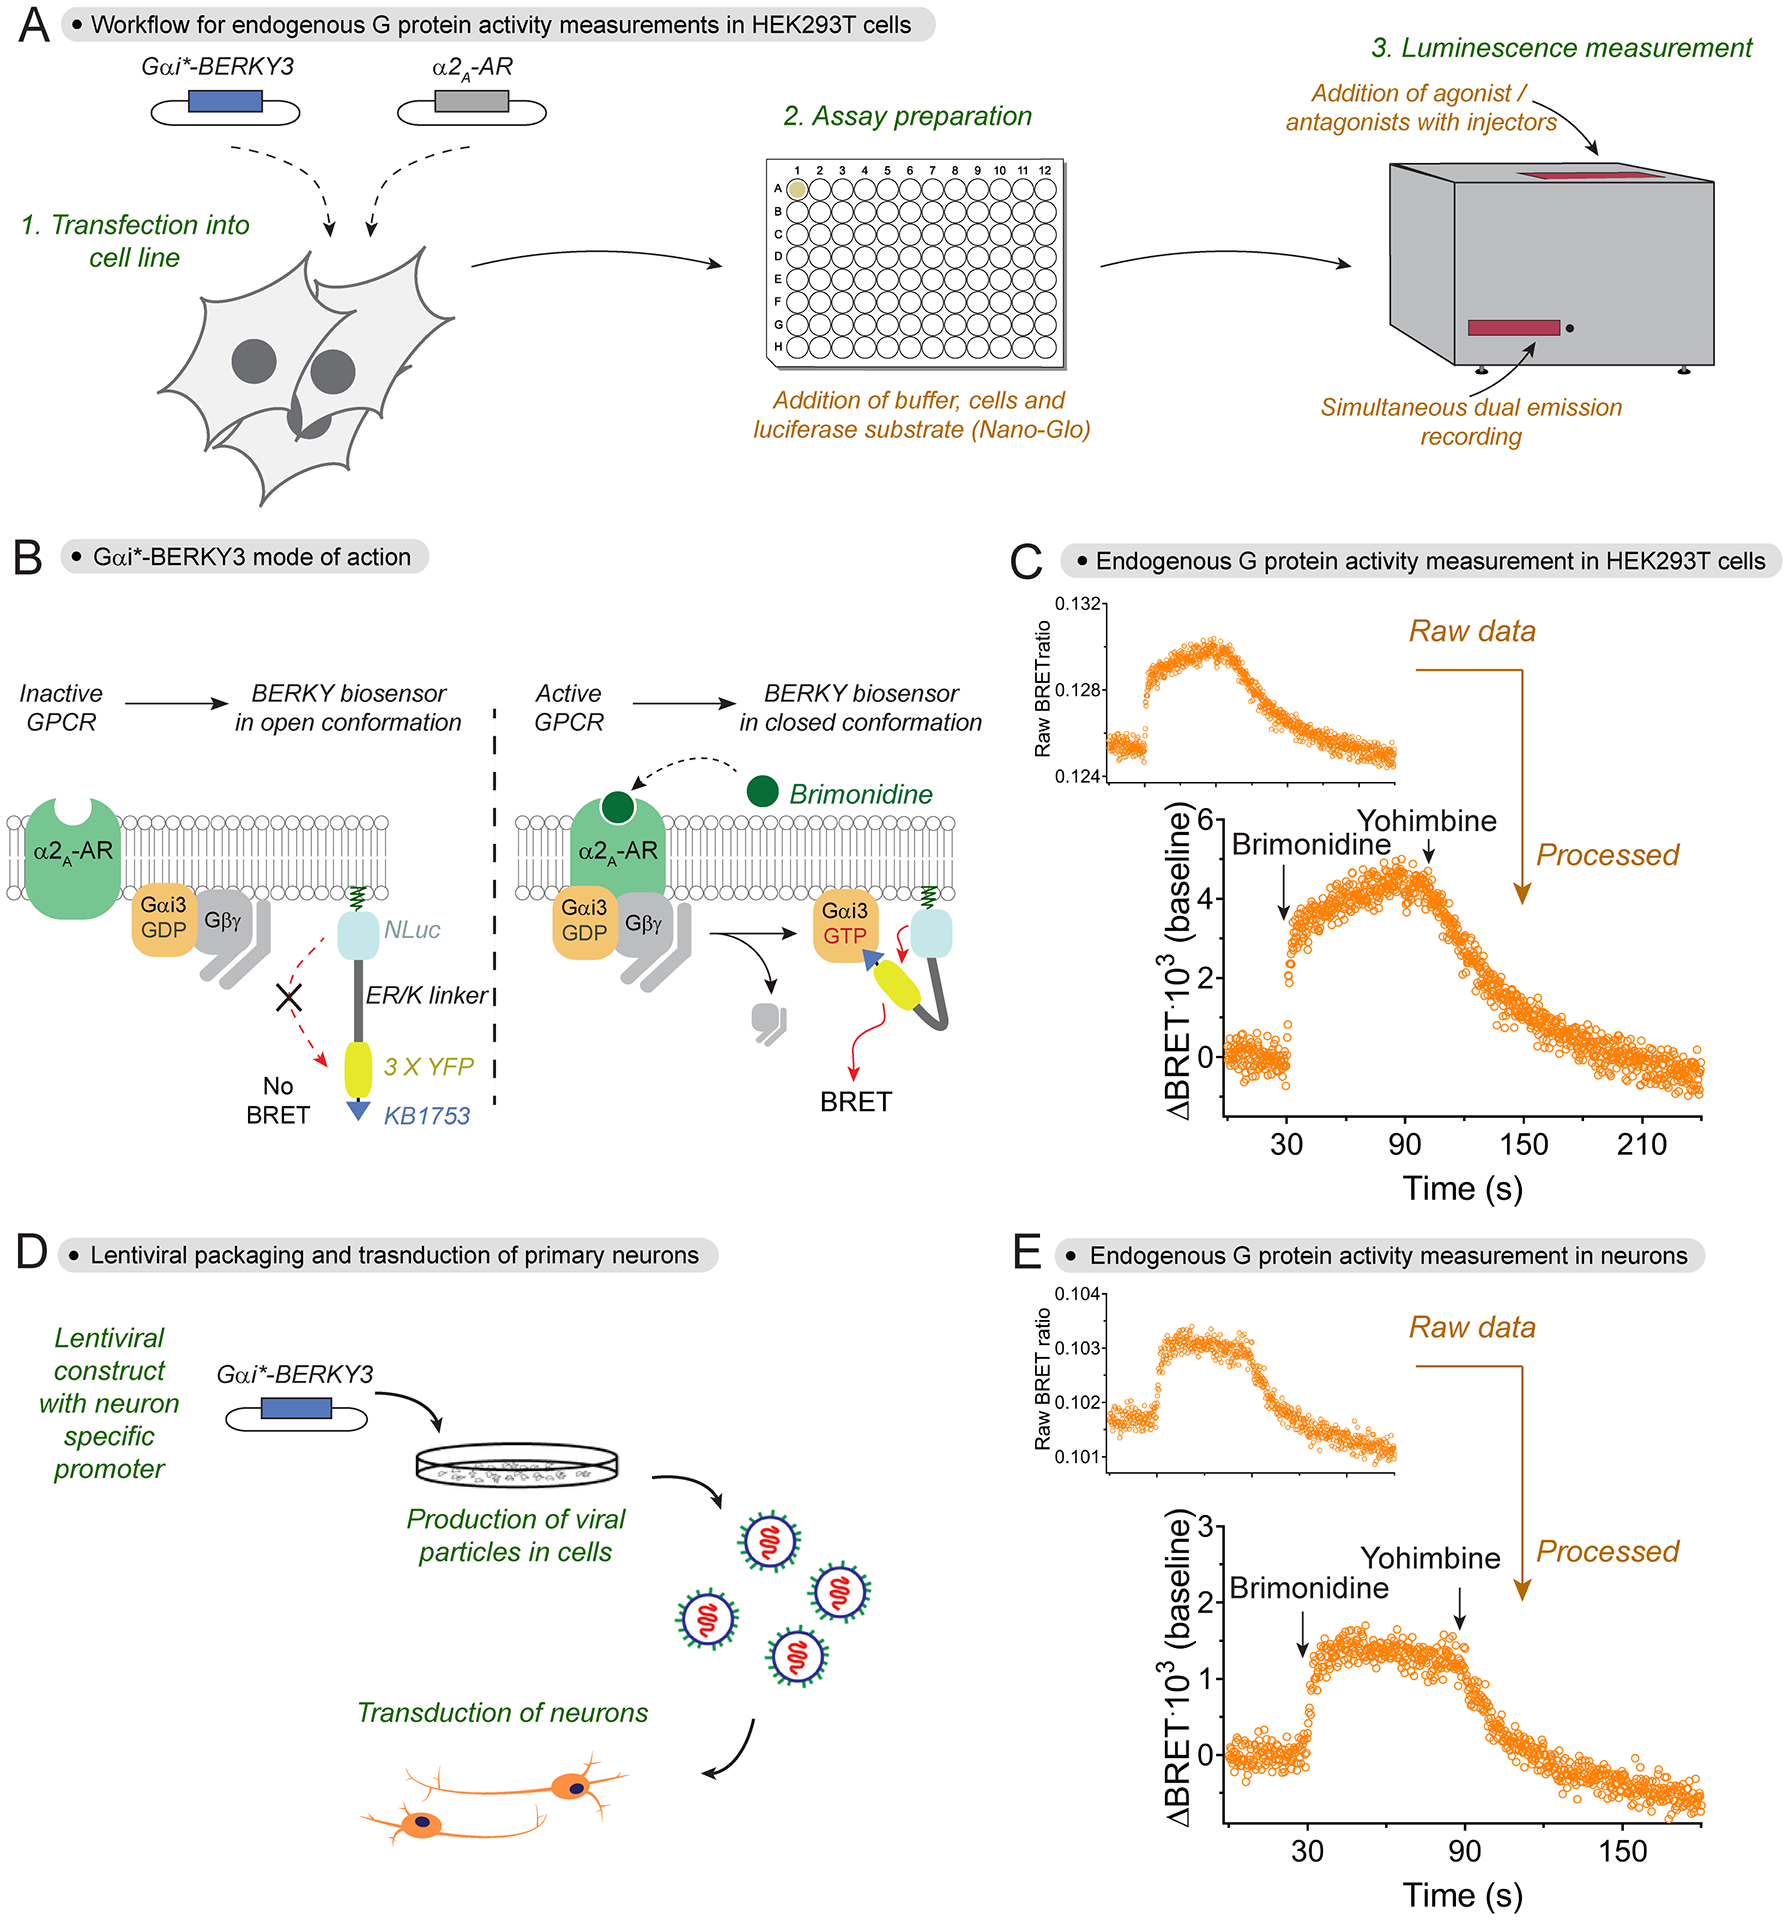
G protein-coupled receptors (GPCRs) are the largest class of transmembrane receptors and mediate a wide variety of physiological processes. GPCRs respond to a plethora of extracellular ligands and initiate signaling pathways inside cells via heterotrimeric G proteins (Gαβγ). Because of the critical role GPCRs play in regulating biological processes and as pharmacological targets, the availability of tools to measure their signaling activity are of high interest. Live-cell biosensors that detect the activity of G proteins in response to GPCR stimulation have emerged as a powerful approach to investigate GPCR/G protein signaling. Here, we detail methods to monitor G protein activity through direct measurement of GTP-bound Gα subunits using optical biosensors based on bioluminescence resonance energy transfer (BRET). More specifically, this article describes the use of two types of complementary biosensors. The first protocol explains how to use a multicomponent BRET biosensor that relies on expression of exogenous G proteins in cell lines. This protocol yields robust responses that are compatible with endpoint measurements of dose-dependent ligand effects or with kinetic measurements of subsecond resolution. The second protocol describes the implementation of unimolecular biosensors that detect the activation of endogenous G proteins in cell lines expressing exogenous GPCRs or in primary cells upon stimulation of endogenous GPCRs. Overall, using the biosensors as described in this article will help users characterize the mechanisms of action of many pharmacological agents and natural ligands that modulate GPCR and G protein signaling with high precision. © 2023 Wiley Periodicals LLC. Basic Protocol 1: Using bimolecular BRET biosensors to monitor Gα-GTP formation of tagged Gα in live cells Alternate Protocol 1: Measuring GPCR dose-dependent Gα-GTP responses in endpoint format Basic Protocol 2: Using unimolecular BRET biosensors to study endogenous G protein activity Alternate Protocol 2: Using unimolecular BRET biosensors to study endogenous G protein activity in mouse cortical neurons.
Keywords: BRET; G protein; G protein-coupled receptors; GTPase; bioluminescence energy transfer; optical biosensor.
© 2023 Wiley Periodicals LLC.
Conflict of interest statement
CONFLICT OF INTEREST STATEMENT:
The authors declare no conflicts of interest.
Figures
Similar articles
-
Revealing the Activity of Trimeric G-proteins in Live Cells with a Versatile Biosensor Design.Cell. 2020 Aug 6;182(3):770-785.e16. doi: 10.1016/j.cell.2020.06.020. Epub 2020 Jul 6. Cell. 2020. PMID: 32634377 Free PMC article.
-
Can BRET-based biosensors be used to characterize G-protein mediated signaling pathways of an insect GPCR, the Schistocerca gregaria CRF-related diuretic hormone receptor?Insect Biochem Mol Biol. 2020 Jul;122:103392. doi: 10.1016/j.ibmb.2020.103392. Epub 2020 May 5. Insect Biochem Mol Biol. 2020. PMID: 32387240
-
Quantitative assessment of constitutive G protein-coupled receptor activity with BRET-based G protein biosensors.Sci Signal. 2021 Sep 7;14(699):eabf1653. doi: 10.1126/scisignal.abf1653. Epub 2021 Sep 7. Sci Signal. 2021. PMID: 34516756
-
Signaling through G protein coupled receptors.Plant Signal Behav. 2009 Oct;4(10):942-7. doi: 10.4161/psb.4.10.9530. Epub 2009 Oct 14. Plant Signal Behav. 2009. PMID: 19826234 Free PMC article. Review.
-
Genetically encoded fluorescent biosensors for GPCR research.Front Cell Dev Biol. 2022 Sep 29;10:1007893. doi: 10.3389/fcell.2022.1007893. eCollection 2022. Front Cell Dev Biol. 2022. PMID: 36247000 Free PMC article. Review.
Cited by
-
Essential strategies for the detection of constitutive and ligand-dependent Gi-directed activity of 7TM receptors using bioluminescence resonance energy transfer.bioRxiv [Preprint]. 2024 Dec 9:2024.12.04.626681. doi: 10.1101/2024.12.04.626681. bioRxiv. 2024. PMID: 39713355 Free PMC article. Preprint.
-
Direct interrogation of context-dependent GPCR activity with a universal biosensor platform.Cell. 2024 Mar 14;187(6):1527-1546.e25. doi: 10.1016/j.cell.2024.01.028. Epub 2024 Feb 26. Cell. 2024. PMID: 38412860 Free PMC article.
-
The guanine nucleotide exchange factor Ric-8A regulates the sensitivity of constitutively active Gαq to the inhibitor YM-254890.J Biol Chem. 2025 May;301(5):108426. doi: 10.1016/j.jbc.2025.108426. Epub 2025 Mar 19. J Biol Chem. 2025. PMID: 40118458 Free PMC article.
-
Quantitative approaches for studying G protein-coupled receptor signalling and pharmacology.J Cell Sci. 2025 Jan 1;138(1):JCS263434. doi: 10.1242/jcs.263434. Epub 2025 Jan 15. J Cell Sci. 2025. PMID: 39810711 Free PMC article. Review.
-
Discovery of a Novel Chemo-Type for TAAR1 Agonism via Molecular Modeling.Molecules. 2024 Apr 11;29(8):1739. doi: 10.3390/molecules29081739. Molecules. 2024. PMID: 38675561 Free PMC article.
References
MeSH terms
Substances
Grants and funding
LinkOut - more resources
Full Text Sources
